Bitcoin Perfectly hit at Bearish Order Block so What Next ?As per my analysis yesterday, #Bitcoin price perfectly hit the bearish order block around ~$64,000, and now I'm expecting a down move toward $60,000 again.
Bearish OB: Filled
FVG: Filled
My short position stop loss: Any 4H candle close above $64,200.
J-BNB

Is BNBUSDT on the Brink of a Major Bullish Breakout?Yello! Did you see how BNBUSDT has taken liquidity and formed an inverse head and shoulders pattern? This setup is raising the odds of a bullish move! But there's more to the story. Let’s dive into the details:
💎For this bullish scenario to play out, BNB must break out of the resistance zone and close a candle above it. This would indicate a potential move up to the next swing or resistance levels.
💎In the event of a pullback, we can anticipate a bounce from the Bullish Order Block (OB). However, for confirmation, we need to see an I-CHoCH (internal Change of Character) that aligns with a bullish market structure. This would further increase the probability of a favorable outcome.
💎On the flip side, if the price breaks down below the Bullish OB and closes a candle beneath it, our entire idea and pattern would be invalidated. This would suggest a different market direction, requiring us to reassess our strategy.
As always, it's crucial to stay disciplined and patient. The market can be unpredictable, and only those who stick to their strategies will thrive.
MyCryptoParadise
iFeel the success🌴

Massive BNB Breakout Imminent? Don’t Miss This Crucial Analysis!Yello Paradisers! Are you ready to dive into a potential game-changing move for BNB? Let’s get into the details.
💎 The recent bullish momentum has broken key levels, indicating potential for further gains.
💎 BNB is showing signs of inducement near the bullish OB, a key area to watch.
💎 If BNB breaks the resistive trendline and forms a W pattern, the probability of a bullish move increases.
💎 For confirmation, we need a breakout above the resistance zone. This could signal a strong bullish move.
💎 In case of a pullback, a bounce from the bullish OB is expected. However, we need a Change of Character (I-CHoCH) in lower timeframes for confirmation.
💎 If BNB breaks down and closes below the bullish OB, it invalidates our bullish thesis.
Trade smart, Paradisers, and stay disciplined. Your long-term success depends on strategic and well-timed moves.
MyCryptoParadise
iFeel the success🌴

Bullish Pennant Breakout: Retest Targets $1,000 MilestoneBinance Coin ( CRYPTOCAP:BNB ) has recently formed a bullish pennant pattern, suggesting a strong potential for upward movement. This technical formation, characterized by converging trend lines following a significant price increase, indicates that the market is consolidating before potentially continuing its upward trend.
The breakout from this bullish pennant has been accompanied by substantial trading volume, reinforcing the likelihood of a sustained move higher. With the retest of the breakout level successfully holding, the technical outlook is bullish, pointing to a potential target of $1,000. Achieving this target would represent a significant 68% return from the current price level, offering a promising opportunity for traders and investors.
Key factors to watch include the continuation of high trading volume and maintaining the breakout level support, which will be crucial in confirming the strength of this bullish move towards the $1,000 target.

BNBUSDT's Cup & Handle: Ready for a Bullish Surge?💎 Paradisers, #BNBUSDT has formed a cup and handle pattern, increasing the likelihood of a bullish move.
💎 If #BNB closes a candle above the resistance zone, it will validate the pattern, and we can then expect a bullish move.
💎 In the case of a pullback, we can anticipate a bounce from the demand level, but we need an Internal Change of Character (I-CHoCH) towards the bullish market structure for confirmation.
💎 However, if there is a breakdown and a candle closes below the demand level, it will invalidate our entire bullish idea. In that case, it would be better to disregard this setup and wait for more favorable price action to develop.
MyCryptoParadise
iFeel the success🌴

BNB into the 1000s#BNB / Weekly
We are currently ranging for the past 3 years and a break above the range resistance will put BNB above 1000

Solana Price Analysis: Will SOL Rally To $500 In Current BullRun#SOLANA/USDT Chart Analysis
HTF Perspective: The SOLANA chart looks extremely bullish on the higher timeframe (HTF). A bullish Cup & Handle pattern is emerging, signaling a potential massive upward trend.
Cup & Handle Pattern: According to my analysis, the Cup has already been completed, and we are awaiting the formation of the Handle. The handle's bottom is likely to form around $50, which presents a great opportunity to accumulate SOLANA in large quantities.
Key Takeaways:
➡ The cup pattern is completed, and the handle pattern is in the works.
➡ The handle bottom could form around $50, presenting a prime buying opportunity.
➡ Once the handle pattern completes, a significant upward move is likely.
➡ Long-term targets are around $500 to $1000.
Price Levels:
➡ Strong Support: $84/$46
➡ Resistance: $200
Current Update: I initially highlighted this pattern when CRYPTOCAP:SOL was trading at $190, and now it's touched $116. If you booked profit at the top, well done!
Disclaimer: This is not financial advice. Do your own research before investing in any cryptocurrencies.

1 $BNB = 1000 USDT:BINANCE:BNBUSDT is expected to reach 1k USDT soon, with a lot of upcoming news.
If you spot any market dips, don't let them pass you by.
While it may take some time, But, investing in Binance is regarded as a safe bet in the crypto market.

ORDI/USDT Chart AnalysisORDI/USDT Chart Analysis
▪️300% Potential From This Level
▪️RED BOX is our SL if Trend Reverse
▪️BULL FLAG in Daily Time Frame
▪️Accumulation Zone: $70-$60
▪️Daily Candle Close below $56 Mean Exit
#ORDI #TechnicalAnalysis #Crypto

BNB COIN BREAKOUT OCCURREDBNB COIN BREAKOUT OCCURRED
BNB showing a strong trendline breaking
So here a good sinario occurred for selling
Sell with a good amount
Never hesitate to sell because it's a strong signal because
1. It's breaked the strong NECKLINE
2. ITS seen rarely in chat it's very difficult to find such trade
Thank you trade safely
Stay happy

ROSE/USDT Bearish Divergence forming in Weekly chartBCBA:ROSE Bearish Divergence Alert
1⃣ Bearish Divergence Forming in Weekly Chart
2⃣ Targets: $0.1/$0.06 with SL = $0.1851 (RR = 1:5 )
3⃣ Market is highly Volatile so Dont try with High leverage
4⃣ Big Dump will be the best Long Term Accumulation strategy
5⃣ Long-Term Bullish Target = $1

BNB: Determined to reach the All-Time High. #BNB Update:
Following BTC's lead, large M-Cap altcoins are also gaining momentum, and BNB is no exception. With a remarkable 120% rally from the breakout point, BNB still has room to grow, aiming for the ATH that is only 20% away. I'm expecting BNB to reach the ATH or even break above it before the BTC halving or correction.
DYOR.
#BNB #Crypto

RUNE/USDT 764% Up from Our Entry zoneRUNE/USDT Profit Analysis
1⃣ CRYPTOCAP:RUNE Currently 764% up from our Entry Setup
2⃣ Entry Zone: $1-$0.8 ✅
3⃣ I am Expecting $20-$30 in this bull Run
4⃣ If your Entry is Around $1 then don't forget to secure some Profit
5⃣ Strong Support = $4.10
6⃣ #THORChain is a decentralized liquidity protocol that enables cross-chain asset exchange.

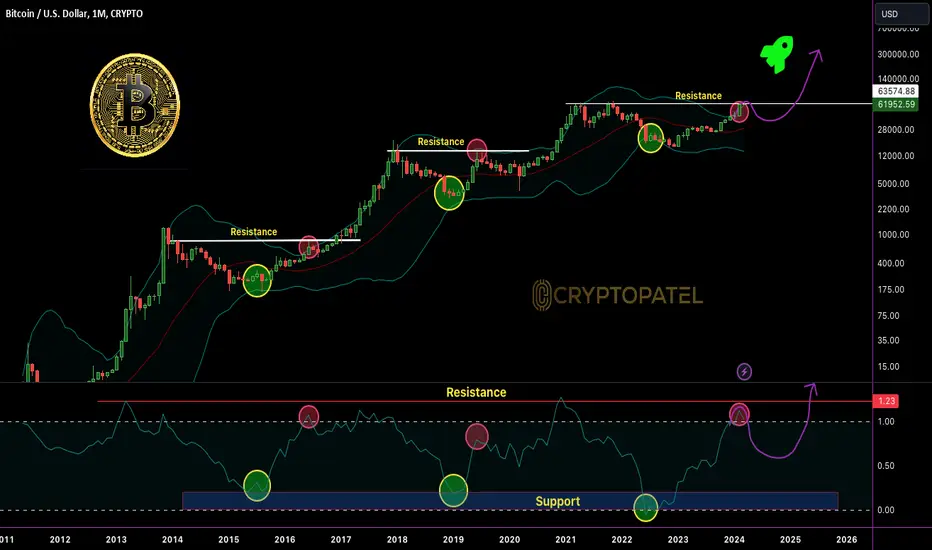
BITCOIN READY TO FLY ?The #BITCOIN party is just getting started
Bollinger bands are still tight - massive expansion ahead.
This bull run is in the early innings.
HODL on, the best is yet to come!
NFA
BNB/Binance Coin Trade Idea - BNB is currently trading in a zone where all its FUD has evaporated
- The structure looks super strong except for the inducements that it's certainly going to have
- I will look to add BNB swings once it starts retracing and hold it until it gives me a strong gain of 30-50%
- Risk minimized to 10%

Ocean Protocol (OCEAN) Price Prediction 2024, 2025–2030Ocean Protocol (OCEAN) Price Prediction 2024, 2025–2030
A symmetrical triangle is a chart pattern that shows two converging trend lines that connect a series of sequential peaks and troughs. The trend lines should converge at a roughly equal slope.
Ocean Protocol price prediction 2025
The Ocean Protocol price prediction for 2025 is currently between $ 0.409910 on the lower end and $ 1.921728 on the high end. Compared to today’s price, Ocean Protocol could gain 362.55% by 2025 if OCEAN reaches the upper price target.
Ocean Protocol price prediction 2030
The Ocean Protocol price prediction for 2030 is currently between $ 0.884510 on the lower end and $ 2.71 on the high end. Compared to today’s price, Ocean Protocol could gain 551.37% by 2030 if it reaches the upper price target.

Bitcoin Bearish Divergence Target $30,000 ?#Bitcoin Bearish Divergence Into Play
CRYPTOCAP:BTC showing concerning signs, but I remain long-term bullish despite short-term uncertainties.
Bearish divergence + RSI below resistance could spur pullback if $44k fails.
If so, watch $43.5k-$44k level.
Lose that and we may see $30k
But hold> $44k = rally to $51k.
Weigh scenarios carefully friends.
➡️ Bearish divergence forming
➡️ RSI struggling below resistance
➡️ $44k Critical Resistance
➡️ Below that could hit $30k
➡️ But over $44k keeps $51k+

uma price preditionThe chart shows the price of UMA/USDT on the Binance exchange over the past two hours. The price is currently 5.21 USDT, down 1.27% from the previous day.
The chart shows a few technical indicators, including the Relative Strength Index (RSI) and the Moving Average Convergence Divergence (MACD). The RSI is currently below 30, which is considered oversold territory. This could indicate that the price is due for a correction. The MACD is also bearish, which suggests that downward momentum is currently stronger than upward momentum.
Overall, the technical indicators suggest that the price of UMA/USDT is likely to continue to decline in the short term. However, it is important to remember that technical analysis is not always accurate, and other factors, such as news events or changes in market sentiment, could also affect the price.

Bitcoin Ready for $30700 ?#Bitcoin Fresh Update:
CRYPTOCAP:BTC Ready for Another -25% Dump if $41600 Level not Breakout upward Side.
I am Planning to Buy More #BTC around $30,000
I'm Short Term Bearish & Long Term Bullish.

TIA/USDT Ready for -50% Dump ?#Celestia Dump Alert
➡️ LSE:TIA bullish trend has been broken, and it's now testing the $16.50 support level.
➡️ I am Expecting -50% Dump From This Level.
If you're looking to enter the market, $7 could be a good entry point.
Support: $13.86, $9.82, $7.10
Resistance: $17
Note: #TIA/USDT Pumped ~10x within 2.5 Months.
From $2.13 to $20.39 Journey in 82 Days.
Stay tuned for updates!

Bitcoin ( $BTC ) Surges Past $45,000 for First Time Since April Bitcoin ( CRYPTOCAP:BTC ) Surges Past $45,000 for First Time Since April 2022!
In the early hours of the day, Bitcoin's price surpassed $45,000 for the first time since April 2022, driven by expectations of a U.S. Securities and Exchange Commission ( #SEC ) approval for a spot Bitcoin exchange-traded fund (ETF).
Are you ready for the next wave of crypto growth?
Strong Resistance: $48600-$50600
#Bitcoin #Crypto #ETF #BitcoinETF

EDU/USDT Bullish Scenario Chart AnalysisEDU/USDT Chart Analysis: Long-Term Bullish Outlook! NYSE:EDU
EDU/USDT chart is looking quite promising for a long-term run!
I am currently seeing a pattern:
Accumulation ➡️ Breakout ➡️ Fly ➡️ Resistance ➡️ Re-Accumulation ➡️ Pump Hard.
This exciting scenario could unfold soon, so buckle up!
At the moment, EDU is trading at a major resistance level of $0.80.
If this resistance is broken, we can expect a massive upward rally.
However, if it retests from here, the price could enter a Re-Accumulation Range, presenting a fantastic entry point for those looking to hop on the EDU train.
In the near future, we're anticipating a $1.40 target, and we're bullish on EDU in the long term.
With the potential to soar above $5

Bitcoin Ready for Correction Before Bull Run?Bitcoin HTF Chart:-
Breakout -> Expansion -> Corrections -> Bull Run
