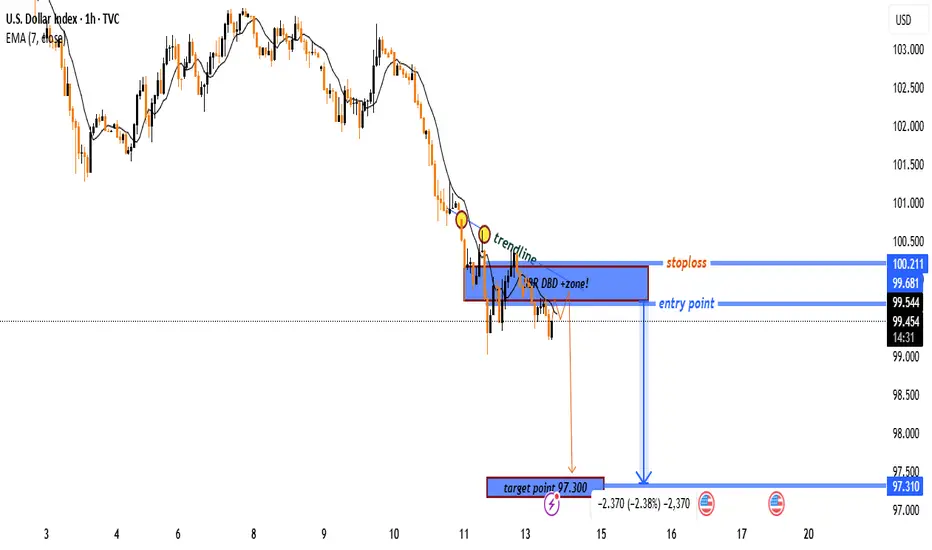
"USD Index Short Setup – Bearish Rejection from Supply Zone (DBD📉 Downtrend confirmed
➖ Lower highs and lower lows
➖ EMA (7) is sloping downward and acting as resistance
➖ Bearish momentum continues
Key Zones & Levels
🔵 Supply Zone (DBD)
🔹 Zone: 99.540 – 99.681
🔹 Label: “Drop-Base-Drop”
🔹 This is where sellers stepped in before – price is retesting it
🔹 Expecting a rejection from this area.
Trade Setup
📍 Entry Point:
🔹 Enter short around 99.540 – 99.681
❌ Stop Loss:
🔺 Set above the zone at 100.211
🚫 Protects against fakeouts
🎯 Target Point:
🔻 Target at 97.300
💰 Risk-Reward: 1:2.4 (Good!)
Visual Summary
📍 Entry: 99.540
❌ Stop Loss: 100.211
🎯 Target: 97.300
📉 Overall Bias: Bearish
✅ Strong RR setup with trend confirmation
J-DXY
A Long-Term Outlook on Gold and the U.S. DollarTechnical and Fundamental Analysis: A Long-Term Outlook on Gold and the U.S. Dollar
1. Technical Analysis:
Gold (XAU/USD):
Current Price: Gold is currently trading around the 3,219.39 level, marking a significant high compared to recent price levels. This is seen as a major resistance point that could limit the price in the short term.
Key Support and Resistance Levels:
Resistance: 3,164.62, 3,190.48, 3,219.39
Support: 3,118.98, 3,069.60
Moving Averages (MA):
MA 13 (Short-Term) and MA 34 (Medium-Term) both lie below the current price, indicating a bullish trend in the short to medium term.
MA 200 (Long-Term) shows that the long-term trend for gold remains strong and stable, with the price currently trading above all these moving averages.
Current Situation: Gold is on a strong upward trajectory, supported by economic factors such as the Federal Reserve's interest rate policies and overall monetary policies. The current price suggests that gold could continue to rise in the short term, particularly if the U.S. Dollar remains weak.
Long-Term Outlook: If the resistance level of 3,219.39 is breached, gold could potentially move towards the 3,250 level and beyond. However, caution should be exercised as profit-taking may occur towards the end of the week. Avoid FOMO and buying at the peak.
2. Fundamental Analysis:
U.S. Dollar (DXY Index):
The DXY Index is currently in a strong downward trend, trading below 100.554. It may continue to fall towards 99.783 in the upcoming months.
Key Support Levels for USD: 99.783 and 97.500. If the DXY continues to drop and breaks these levels, it would put additional pressure on the USD and be supportive for gold.
Impact of Monetary Policies:
The Federal Reserve has indicated a potential interest rate cut in the future, which would continue to pressure the U.S. Dollar and support gold, especially amid global economic concerns.
Economic Situation in the U.S.: With some economic indicators such as CPI and PPI showing weakness, the U.S. economy is facing challenges. This adds further pressure to the U.S. Dollar and provides an advantage to gold.
3. Long-Term Perspective:
Gold is currently in a strong bullish trend, supported by both technical and fundamental factors. In the short term, gold may continue to rise as long as the U.S. Dollar remains weak. However, caution should be exercised toward the end of the week due to potential profit-taking.
For Gold (XAU/USD): If gold breaks key resistance levels, it could continue to rise in the long term, especially if the U.S. Dollar remains weak. However, caution should be taken at the peaks.
As for the U.S. Dollar: The DXY is expected to continue its decline in the short term, which would further support gold. However, if the DXY starts to recover, gold might face some pressure.
Trading Strategy:
Preferred Buy Zones for gold: 3,118.98 and 3,069.60. But be cautious as profit-taking could occur toward the end of the week.
Avoid selling gold unless the major resistance levels are broken and clear signals emerge from the market.
Conclusion:
With gold continuing its upward trend, supported by favorable monetary policies and economic expectations, gold remains a strong opportunity for both short and long-term investors. However, investors should be cautious about profit-taking towards the weekend. Monitoring future performance of the U.S. Dollar and any changes in Federal Reserve monetary policy will be crucial.

DXY finds the support at $99.DXY will be finding the support at the current levels at around $99.
From here prices can go up till $100-$101
If the price breaks down this support of 99 it will continue the fall till $97.5sh to $97zone.

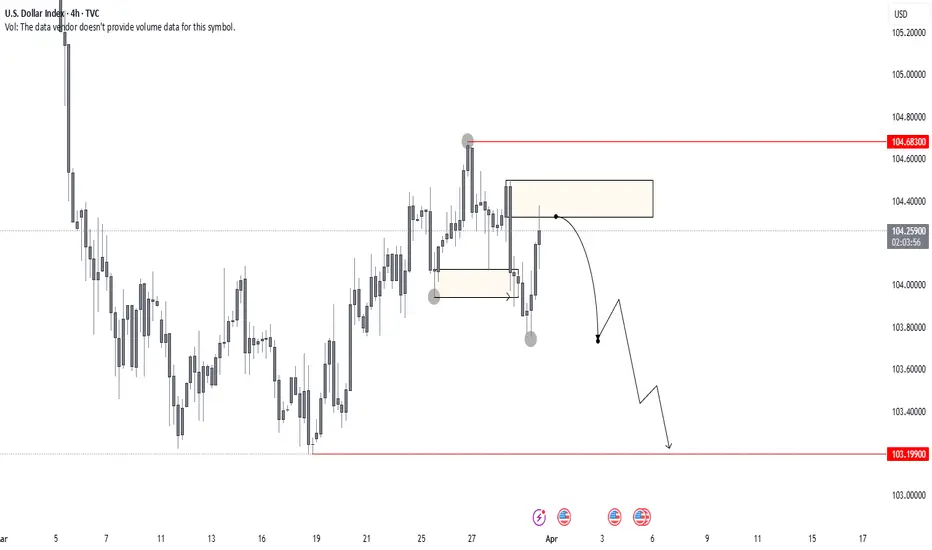
US DOLLARTo confirm my EU view, here is DXY.
The buy zone didn’t hold—price broke through, sustained below, and established a strong new trading range. It just reacted off the 4H sell zone, confirming weakness. Now, all eyes on DXY for a sell-off.
With that being said, fundamentals are heavy this week, so keeping risk in check is key.
Blessings, T
DXY Building Momentum — "Cash is King" Narrative Returns?📌 DXY is showing clear signs of recovery on the H4 timeframe — and that tells us something deeper: risk sentiment is shifting. Investors are pulling capital from risk-on assets and moving to cash. Yes, "Cash is King" might be making a comeback.
🔍 What’s Driving the Move?
As fear ripples through global markets:
📉 Equities are shaky.
🟡 Gold dropped sharply under profit-taking pressure.
🪙 Crypto lacks new capital.
Now, capital is rotating back into USD — not necessarily because of strong fundamentals, but due to defensive positioning.
🔺 On the geopolitical side, Trump’s aggressive tariff threats are shaking confidence. As import/export tension rises, the global appetite for USD-denominated assets (especially U.S. bonds) is also climbing.
🧭 Key Technical Levels (4H Chart)
Support Zones:
🟦 101.467 – historical structure low
🟦 102.113 – minor intraday demand
🟦 102.660 – neckline & retest zone (key area to hold)
Resistance Zones:
🟧 103.803 – consolidation top
🟥 104.506 – key resistance and EMA crossover zone
🟥 105.632 / 106.157 / 106.622 – higher-timeframe targets if momentum continues
🔮 Outlook by AD | Money Market Flow
The market is on the edge right now.
If U.S. equities fail to bounce and global risk sentiment continues to deteriorate, we could see: ✅ A strong USD breakout ✅ DXY bottoming and reclaiming the 104–106 zone ✅ Major asset correction across risk-on markets (Gold, Stocks, Crypto)
“When markets panic, smart money rotates to USD. It’s not bullishness — it’s protection.”
— AD | Money Market Flow
🔁 What to Watch:
Fed’s next steps (Will they ignore Trump’s tariffs and focus on growth?)
Global equity market reactions
Bond yields (demand for U.S. debt could rise again)
📌 Stay sharp and follow the money. DXY is giving early signals — don’t ignore the shift.
🧠 Manage risk. Protect capital. Let the market come to you.

U.S. Dollar Index (DXY) –Key Resistance& Bearish Target Analysis📊 Key Observations:
🔵 Resistance Zone (📍~103.5 Level)
A strong resistance area (🔵 blue box) is marked, indicating potential selling pressure if the price reaches this level.
The price is moving upwards (📈) towards this resistance, so watch for rejection or breakout.
🔵 Support/Target Zone (📍~101.5 Level)
A lower support zone (🔵 blue box) is marked as the bearish target 🎯.
If the price fails at resistance, it may head downwards (📉) to this level.
📉 Recent Price Action:
🚀 Sharp drop followed by a rebound (📈).
The price is currently moving back up (🔼), possibly forming a lower high before another drop.
📌 Exponential Moving Average (DEMA 9 - 102.488)
The price is hovering above the 9-period DEMA (📏), showing short-term bullish momentum.
If the price rejects resistance and falls below the DEMA, a bearish continuation (📉) is likely.
🚀 Potential Scenarios:
✅ Bullish Breakout: If price breaks above 🔵 resistance, it may continue rising (📈) to higher levels.
❌ Bearish Rejection: If price fails at resistance, expect a drop (📉) towards 101.5 🎯.

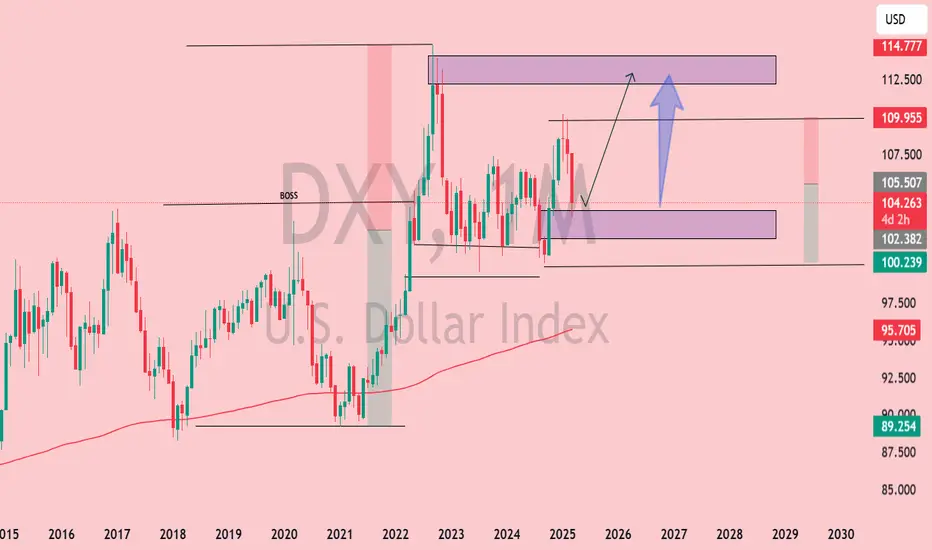
DXY Monthly Analysis: Key Support Holding, Bullish Move Ahead?📊 DXY Monthly Chart Analysis (March 27, 2025)
Key Observations:
Current Price Action:
The U.S. Dollar Index (DXY) is trading near 104.267, with notable resistance ahead.
Price is consolidating within a key demand zone (~102.5–104) after rejecting higher levels.
Technical Levels:
Support Zone: 100.2–104 (Highlighted in purple)
Resistance Zone: 112.5–114.7 (Highlighted in purple)
Major Resistance: 114.77 (Previous high, acting as a supply zone)
200-MA Support: Located below current price, offering a long-term bullish confluence.
Market Structure:
Price remains in a higher time-frame bullish trend but is experiencing a correction.
The "BOSS" level (Break of Structure) suggests a prior bullish breakout.
If the demand zone holds, a bullish continuation towards 112.5–114.7 is possible.
Projected Move:
A bounce from 102–104 could trigger a rally toward the upper resistance zone (~112.5).
A break below 100.2 could indicate a shift in trend and further downside.
Conclusion:
DXY is at a critical decision point. Holding the current support zone (~102–104) could fuel a bullish continuation toward 112–114, while a breakdown below 100.2 would weaken bullish momentum.
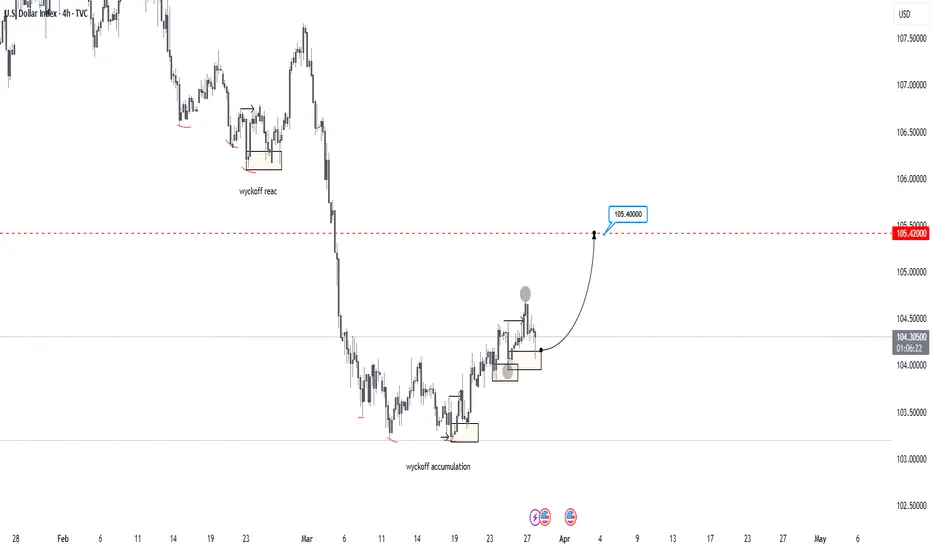
BULLISH ON US DOLLAR!As you can see on the chart, I am bullish on DXY. If you look at it from a technical perspective, you can see that after the accumulation schematic was complete, the dollar started gaining value. Price now needs to enter the markup phase. Looking at the current structure, price has formed a new trading range while breaking the high/structure to the left. A sharp reaction from that zone is a good sign. If the 4H candle closes bullish like this, it could be a strong indicator of bullish momentum building. Let's see. Overall, a pretty straightforward read.
Blessings, T
US Dollar Index (DXY) – Pre-FOMC Update💥 US Dollar Index (DXY) – Pre-FOMC Update: Expert Analysis and Trading Strategies 💥
In just a few hours, the Federal Reserve (Fed) will announce its interest rate decision and update its economic projections in the Summary of Economic Projections (SEP). This is a highly anticipated event that will shape trading decisions in the coming weeks. The US Dollar Index (DXY) is currently fluctuating within the 103.00 - 104.00 range, reflecting investor caution ahead of the critical updates.
1. Interest Rate Decision and Its Impact on DXY
The policy rate is expected to remain unchanged at 4.25% - 4.50%. However, the market is more focused on signals about future rate cuts, particularly in 2025.
Chair Jerome Powell's post-meeting speech will be the key driver. The market will closely watch for hints on monetary policy, inflation, and the US economic outlook.
If the Fed adopts a hawkish tone (indicating sustained high rates or even further hikes), the DXY could rally strongly. Conversely, a dovish signal could weaken the USD.
2. Technical Analysis of DXY
🔴 Key Support: 103.18
The DXY is currently under pressure at the 103.18 support level. A break below this level could push the index further down to 103.00 or even 102.50.
This is a crucial zone, as failure to hold here would signal continued USD weakness in the short term.
🟢 Major Resistance: 105.00 and 105.57
If the DXY rebounds from current support levels, the next challenges will be the resistance zones at 105.00 and 105.57.
The 50-day and 200-day Moving Averages (MA) on the daily chart are also key indicators to watch. A break above these MAs could reinforce the bullish trend.
📉 Short-Term Trend:
On the 4H chart, the DXY is in a downtrend, with lower highs and lower lows. However, upcoming macroeconomic factors (the rate decision and Powell’s speech) could trigger a reversal or increased volatility.
Technical indicators like the RSI and MACD are in neutral territory, suggesting the market is awaiting clearer signals.
3. Trading Strategy Before and After the FOMC Decision
🔍 Before the Fed Announcement:
Caution is key. The market may experience mild fluctuations during the wait. Traders should avoid large positions and wait for clearer signals.
Closely monitor key support and resistance levels: 103.18 (support) and 105.00 (resistance).
🔥 After the Fed Announcement:
Scenario 1: Fed Holds Rates and Signals Hawkish Tone
The DXY could rally strongly, targeting resistance levels at 105.00 and 105.57.
Strategy: Look for buy opportunities when the DXY bounces off support or breaks above resistance.
Scenario 2: Fed Signals a Dovish Tone
The DXY could drop sharply, breaking below 103.18 and heading toward 102.50.
Strategy: Look for sell opportunities when the DXY breaks support or fails to surpass resistance.
Scenario 3: Fed Holds Rates Without Clear Signals
The DXY may continue to fluctuate within the 103.00 - 104.00 range.
Strategy: Trade within the range, using identified support and resistance levels.
4. Advice for Investors and Traders
📊 Risk management: Always set appropriate stop-loss and take-profit levels to protect your capital. Post-FOMC volatility can be intense, so prepare mentally and have a solid trading plan.
📰 Stay updated: Keep a close eye on Fed updates and market reactions. Jerome Powell’s speech could create significant trading opportunities.
🛠️ Use technical tools: Combine indicators like RSI, MACD, and Fibonacci to identify precise entry points.
5. Conclusion
Tonight’s FOMC meeting will be a decisive factor for the DXY’s short-term direction. With clear support and resistance levels identified, traders should prepare their strategies to capitalize on market movements.
🚨 Stay tuned for the latest updates on TradingView to ensure you don’t miss any trading opportunities!
Wishing you successful trades and profitable outcomes! 💪💰

U.S. Dollar Index (DXY) – Key Technical Levels & Market OutlookU.S. Dollar Index (DXY) Monthly Chart Analysis 📊💵
The U.S. Dollar Index (DXY) is currently navigating a critical price structure, with key supply and demand zones influencing market direction. Here’s a professional breakdown of the chart’s technical outlook:
📍 Key Technical Insights
✅ Supply & Demand Zones
Supply Zone (Resistance): 109 - 114 📈 – A key area where selling pressure has historically emerged. A decisive breakout above this level could signal further upside potential.
Demand Zone (Support): 100 - 103 📉 – A strong accumulation zone where buyers have stepped in previously. A breakdown below could indicate a shift in market sentiment.
✅ Market Structure & Momentum
A Break of Structure (BOSS) has been identified, signaling a shift in trend dynamics.
The market is currently ranging between major resistance (~109) and support (~100).
✅ 200-Month Moving Average 📊
The long-term moving average (red line) is acting as dynamic support, reinforcing the bullish bias unless decisively breached.
📊 Potential Scenarios
🔹 Bullish Outlook: If DXY maintains support above 100-103 and breaks past 109, the index could aim for 114+ in the coming months. 🚀
🔹 Bearish Risk: A sustained drop below 100 may open the door for further downside towards 95-89, signaling a broader correction. ⚠️
📌 Conclusion
The DXY remains in a consolidation phase, with key inflection points around 103 (support) and 109 (resistance). A breakout or breakdown from this range will determine the next major trend. Traders should monitor these levels closely for potential trading opportunities.

DOLLAR INDEX - WILL IT BREAK DOWN OR CLIMB HIGHER?Symbol - DXY
The U.S. Dollar Index (DXY) is currently trading within a key support zone, which has historically acted as a pivotal level for price action. A clear double top pattern has emerged on the larger time frame, signaling a potential bearish reversal. A breakdown below this support area would likely signify a shift in the short-term trend of the U.S. Dollar, with the potential for a move lower.
Despite this, there remains an underlying expectation in the global markets that the U.S. Dollar will stay elevated in the medium term due to factors such as President Trump’s policies, tariffs, and rising geopolitical fragmentation. However, much of this has already been priced into the currency, and the current price action is showing signs of weakness, suggesting that the Dollar may be poised for a pullback.
From a technical perspective, a decisive breakdown below the support zone would imply a trend change, with further downside potential. Traders and investors may need to reassess their outlook for the U.S. Dollar if this level is breached.
Key support levels: 107.60, 107.40
Key resistance levels: 108.35, 108.50
On the other hand, if the price holds above the support area and key upcoming data, such as the Non-Farm Payrolls (NFP) and Consumer Price Index (CPI), continue to support the Dollar’s strength, there is potential for the index to continue its upward trajectory. In this alternate scenario, the previous bullish trend for the U.S. Dollar could resume, especially if these data points align with expectations and signal ongoing economic strength. Therefore, the outlook for the U.S. Dollar remains contingent on the price action at the current support level and upcoming economic data releases.

DXY Bullish Breakout – USD Strengthening Towards 120+?📊 DXY (U.S. Dollar Index) Monthly Chart Analysis 🚀
📈 Breakout in Progress:
The chart shows a breakout from a horizontal resistance zone (previous highs). This signals bullish momentum.
📊 Trend & Structure:
Higher Lows & Higher Highs indicate an uptrend.
Price has been moving within an ascending channel for years.
📉 EMA 200 Support:
The 200-month EMA (95.63) is well below the current price, acting as a strong long-term support level.
🔮 Future Projection:
A potential pullback to confirm support, followed by a strong bullish move toward 120-125 levels.
Chart Projection Suggests: 🚀 Upside continuation if support holds.
🔥 Key Levels to Watch:
✅ Support: 104-108 (Breakout retest zone)
🎯 Target: 116-124 (Upper trendline)
💡 Conclusion: Bullish bias remains strong. If DXY holds above 108, the dollar could gain more strength in 2025. 🚀📊

USDCHF - CONTINUATION OF BULLISH TREND?Symbol - USDCHF
The USDCHF pair is currently entering the realization phase following an extended period of correction. A favorable environment has been established by the ongoing uptrend and the strengthening of the dollar. The technical outlook on the daily timeframe is positive. After breaking through trend resistance, the price retested the previously breached level. Following a false breakout, the pair successfully consolidated above this key point, establishing an interim low and signaling potential for further gains.
From a technical perspective, attention is now focused on the resistance level at 0.9110. Should the bulls manage to surpass this zone and establish a sustained break above it, the pair could potentially rise toward 0.9180–0.9300
Resistance levels: 0.9110
Support levels: 0.9050
Prior to breaking through the resistance, the currency pair may test the support level at 0.9050, driven by liquidity beneath this area. However, a decisive move above 0.9110 could serve as the catalyst for further upward momentum.

Possible Wave Counts on Daily Time Frame Chart of DXYMost investors treat trading as a hobby because they have a full-time job doing something else.
However, If you treat trading like a business, it will pay you like a business.
If you treat like a hobby, hobbies don't pay, they cost you...!
In this study we used Elliott Wave Theory & Structures, here we have plotted possible wave counts on daily time frame chart of DXY Dollar Index, it involves multiple possibilities, and the analysis presented focuses on one potential scenario. The provided information is for educational purposes only, not trading advice. There's a risk of being completely wrong.
I am not Sebi registered analyst.
My studies are for educational purpose only.
Please Consult your financial advisor before trading or investing.
I am not responsible for any kinds of your profits and your losses.
Hope this post is helpful to community
Thanks
RK💕
Disclaimer and Risk Warning.
The analysis and discussion provided on in.tradingview.com/u/RK_Charts/ is intended for educational purposes only and should not be relied upon for trading decisions. RK_Charts is not an investment adviser and the information provided here should not be taken as professional investment advice. Before buying or selling any investments, securities, or precious metals, it is recommended that you conduct your own due diligence. RK_Charts does not share in your profits and will not take responsibility for any losses you may incur. So Please Consult your financial advisor before trading or investing.

TRADE IDEA ON SHORT SIDE - US DOLLAR INDEX (DXY)Symbol - DXY
DXY is currently trading at 109.16
My reversal setup has formed in DXY & I'm seeing a trading opportunity on sell side.
Shorting DXY at CMP 109.16
I will add more position if 109.65 comes & will hold with SL 110.05
Targets I'm expecting are 108.00 - 107.30 & below.
Disclaimer - Do not consider this as a buy/sell recommendation. I'm sharing my analysis & my trading position. You can track it for educational purposes. Thanks!

USDCHF - TRADE ON SHORT SIDESymbol - USDCHF
USDCHF is currently trading at 0.9118
I'm seeing a trading opportunity on sell side.
Shorting USDCHF pair at CMP 0.9118
I will add more quantity at 0.9165, If comes. Holding with SL 0.9210
Targets I'm expecting are 0.9010 - 0.8945 & 0.8880
Disclaimer - Do not consider this as a buy/sell recommendation. I'm sharing my analysis & my trading position. You can track it for educational purposes. Thanks!

GBPUSD LONG - TRADE IDEA FOR HUGE PROFITSymbol - GBPUSD
GBPUSD is currently trading at 1.2310
I'm seeing a trading opportunity on buy side.
Buying GBPUSD pair at CMP 1.2310
I will be adding more if 1.2270 comes & will hold with SL 1.2240
Targets I'm expecting are 1.2430 - 1.270 & above
Disclaimer - Do not consider this as a buy/sell recommendation. I'm sharing my analysis & my trading position. You can track it for educational purposes. Thanks!

Bearish Divergence on DXY , What’s Next?The DXY appears primed for a significant drop. On the daily timeframe, a clear bearish divergence has formed, suggesting potential downside movement. Key support levels should be monitored, particularly in relation to the RSI. If the RSI holds around the 50 level, we could see a potential bounce; however, a continued drop into the oversold zone is also possible. The DXY's movement may also be influenced by the FOMC minutes release on January 9th, adding another layer of significance to these levels.

Bearish Divergence on DXY , What’s Next?The DXY appears primed for a significant drop. On the daily timeframe, a clear bearish divergence has formed, suggesting potential downside movement. Key support levels should be monitored, particularly in relation to the RSI. If the RSI holds around the 50 level, we could see a potential bounce; however, a continued drop into the oversold zone is also possible. The DXY's movement may also be influenced by the FOMC minutes release on January 9th, adding another layer of significance to these levels.

DXY $ since 1972, FED Pivots and What now for ALTS coins ?DXY $ since 1972 and Rate Cuts
When the FED cuts rates, the $ Drops in value most of the time as can be seen here on the chart below
( I have not "Boxed" the current FED Rate cuts to make it easier to see the PA )
This time it has continued to Rise for a number of reasons.
In Fact, ever since that Banking "Accident" in 2008, the DXY has gained in value, on average, but thats another story.
FED has said that Cuts may not occur in 2025. This Could once again make the $ a more attractive buy if other markets are falling. Then the $ could Stop being propped up !
Normally, as $ rises, Crypto struggles - again, we have seen BTC rise at the same time as the $ since July this year.
It is ALTS that have struggled and this may very well continue.
Normally, we wait for BTC/D to drop and then the Money flows into ALTS.. but if the money remains in Bitcoin, the ALT market requires an alternative source of income.
Could we see the DXY $ loose that money ?
But the pause in Rate Cuts may stop that
That War in Finance continues.
TradFi Lost round 1 and now Bitcoin is accepted, used, alllowed and is King. This is why the $ Will remain in Bitcoin, ETF's etc. We may see outflows every now and then but certainly Not the amount that drives the ALT market normally.
Will we even see a bear market again ?
ALTS however, they are the Minions that may yet suffer
The War continues and DeFi, for example, needs to step up and REALLY make it self a Lot more user friendly, attractive and bigger gains in use, stake cases.
2025 is going to be very interesting and Volatile
Don't Get Burnt. Be Cautious, the gains could be huge....as could the losses

USDCAD - SWING TRADE IDEA ON SHORT SIDESymbol - USDCAD
USDCAD is currently trading at 1.4325
I'm seeing a trading opportunity on sell side.
Shorting USDCAD pair at CMP 1.4325
I will add more quantity at 1.4350 & 1.4380, If comes. Holding with SL 1.4420
Targets I'm expecting are 1.4250 - 1.4200 & 1.4155
Disclaimer - Do not consider this as a buy/sell recommendation. I'm sharing my analysis & my trading position. You can track it for educational purposes. Thanks!

EUR-AUD | 4h | Swing Trading hello traders, i have prepared FX:EURAUD analysis for you. i have set my entry level, stop level and target level on the chart. all i ask from you is to support me with your likes. thank you to everyone who likes it.

DXY Bearish Setup Update - DXY is currently trading at 105.7 and it exactly got rejected from my POI
- DXY looks all set to mitigate 103.8, bringing more upside to all pairs denominated by USD, risky assets like Crypto, and Stocks.
- Watch out for 103.8 and 101.9 to expect another leg up from
- We have a market structure shift from 103.3 if we flip below that on a weekly TF, we might soon see DXY turning bearish.
- DXY can soon show impulsive moves on Monday post bullish commentaries
