Don't miss the great buy opportunity in LTCUSDTrading suggestion:
. There is a possibility of temporary retracement to suggested support line (52.70). if so, traders can set orders based on Price Action and expect to reach short-term targets.
Technical analysis:
. Litecoin/US Dollar is in a range bound and the beginning of uptrend is expected.
.The price is above the 21-Day WEMA which acts as a dynamic support.
. The RSI is at 75.
Take Profits:
TP1= @ 64.15
TP2= @ 79.15
TP3= @ 99.30
SL= Break below S2
J-LTC

LTC Update [10-Nov-19]Hi all!!
Good day!
One of the most reliable coin is Litecoin (LTC).
Here is what I see in the chart.
1. Held above 7 (Yellow) and 200 (Red) Weekly MA
2. Weekly Trend Line (Blue) Breakout
Invalidate Condition:
!. Price must not fall below 200 Weekly MA
For more updates, follow me here .
~RPS~

Don't miss the great buy opportunity in LTCUSDTrading suggestion:
. There is a possibility of temporary retracement to suggested support line (59.45). if so, traders can set orders based on Price Action and expect to reach short-term targets.
Technical analysis:
. LTCUSD is in a range bound and the beginning of uptrend is expected.
.The price is above the 21-Day WEMA which acts as a dynamic support.
. The RSI is at 62.
Take Profits:
TP1= @ 80.35
TP2= @ 131.60
TP3= @ 143.75
SL= Break below S2

LTCUSD Long term outlookWe are going down down in an earlier round and sugar we are going down swinging! Eventually I believe LTCUSD will go sub $20 but maybe sometime early 2020 that will happen. Not really going to much into detail just giving a ruff idea as to where i think this asset is heading.
1) The Circle indicates major resistance. We have a trend line that has been violated therefore it now becomes resistance. We also have a 200 ma that has acted as resistance. Even though we crossing above it, that move was very short lived and down down we have gone since that time.
2) The Big Red Line. Basically if we cross below that line, if you want to know what things look like... well... go to the restroom, do a number 2, and then throw it at your fan.
Happy tradings to all :D

Litecoin - the real king. Why?Faster,
Stronger:
- more adopted,
- people hold litecoin much more time then bitcoin,
- lightning adopted much more on litecoin network,
- First coin bought by all newbs is LTC or XMR
- CT soon
- Charlie is really good at knowing serious people in crypto space
TA: Bullish flag on the chart.


LTCUSD Trend before halvingLTCUSD Trend before halving....Want to cross -check later against this trend.

LTCUSD Bullish Trend - Long Term Weekly ChartLTCUSD Bullish Trend - Long Term Weekly Chart... Right time to accumulate now. Come on guys..come on guys....Board the bus now and it will not stop in the middle until destination of 350+ for sure. :)

LTC 20% Easily And Quick Profit Expected LTC Quick Profit Expected <3
Entry After Breakout And Must Wait For 4H Closing

LTC / USD Price Analysis: Leaning On SupportLTC / USD Short-term price analysis
Litecoin retains its bearish short-term trading bias, with the LTC / USD pair still trading below its 200-period moving average on the four-hour time frame.
The four-hour time frame is showing that the LTC / USD pair is correcting back towards trendline resistance after finding strong technical support from the $65.00 level.
Technical indicators on the four-hour time frame are rising alongside the recent recovery in the LTC / USD pair.
Pattern Watch
Traders should note that the bearish breakout from the symmetrical triangle pattern has yet to reach its full downside target.
Relative Strength Index
The Relative Strength Index is bullish on the four-hour time frame, although it is now approaching overbought conditions.
MACD Indicator
The MACD indicator is bullish on the four-hour time frame, with the MACD signal line generating a buy signal.
LTC / USD Medium-term price analysis
Litecoin retains its bullish medium-term trading outlook, with the cryptocurrency still holding price above major technical support on the daily time frame.
The daily time frame is also showing that multiple bullish patterns have emerged, with an inverted head and shoulders pattern and a falling wedge pattern now present.
Technical indicators are attempting to correct higher on the daily time frame, following the recent sharp drop from just below the $100.00 level.
LTC / USD Daily Chart by TradingView
Pattern Watch
Traders should note that both bullish patterns highlight the $120.00 level as a potential upside target.
Relative Strength Index
The Relative Strength indicator is attempting to move higher on the daily time frame, although it has yet to turn bullish.
MACD Indicator
The MACD indicator is also attempting to turn bullish on the daily time frame.
Conclusion
Litecoin is attempting to regain its short-term bullish bias, with the popular cryptocurrency facing a key test of buying demand over the coming trading sessions.
The emergence of multiple bullish patterns on the daily timeframe suggests that the LTC / USD pair could start to trade above the $100.00 level over the medium-term.

A trading opportunity to buy in LTCBTCMidterm forecast:
0.01315 is a major support, while this level is not broken, the Midterm wave will be uptrend.
Technical analysis:
While the RSI uptrend #1 is not broken, bullish wave in price would continue.
A peak is formed in daily chart at 0.01890 on 04/03/2019, so more losses to support(s) 0.01430 and minimum to Major Support (0.01315) is expected.
Price is below WEMA21, if price rises more, this line can act as dynamic resistance against more gains.
Relative strength index (RSI) is 40.
Trading suggestion:
. There is a possibility of temporary retracement to suggested support zone (0.01430 to 0.01315). if so, traders can set orders based on Price Action and expect to reach short-term targets.
Beginning of entry zone (0.01430)
Ending of entry zone (0.01315)
Entry signal:
Signal to enter the market occurs when the price comes to " Buy zone " then forms one of the reversal patterns, whether " Bullish Engulfing ", " Hammer " or " Valley " in other words, NO entry signal when the price comes to the zone BUT after any of reversal patterns is formed in the zone. To learn more about " Entry signal " and the special version of our " Price Action " strategy FOLLOW our lessons :
Take Profits:
TP1= @ 0.01500
TP2= @ 0.01620
TP3= @ 0.01730
TP4= @ 0.01890
TP5= @ 0.02015
TP6= @0.02380
TP7= Free

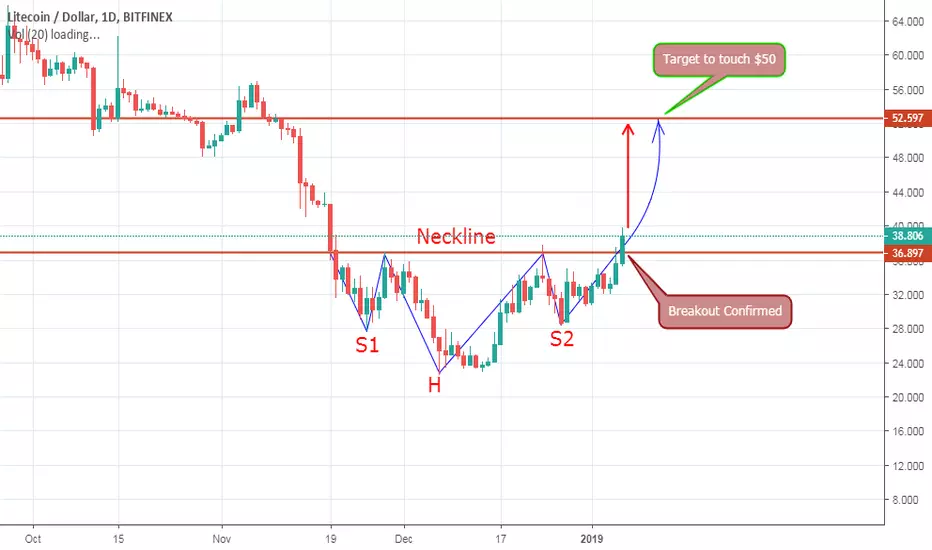
LTC Latest Chart Analysis Hello Everyone Hope you are doing good
In This Chart we can clearly see Breakout of Inverse H&S Pattern which is a Positive sign of Uptrend Current Price of Litecoin is $37.88 and it can move upto $50 as per this Chart Pattern. The area of $27.701–$29.349 is a critical support zone on the downside.
Hope this will help you
Thanks For watching Hit the like button if you like my work.
Litecoin (LTC) ready for the next leg up!LTC started to break out from the descending wedge earlier, however due to BTC movements the party was delayed. I feel LTC is ready to move up from here. Iam not a pro at charting, so this is what I could come up with.

LTCBTC 1 Day Chart Analysis - Mid Term Analysis.You can see that the LTCBTC has broken the falling wedge pattern
and moving in Sideway, there is 7 Resistance Level and 4 support level.
1: Resistance Level 0.00999
2: Resistance Level 0.01161
3: Resistance Level 0.01291
4: Resistance Level 0.01442
5: Resistance Level 0.01566
6: Resistance Level 0.01784
7: Resistance Level 0.0200
Support Level.
1: Support Level 0.007539
2: Weak Support Level 0.006635
3: Last Year Support Level 0.005347
4: Strong Support Level 0.002994
Note: This is only for Educational Purpose this is not an Investment advice.
Please support the setup with your likes, comments and by following on Trading View.
Thanks
Adil Khan

A trading opportunity to buy in LTCBNBTechnical analysis:
. LITECOIN/BINANCECOIN is in a range bound and the beginning of uptrend is expected.
. The price is below the 21-Day WEMA which acts as a dynamic resistance.
. The RSI is at 41.
Trading suggestion:
. There is a possibility of temporary retracement to suggested support zone (5.50 to 4.70). if so, traders can set orders based on Price Action and expect to reach short-term targets.
Beginning of entry zone (5.50)
Ending of entry zone (4.70)
Entry signal:
Signal to enter the market occurs when the price comes to " Buy zone " then forms one of the reversal patterns, whether " Bullish Engulfing ", " Hammer " or " Valley " in other words,
NO entry signal when the price comes to the zone BUT after any of the reversal patterns is formed in the zone.
To learn more about " Entry signal " and the special version of our " Price Action " strategy FOLLOW our lessons:
Take Profits:
TP1= @ 6.50
TP2= @ 7.40
TP3= @ 8.30
TP4= @ 9.15
TP5= @ 10.00
TP6= @ 11.90
TP7= @ 14.15
TP8= @ 16.40
TP9= @ 19.60
TP10= @ 23.65
TP11= Free

There is a possibility for the beginning of an uptrend in LTCBTC Technical analysis:
. Litecoin/Bitcoin is in a range bound and the beginning of uptrend is expected.
. The price is below the 21-Day WEMA which acts as a dynamic resistance.
. The RSI is at 40.
. While the price downtrend in the Daily chart is not broken, bearish wave in price would continue .
Trading suggestion:
. There is a possibility of temporary retracement to suggested support zone (0.00814000 to 0.00736000). if so, traders can set orders based on Price Action and expect to reach short-term targets.
Beginning of entry zone (0.00814000)
Ending of entry zone (0.00736000)
Entry signal:
Signal to enter the market occurs when the price comes to "Buy zone" then forms one of the reversal patterns, whether "Bullish Engulfing" , "Hammer" or "Valley" in other words,
NO entry signal when the price comes to the zone BUT after any of the reversal patterns is formed in the zone.
To learn more about "Entry signal" and the special version of our "Price Action" strategy FOLLOW our lessons:
Take Profits:
TP1= @ 0.00945400
TP2= @ 0.01063810
TP3= @ 0.01141060
TP4= @ 0.01240100
TP5= @ 0.01333480
TP6= @ 0.01571755
TP7= @ 0.01762490
TP8= @ 0.02035380
TP9= @ 0.02381480
TP10= Free


Litecoin Chart Analysis (19th Sep 2018) #Shark #HarmonicsPatternLitecoin Chart Analysis (19th Sep 2018) #Shark #HarmonicsPattern $LTC

There is a possibility for the beginning of an uptrend in LTCUSDTechnical analysis:
. LITECOIN/DOLLAR is in a downtrend and the beginning of uptrend is expected.
. The price is below the 21-Day WEMA which acts as a dynamic resistance.
. The RSI is at 37.
. While the RSI and the price downtrend in the Daily chart are not broken, bearish wave in price would continue .
Trading suggestion:
. There is a possibility of temporary retracement to suggested support zone (57.70 to 49.50). if so, traders can set orders based on Price Action and expect to reach short-term targets.
Beginning of entry zone (57.70)
Ending of entry zone (49.50)
Entry signal:
Signal to enter the market occurs when the price comes to "Buy zone" then forms one of the reversal patterns, whether "Bullish Engulfing" , "Hammer" or "Valley" in other words,
NO entry signal when the price comes to the zone BUT after any of the reversal patterns is formed in the zone.
To learn more about "Entry signal" and the special version of our "Price Action" strategy FOLLOW our lessons:
Take Profits:
TP1= @ 66.00
TP2= @ 73.25
TP3= @ 81.10
TP4= @ 90.25
TP5= @ 111.00
TP6= @ 126.20
TP7= @ 173.75
TP8= @ 212.20
TP9= @ 250.60
TP10= @ 305.30
TP11= @ 375.00
TP12= Free

There is a possibility for the beginning of an uptrend in LTCETHTechnical analysis:
. LITECOIN/ETHEREUM is in a range bound and the beginning of uptrend is expected.
. The price is above the 21-Day WEMA which acts as a dynamic support.
. The RSI is at 59.
Trading suggestion:
. We opened 10 BUY trade(s) @ 0.18172 (day close price) based on a reversal candle ( Valley ) at 08.11.2018
. There is a possibility of temporary retracement to suggested support zone (0.17800 to 0.16600). if so, traders can set orders based on Price Action and expect to reach short-term targets.
Beginning of entry zone (0.17800)
Ending of entry zone (0.16600)
Entry signal:
Signal to enter the market occurs when the price comes to "Buy zone" then forms one of the reversal patterns, whether "Bullish Engulfing" , "Hammer" or "Valley" in other words,
NO entry signal when the price comes to the zone BUT after any of the reversal patterns is formed in the zone.
To learn more about "Entry signal" and the special version of our "Price Action" strategy FOLLOW our lessons:
Take Profits:
TP1= @ 0.2044
TP2= @ 0.2188
TP3= @ 0.2344
TP4= @ 0.2519
TP5= @ 0.2673
TP6= @ 0.2901
TP7= @ 0.3285
TP8= @ 0.3830
TP9= @ 0.4524
TP10= Free

A new trading opportunity to buy in LTCUSDTechnical analysis:
. LITECOIN/DOLLAR is in a range bound and the beginning of uptrend is expected.
. The price is above the 21-Day WEMA which acts as a dynamic support.
. The RSI is at 52.
. The price downtrend in the daily chart is broken, so the probability of the beginning of uptrend is increased.
Trading suggestion:
. If you missed our first HUNT, you have a second chance to buy above the new suggested support zone.
. There is still a possibility of temporary retracement to suggested support zone (75.00 to 66.00). if so, traders can set orders based on Price Action and expect to reach short-term targets.
Beginning of entry zone (75.00)
Ending of entry zone (66.00)
Entry signal:
Signal to enter the market occurs when the price comes to "Buy zone" then forms one of the reversal patterns, whether "Bullish Engulfing" , "Hammer" or "Valley" in other words,
NO entry signal when the price comes to the zone BUT after any of reversal patterns is formed in the zone.
To learn more about "Entry signal" and the special version of our "Price Action" strategy FOLLOW our lessons:
. We have already opened 9 BUY trade(s) @ 79.03 based on 'Two-day reversal candle (2-Day Hammer )' entry method at 2018.06.29 in our suggested support zone (72.50 to 57.50).
Total Profit: 8041
Closed trade(s): 1297 Profit
Open trade(s): 6744 Profit
Closed Profit:
TP1 @ 92.00 touched at 07.18.2018 with 1297 Profit.
Open Profit:
Profit for one trade is 87.46(current price) - 79.03(open price) = 843
8 trade(s) still open, therefore total profit for open trade(s) is 843 x 8 = 6744
All SLs moved to Break-even point.
Take Profits:
TP1= @ 92.00
TP2= @ 102.00
TP3= @ 125.00
TP4= @ 165.00
TP5= @ 183.00
TP6= @ 224.00
TP7= @ 252.00
TP8= @ 375.00
TP9= Free
