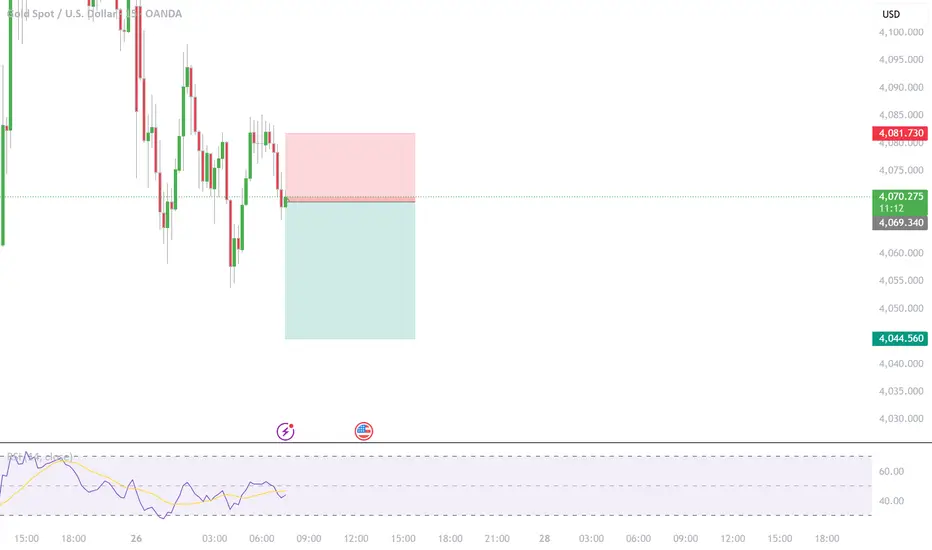
XAU/USD – 15-Minute Timeframe Analysis (Short Bias)Market Overview
Following the latest round of China–U.S. trade negotiations, market sentiment has shifted toward a more risk-on environment, reducing demand for safe-haven assets such as gold. As optimism surrounding the talks strengthens the U.S. dollar, gold prices have continued to decline during the Asian and early European sessions.
Technical Outlook
On the 15-minute timeframe, XAU/USD maintains a clear short-term bearish structure, characterized by consecutive lower highs and lower lows. The pair is currently trading below key moving averages, reinforcing the prevailing downward momentum.
A potential retracement toward intraday resistance could present a favorable opportunity for short positions, provided that bearish price action confirms rejection at that level.
Key Resistance: 2360 – 2365 zone (previous support turned resistance)
Immediate Support: 2348 – 2350 zone
Extended Support Target: 2338 – 2340
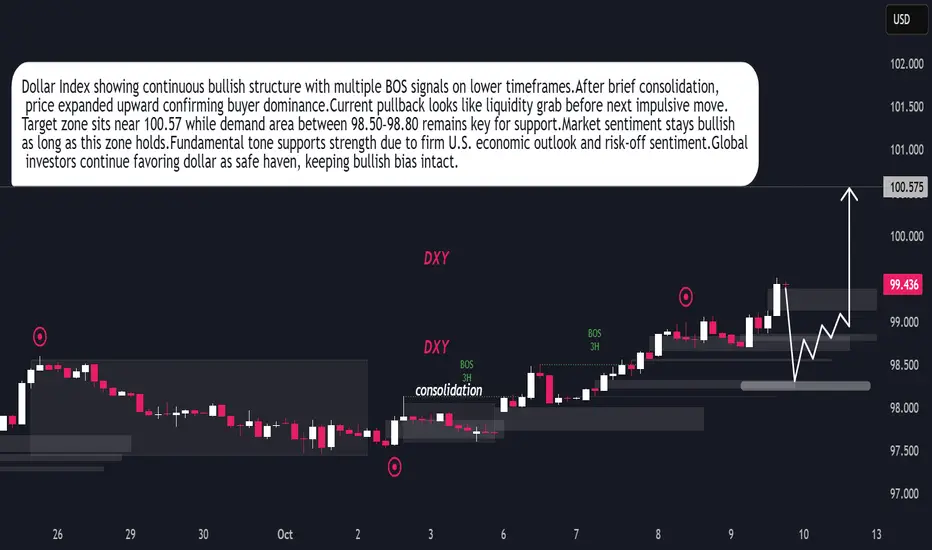
J-USD
DXY Ready for Next Bullish Leg After Liquidity SweepDollar Index maintaining bullish structure after recent BOS on 3H timeframe.Market formed consolidation phase early October before expansion.Buyers showing control pushing price towards 100.57 objective.Current retracement indicates liquidity grab before next bullish impulse.Demand zone 98.50–98.80 remains key area for continuation.Technical sentiment stays positive as long as price holds above 98.50.Fundamentally, dollar supported by strong U.S. data and cautious global tone favoring safe-haven demand.Momentum outlook remains bullish with potential continuation toward 100.50+ zone.
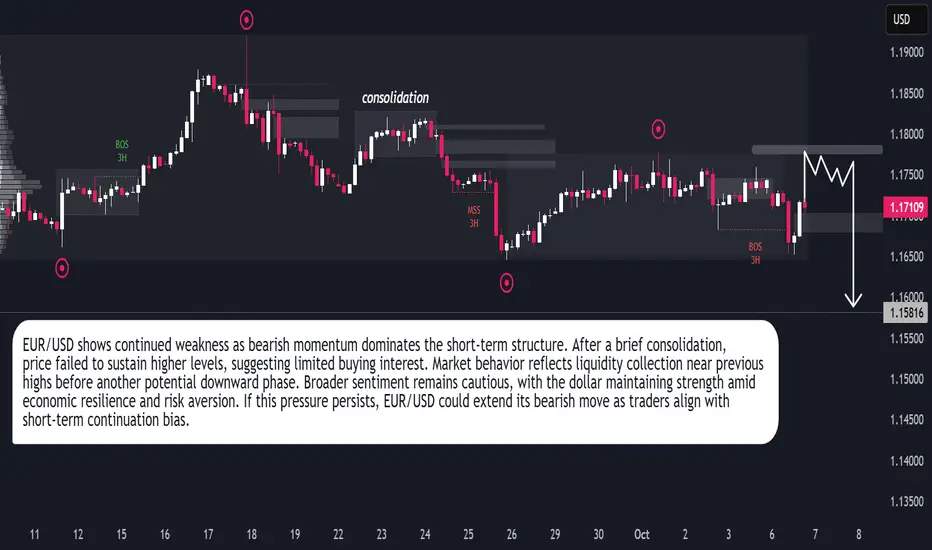
EUR/USD – Bearish Continuation in MotionEUR/USD continues to display a bearish market structure, reflecting persistent downside pressure as the euro struggles to maintain stability against the U.S. dollar. Recent price action shows a period of consolidation followed by a liquidity grab near short-term highs, indicating that buyers are losing strength and the market is positioning for a potential continuation of the decline. The broader market tone suggests that sentiment remains cautious, with traders favoring the dollar due to its resilience amid global uncertainty and steady U.S. economic performance. The pair’s inability to establish higher highs further confirms weakness in bullish momentum. This behavior often signals distribution, where institutional players offload long positions before another leg downward. Short-term movements could still present small corrective bounces as the market seeks liquidity, but overall conditions favor sellers. Unless a strong shift in macro sentiment occurs, EUR/USD is likely to maintain its downward trajectory, targeting lower levels as the bearish momentum unfolds and traders continue aligning with dollar strength.
EUR/USD is entering a decisive SMC zone – Big move loading...📊 EUR/USD H4 – SMC Mapping & Trading Plan
1. Market Structure
Main trend: bearish (after clear CHoCH and BOS).
Price has formed Equal Highs (EQH) → strong liquidity above.
Untested liquidity zone below (OBB) → expectation for price to sweep down.
2. Key Zones
Supply Zone (OBS + FVG):
1.18100 – 1.18200
This supply aligns with the Fair Value Gap.
Expecting price to retest this zone and reject downward.
Demand Zone (OBB):
1.16500 – 1.16650
Strong demand zone combined with liquidity resting below previous lows.
3. Trade Logic (SMC Flow)
Scenario 1 (Short Setup):
If price reaches the OBS + FVG (1.1810 – 1.1820) area,
Expect bearish reaction → Sell setup.
SL: above 1.1830.
TP: demand zone at 1.1650.
Scenario 2 (Long Setup after liquidity sweep):
If price taps into OBB (1.1650 – 1.1665) and holds,
Expect bullish reaction → Buy setup targeting 1.1750 – 1.1780.
SL: below 1.1630.
4. Market Psychology
Buy side: attempting to push higher but likely just a pullback to fill FVG and sweep liquidity above EQH.
Sell side: in control after BOS to the downside, targeting demand below.
Flip Zone: once supply is broken, it may flip into a new reaction zone (support).
✅ Summary Plan
Sell Zone: 1.1810 – 1.1820 → TP 1.1650
Buy Zone: 1.1650 – 1.1665 → TP 1.1750

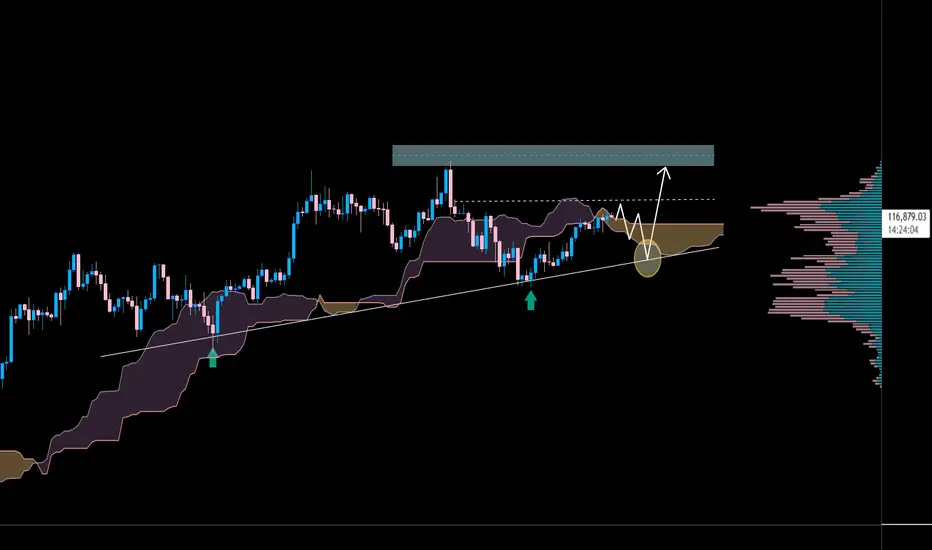
BTC Crashes to 3-Week Low: A True Nerve Test for TradersHello fellow traders, Bitcoin has entered an extremely tense phase!
BTC has slipped below 109,000 USD, marking its lowest point in three weeks. The main pressure comes from the looming expiry of a massive 22-billion-USD options contract at the end of the month, which is driving strong short-term selling.
On the daily chart, prices keep getting rejected at the downtrend line and the Ichimoku cloud, confirming that bears still hold the upper hand.
The current scenario points to further downside, with key support zones at 104,000 USD (TP1) and 98,900 USD (TP2).
These are the critical “do-or-die” levels to watch closely — only if BTC manages to hold above them can we expect a recovery once the options-driven selling pressure eases.
In short: Bitcoin is at a make-or-break moment. Traders, keep your stops tight and stay alert!

BTCUSDT Set to Explode: Strong Uptrend Ahead!Hello everyone, today we’ll analyze an exciting opportunity with BTCUSDT, evaluating its strong uptrend and the potential to reach new highs.
BTCUSDT is trading on a strong upward trendline , with support levels at 110,500 and a high target of 123,700. The chart shows a breakout from an important resistance zone, with the price also positioned above the Ichimoku cloud , reinforcing the bullish trend.
Capital inflows into Bitcoin ETFs and the Fed’s decision to cut interest rates have created a favorable environment for Bitcoin , making the possibility of reaching new highs even stronger.
With favorable technical signals and macroeconomic factors , BTCUSDT is likely to continue its strong upward movement. However, always check support levels to manage risk effectively.
Wishing you successful trading!
NZDJPY SELLSNZDJPY tapped the top of daily supply, aligning with the 88.0 region. While 4H structure is bullish, higher timeframes take priority. Price already flipped 15M structure, giving early bearish confirmation. Short makes sense here with a conservative stop above the daily high. And also if you look at the daily timeframe you can see how bears are in control, 3 times stronger.
Couple of downside targets so let's see.

DOGE LANDS ON WALL STREET | PipGuardDOGE LANDS ON WALL STREET | PipGuard
Hello there, my colleagues, welcome back!
Article published by PipGuard™ on the TradingView® platform – to continue this free publication, LEAVE A BOOST and a COMMENT, hit the notification bell, and never miss ANOTHER ANALYSIS.
ANALYSIS
🔥 DOGE LANDS ON WALL STREET 🔥
Today could mark a historic moment : the REX-Osprey DOGE ETF ($DOJE) is set to debut in the United States under the 1940 Act, barring any last-minute objections from the SEC. This is the first regulated fund in the US linked to Dogecoin , a memecoin born as a joke that has now become an institutional financial product . The fund will not be 100% "spot" , but will use a regulated structure through an offshore subsidiary (Cayman Islands) and derivative instruments to track the price of DOGE. In recent days, large wallets ("whales") have accumulated over 280 million DOGE , and the price has already reacted with a double-digit rally in anticipation of the launch. However, institutional interest does not mean that Dogecoin has suddenly gained practical utility : its strength remains primarily in its narrative and community/meme effect . ETFs can attract flows and speculation, but long-term sustainability will depend on the market and investor perception. In any case, the arrival of DOJE marks the beginning of a new phase: memecoins are entering the arena of regulated products . Volatility? The only certainty.
DOGE/USD
TREND = BULLISH
BULLISH TARGET: FIRST 0.25650, SECOND 0.26000, THIRD 0.28800
BEARISH TARGET: FIRST 0.20500, SECOND 0.14400, THIRD 0.13000
EQUILIBRIUM: 0.30650
RESISTANCE: FAST 0.26007, SLOW 0.35300
SUPPORT: FAST 0.21500
GREETINGS
Remember to leave a GREETING 🚀 or a COMMENT — not because I really need it, but because every boost does more for morale than a double espresso.
Talk to you soon,
PipGuard
Article published by PipGuard™ on the TradingView® platform

USD/JPY(20250910)Today's AnalysisMarket News:
U.S. employment data was significantly revised downward, with the number of jobs for the 12 months ending in March revised down by 911,000.
Technical Analysis:
Today's Buy/Sell Levels:
147.08
Support and Resistance Levels:
148.32
147.85
147.55
146.60
146.30
145.84
Trading Strategy:
On a breakout above 147.55, consider a buy entry, with the first target at 147.85.
On a breakout below 147.08, consider a sell entry, with the first target at 146.60

GBP/USD WHO'S IN CHARGE? | PipGuardGBP/USD WHO'S IN CHARGE? | PipGuard
Hello there, my colleagues, welcome back!
Article published by PipGuard™ on the TradingView® platform – to continue this free publication, LEAVE A BOOST and a COMMENT, hit the notification bell, and never miss ANOTHER ANALYSIS.
ANALYSIS
As you've seen, by popular demand, I'm trying to keep up with publications as well. In any case, I try to please everyone by covering and analyzing the pairs you request and need the most. It's a pleasure for me and a good reason to stay in touch. IF YOU WANT ANALYSIS ON SPECIFIC PAIRS, ESPECIALLY FOR THE MEDIUM-LONG TERM, WRITE IT IN THE COMMENTS.
It's interesting to think of two such important peoples, separated by an ocean but united by the same language. You might call them brothers, but in every family, there's always a power dynamic. The real question is: who the fuck is running the show now? This isn't just a financial battle; it's the echo of a historical rivalry. After the Americans gained their independence, the challenge with the British Empire never ended; it just moved to the markets.
Coming back to us, the technical situation is clear: the underlying trend is bullish . The Pound has pushed, with dignity, but now the market seems to need to catch its breath, to "release" some pressure. Let's not get screwed by the enthusiasm.
Here are the key levels to watch, no mincing words.
• Bullish targets: $1.3596 and $1.3590.
• Bearish targets (in case of a retracement or potential reversal): $1.34830 and, further down, $1.33330.
For short-term operations, the quick reference points are the resistance at $1.35530 and the support at $1.35060 .
The strategy is simple: wait. Wait for a confirmed break with a candle body closing above or below the levels I've indicated. That will be your signal.
At the time of publication, the gut feeling is BEARISH for the short term, but always remember that the overall context remains BULLISH . So, don't do stupid shit.
NEWS
✅ Bailey calls for calm : the BoE governor plays down the record rise in UK yields, pouring some cold water on imminent rate cuts.
✅ UK services inflation jumps 1.5x : the CPI accelerates to 3.8%, giving the Pound a slight boost.
GREETINGS
Remember to leave a GREETING 🚀 or a COMMENT — not because I need likes, but because every boost does more for morale than a pint at the pub.
Talk to you soon,
PipGuard

ETHEREUM | VISUAL ART with PipGuardETHEREUM | VISUAL ART with PipGuard
Article published by PipGuard™ on the TradingView® platform – to continue this free publication, LEAVE A BOOST and a COMMENT, hit the notification bell, and never miss ANOTHER ANALYSIS.
ANALYSIS
Hello colleague, how are you?
Today I bring you a different kind of analysis, designed to be understood on a purely visual level. Because when we're in front of the chart, in the arena, in the cage... there's no room for bullshit or distractions. Here, we fight, and whoever comes in with a confused mind always ends up crushed.
Trading is a ruthless game, like a game of chess. And the winner isn't the one who knows a thousand abstract theories, but the one who has clear ideas, simple concepts, and concrete results.
Think about it: there are few pieces on the chessboard, but the possible moves reach 10^120. That means there are more combinations in a game of chess than stars in our galaxy. An insane number. Yet, the winner isn't the one who gets lost in complexities, but the one who knows how to move those few pieces well with cunning, craftiness, and awareness.
Trading is nothing but this: a continuous battle between you and the market. It moves its pawns, it provokes you, it deceives you, it tries to screw you over. And you? You must observe, wait for its move, analyze it, imagine its counter-move, and only then react.
The tools are few and clear: liquidity, support, resistance, trend.
You don't need an infinite arsenal: you need the basics, the ability to interpret, and the coolness to respond.
I dedicate most of my time to the charts, studying the market, building indicators that actually work instead of complicating life. Over the years, I've understood that behind every strategy, every concept, every approach, there's always a common denominator: simplicity .
So remember this well, colleague: you hold the power in your hands, the power to decide. The market has made its move... what about you? How will you respond?
NEWS
✅ Ethereum is shining again as “digital oil” with a +200% rise in five months, driven by massive institutional investments via ETFs, making Bitcoin pale in comparison!
✅ ETFs and whales are pumping Ethereum: bullish flows and strategic accumulations are putting directional pressure on the price; it looks like it's set for the next push.
SECRETS
🔓 Ethereum is transforming into ultra-sound money: thanks to EIP-1559 and the Merge, it now burns more ETH than it issues daily, with emissions crushed to 1,600 ETH/day, compared to the 13,000 under PoW.
🔓 A core dev's wallet was cleaned out by a malicious AI extension: a sophisticated attack that rips ETH directly from the platform's tech heart.
GREETINGS
Remember to leave a GREETING 🚀 or a COMMENT not because I need the likes, but because every boost does more for morale than a double espresso with cream.
Talk to you soon,
PipGuard
Article published by PipGuard™ on the TradingView® platform

USD/JPY(202509008Today's AnalysisMarket News:
Non-farm payroll growth fell significantly short of expectations, with June's data revised downward to negative territory, marking the first contraction since 2020. The unemployment rate hit a nearly four-year high.
Technical Analysis:
Today's buy/sell levels:
147.57
Support and resistance levels:
149.28
148.64
148.23
146.92
146.51
145.87
Trading Strategy:
On a breakout above 148.23, consider a buy entry, with the first target price being 148.64.
On a breakout below 147.57, consider a sell entry, with the first target price being 146.92

Solana: The Scam or the Breakthrough? | PipGuardSolana: The Scam or the Breakthrough?
Hello there, my colleagues, welcome back!
Article published by PipGuard™ on the TradingView® platform – to continue this free publication, LEAVE A BOOST and a COMMENT, hit the notification bell, and never miss ANOTHER ANALYSIS.
ANALYSIS
Hello everyone,
I know many of you appreciate my analyses, and I thank you for the support. As you know, I spend most of my time on the charts, looking for the best trading opportunities. To avoid missing updates, I recommend you turn on notifications!
Solana, with its ambiguous name, raises a question. Is it the “scam” that will ruin you or the “breakthrough” that will make you take the great leap? Regardless of preferences, what matters is the profit potential.
The Trend to Watch
Solana's dominant trend is clearly bullish. Our focus must remain on growth, but without underestimating possible downside scenarios.
Currently, the price is going through a bullish accumulation phase. There's liquidity to be filled, and we need to keep an eye on two critical levels very close to $210 . This is our support and resistance zone.
Below $210, the risk of a downward correction increases.
Above $210, the bullish trend strengthens.
A possible retracement could push the price into the $175-$160 zone. Here, the market will decide whether to continue falling or resume its upward run.
If Solana breaks above $210 without a retracement, the bullish target remains the $260 zone.
In short, the key levels:
Bullish target: $260
Bearish target: $175-$160
Support/Resistance zone: $210
NEWS
✅ Galaxy Digital, Multicoin, and Jump Crypto are aiming for a $1 billion treasury in Solana, the largest ever seen in the sector.
✅ Sharps Technology soars 70% after raising $400 million for a treasury entirely in Solana, featuring giants like Pantera and ParaFi.
SECRETS
🔓 The return of the Coinbase hacker: a wallet linked to the $300M mega-heist on Coinbase is back in action, buying 38,126 SOL ($8M) around $209.
🔓 The dark side of meme-tokens: on the Solana network, the Kanye West token burned $75M in a week, crashing by 80%. Those who believed in it are now left with worthless paper.
GREETINGS
Remember to leave a GREETING 🚀 or a COMMENT — not because I really need it, but because it's cool to support the one who brings you these bombshells while you're having your coffee.
Talk to you soon,
PipGuard
Article published by PipGuard™ on the TradingView® platform

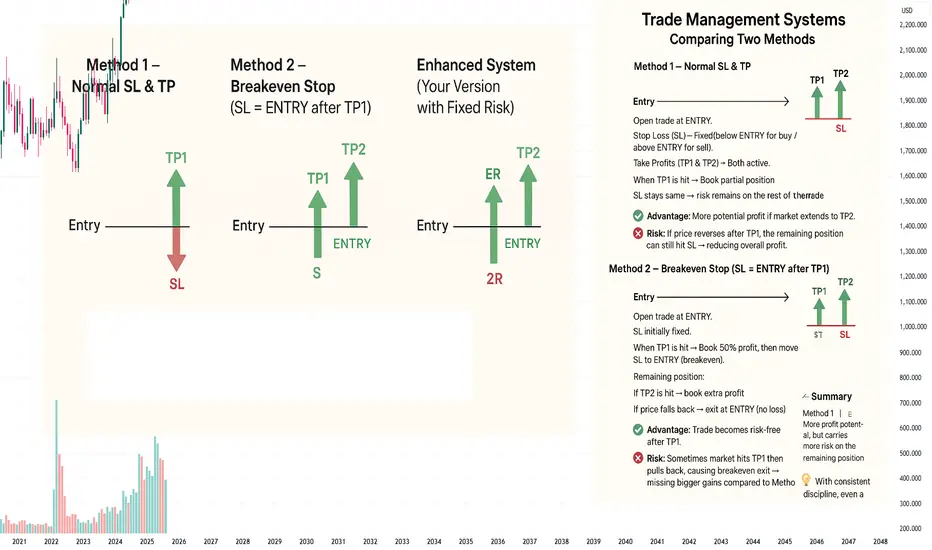
Trade Management Systems: Comparing Two Methods
📌 Method 1 – Normal SL & TP
Entry → Open trade at ENTRY.
Stop Loss (SL) → Fixed (below ENTRY for buy / above ENTRY for sell).
Take Profits (TP1 & TP2) → Both active.
When TP1 is hit → Book partial position.
SL stays the same → risk remains on the rest of the trade.
✅ Advantage:
More potential profit if market extends to TP2.
❌ Risk:
If price reverses after TP1, the remaining position can still hit SL → reducing overall profit.
📌 Method 2 – Breakeven Stop (SL = ENTRY after TP1)
Entry → Open trade at ENTRY.
SL initially fixed.
When TP1 is hit → Book 50% profit, then move SL to ENTRY (breakeven).
Remaining position:
If TP2 is hit → book extra profit.
If price falls back → exit at ENTRY (no loss).
✅ Advantage:
Trade becomes risk-free after TP1.
❌ Risk:
Sometimes market hits TP1 then pulls back, causing breakeven exit → missing bigger gains compared to Method 1.
📌 Enhanced System (Your Version with Fixed Risk)
Initial SL → Always set at 2R.
TP1 → When reached, book 50% profit (+1R on half).
Then move SL to ENTRY (breakeven) for the remaining 50%.
📊 Possible Outcomes:
Scenario Result
Price hits SL (before TP1) –2R loss
Price hits TP1, then reverses to ENTRY +0.5R profit
Price hits TP1, then TP2 +2R total profit
⚖️ Summary
Method 1 (Normal SL & TP) → More profit potential, but carries more risk on the remaining position.
Method 2 (SL = ENTRY after TP1) → Safer, risk-free after TP1, but sometimes cuts off bigger gains.
Your Enhanced Version → A defensive system:
Losers are limited (–2R).
Small winners (+0.5R) happen often.
Big winners (+2R) balance out losses.
💡 With consistent discipline, even a 40–45% win rate can make this system profitable.
USDJPYIt looks like price completed its objective just before Friday’s news release, after which USD dropped sharply. From a technical perspective, structure has flipped from bullish to bearish. A clean correction to the upside into the 148.0 supply zone followed by a drop would make perfect sense. I’ll be watching to see if this develops into a swing move.

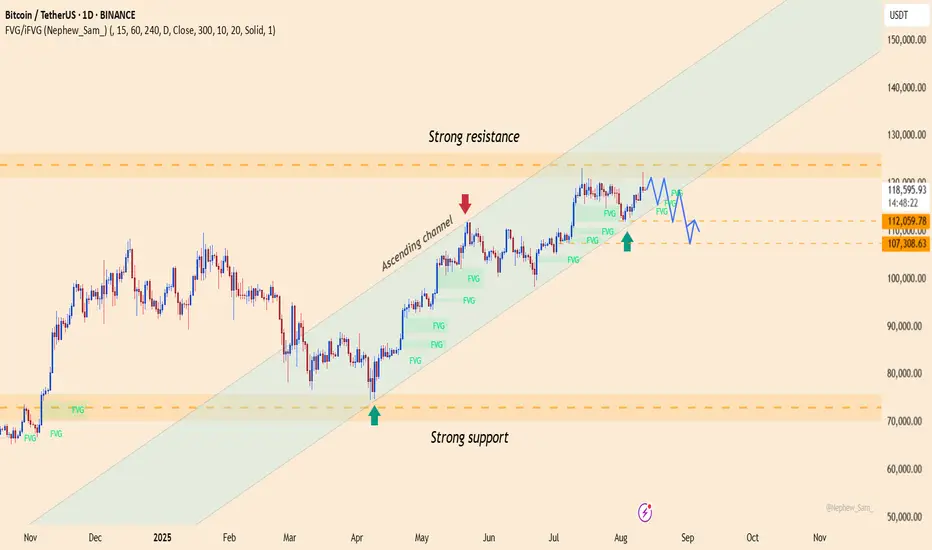
BTC Consolidating, Ready to Blast Towards 130K?BTC/USDT is still holding within its uptrend channel , with strong support around 112.3K and key resistance at 123K–125K. After hitting an all-time high near 124.5K, the price pulled back to 112–115K for consolidation, building a base for the next rally.
On the news side, the market is getting strong support as the US officially allows Bitcoin in 401(k) retirement plans and has set up a Strategic Bitcoin Reserve . At the same time, spot Bitcoin ETFs continue to attract massive inflows, pushing total assets above $150 billion in just 18 months. This shows rising institutional confidence, despite short-term corrections.
The preferred scenario now is to look for buy opportunities around 112–115K , targeting a rebound to 123–125K, and if that breaks, the next destination could be 130–135K.
On the flip side, a defensive strategy should be considered if BTC falls below 110K, as this is a crucial level for maintaining the medium-term uptrend.

BTCUSDT: Holding Support, Waiting for a Breakout to 127,500Bitcoin continues to move within an uptrend structure, with the 112,200 USDT zone acting as a key support, aligning with the ascending trendline. The repeated rebounds from this level indicate that buying pressure remains steady.
On the upside, the 127,500 USDT zone stands as a strong resistance that must be broken to extend the bullish momentum. As the price approaches this area, traders should closely monitor the reaction to determine whether a breakout or a short-term pullback will occur.
Overall, the technical structure still favors the bulls. A sensible strategy is to accumulate during retracements around 112,200 – 114,000, and hold positions for a short-term target at 127,500. If this level is breached, the bullish wave will be further reinforced.

BTCUSDT: Continued Growth in the Short TermBTCUSDT is currently trading within a stable price range, with a clear uptrend channel forming. After bouncing off the strong support at 116,000 USD, BTCUSDT is likely to continue its bullish momentum, with the first target set at 123,000 USD.
The latest news from the cryptocurrency market shows a growing confidence in Bitcoin, driven by positive signals from major financial institutions. Recent price corrections have created good buying opportunities for investors. The global economic situation, particularly the weakening of the USD and increasing institutional adoption of Bitcoin, is driving BTC's value higher.
Trading Strategy:
Buy: Enter a buy position when the price approaches the 116,000 USD support level again or breaks above 117,000 USD.
Stop-loss: Set a stop-loss below the 116,000 USD support level to protect in case of a reversal.
With the current market structure and supportive factors from both news and technical analysis, the bullish trend of BTCUSDT is highly likely to continue in the near term.

BTCUSDT – Continuing the Uptrend, Targeting 124,000 USDBTCUSDT continues its strong uptrend, with price moving within a stable ascending channel. The nearest support is at 116,900 USD, where the price has bounced and maintained its upward momentum. Recent fundamental factors, including rising demand and positive market sentiment towards Bitcoin, are driving this growth. The next target for BTCUSDT is the resistance zone at 124,000 USD. If this level is broken, BTC could move towards 135,000 USD.
Trading Strategy: Buy when the price tests support at 116,900 USD and wait for confirmation of continued upward movement. The target is 124,000 USD, and beyond that, 135,000 USD. Place a stop-loss below 116,000 USD. As long as the price remains above 116,900 USD, the uptrend remains intact.

BTCUSDT – Uptrend ContinuesThe chart shows that Bitcoin (BTC) is moving within a strong ascending channel , with strong support at 117,300 USD. The current pattern indicates that each time the price tests this support level, BTC bounces back strongly, showing that buying pressure is dominant. The price has continuously broken through key resistance levels and is now heading towards 130,000 USD , where it may encounter strong resistance .
Regarding the news, although there are no direct events impacting Bitcoin today, the global cryptocurrency market continues to benefit from the stability of other risk assets and growing interest in assets like Bitcoin. Expectations for cryptocurrency adoption in major countries and the increase in Bitcoin investment funds are also driving the uptrend.
Currently, BTC is facing resistance at 3,407 USD, and if it breaks through successfully, it could continue to rise towards 3,450 USD. However, strong support remains at 3,330 USD, which could lead to a bounce if there is a minor pullback.
Strategy:
Buy around 117,300 USD, with a target of 130,000 USD.
Stop loss below 117,000 USD to protect the position in case the support is broken.

BTCUSDT – Bulls Maintain Control, Upside Scenario IntactOver the past two days , the crypto market has been supported by a series of positive developments: yesterday, U.S. PPI data cooled, easing inflationary pressure and strengthening expectations that the Fed may soon cut interest rates; today, global risk sentiment improved as U.S. and European stock indices rebounded; and most recently, Bitcoin ETF inflows continued to post net gains, signaling that institutional investors remain confident in the bullish trend.
On the daily chart , BTC is still moving within an ascending channel, with a strong resistance zone around 121,000 – 122,000 USDT. Currently, the price is consolidating right near the upper boundary of the channel, showing that buying pressure remains in control. The strong support zone lies between 112,000 – 110,000 USDT, aligning with the channel’s lower boundary.
Preferred strategy: look for buying opportunities if the price pulls back toward 112,000 – 110,000 USDT, targeting a return to 121,000 USDT and potentially new highs. The bullish trend remains intact as long as the price stays within this ascending channel.
GBPJPY GJ is continuing its decline and is approaching a key demand zone around 194.800, which previously initiated bullish order flow.
I’ll definitely be monitoring this area closely for potential buy setups, as I’m anticipating a possible retracement. As always, confirmation will come from observing the 15-minute structure—once that aligns, I’ll adapt accordingly.

BTCUSDT – pressure building before the breakoutMarket context:
US trade policy eases restrictions for certain major tech companies → risk appetite improves.
Expectations of a more dovish Fed → capital flows return to the crypto market.
Sentiment & flows:
Short-term Bitcoin holdings increase by around 20 billion USD → trading activity is heating up, but profit-taking pressure is also building.
Investors are closely watching the 116,000 USDT level before adding aggressive long positions.
8H technicals:
Support: 112,600 USDT – a zone that has repeatedly triggered rebounds, maintaining the bullish structure.
Resistance: 116,000 USDT – the “gate” that could open the way to 123,000 USDT.
Bullish scenario remains favored if price closes above 116,000 USDT with confirming volume.
Key takeaway:
The market feels like it’s “winding the spring” – tight consolidation before a potential breakout.
A break below 112,600 USDT would invalidate the short-term bullish view and increase the risk of a deeper pullback.
