BITCOIN WEEKLY RSI SIGNAL JUST REPEATED – BIG MOVE LOADING? BITCOIN WEEKLY RSI SIGNAL JUST REPEATED – BIG MOVE LOADING?
This chart shows something MAJOR:
Across the last 5 market cycles, Bitcoin only touched this RSI demand zone at the bottom right before massive reversals:
1️⃣ 2015 bottom
2️⃣ 2018 capitulation
3️⃣ 2020 COVID crash
4️⃣ 2022 bear-market low
5️⃣ NOW: 2025 RSI touch again
Each time BTC hit this level → it triggered one of the strongest trend reversals of the cycle.
And now we’ve hit it again while price is consolidating inside the green accumulation zone.
Historically, this has been the highest-probability long-term opportunity zone in every cycle.
If history rhymes, the next big move might be closer than people think.
Stay sharp. NFA.
J-xrp

$BTC STANDING ON ITS LAST SUPPORT: READ THIS BEFORE YOUR TRADEBITCOIN TECH UPDATE — FRESH LEVELS, FRESH PAIN
CRYPTOCAP:BTC just dumped to $80,641, making a new low since 12 April 2025.
That’s almost -30% from my Short + Exit levels.
Those who Rode the Short, Enjoy the profits.
Those who avoided chasing above $120k, capital saved again.
Where We Stand Now
Bitcoin is sitting exactly on the 0.786 Fib ($83,300), the strongest bullish support left on the chart.
This level = Bulls’ last hope.
If daily candle doesn’t close below $83,300, then expect a relief rally into upside inefficiencies:
Upside Targets (If 0.786 Holds)
$88,600 → major unfilled FVG
$93,000 → bearish Order Block (high probability fill)
$98,000 → another upside FVG waiting to be delivered
Watch how price behaves at these levels — next macro move will be decided there.
If 0.786 Fib Breaks…
Be ready.
Next liquidity pools: $73,000 / $66,000
Both zones have massive bullish orderflow waiting.
If 0.786 support holds → BTC still has high probability to push for a new ATH.
Summary:
Trend still bearish, but BTC is now at a critical support.
Hold → relief rallies + possibly new ATH.
Break → $73k–$66k incoming.
Stay sharp. Watch the levels. Trade with intention.
NFA &" DYOR

BITCOIN JUST DID EXACTLY WHAT WE DISCUSSED: CURRENT UPDATEBITCOIN JUST DID EXACTLY WHAT WE DISCUSSED: CURRENT UPDATE
CRYPTOCAP:BTC bounced perfectly from the 0.786 Fib ($83,308), The FINAL bullish support.
Now trading above $86,500, already +5–6% up from the exact level I alerted.
As long as BTC holds $83,308, upside relief rally remains active:
$88,000 (FVG)
$93,000 (Bearish OB)
$98,000 (FVG inefficiency)
But… if BTC loses $83,000, say hello to the $66,000 demand zone, The next real bullish orderflow.
For now: Structure is bullish above 0.786, cautious below it.
(NFA / DYOR)

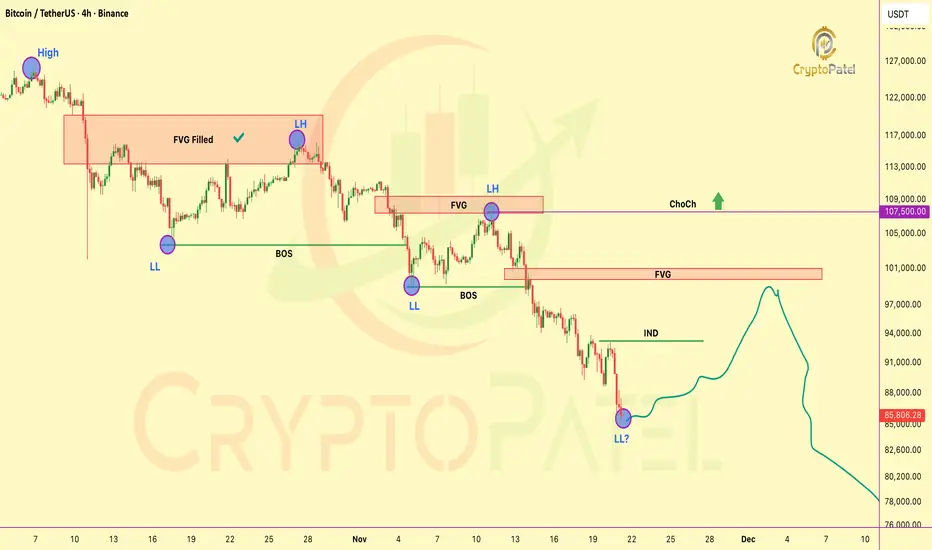
$BTC Just Printed Another LL: Next Draw Is Locked InCRYPTOCAP:BTC Just Printed Another LL: Next Draw Is Locked In
Market is maintaining a clear bearish orderflow with continuous LH → LL sequence.
Structural Notes
🔹 Previous major FVG (distribution zone) has been fully filled and delivered downside.
🔹 Multiple BOS events confirm continuation of the bearish leg.
🔹 Recent sweep followed by another LL shows sellers still in full control.
🔹 INDUCEMNET zone rests around $93160, high-probability inefficiency for short-term retracement.
🔹 Major unmitigated FVG remains at $100800, acting as a premium draw if price seeks liquidity.
Expectations
🔹 Retracement likely into nearby inefficiencies:
🔹 IND @ $93160 → high-probability mitigation
🔹 FVG @ $100800 → medium-probability mitigation (only if deeper pullback unfolds)
🔹 Trend remains bearish until market delivers a ChoCh above $107.5K.
Current Bias: Bearish
Short-Term Draw: IND (mid-range inefficiency)
Mid-Term Draw: Unmitigated FVG (premium zone)
Invalidation: ChoCh above $107.5K
NFA & DYOR
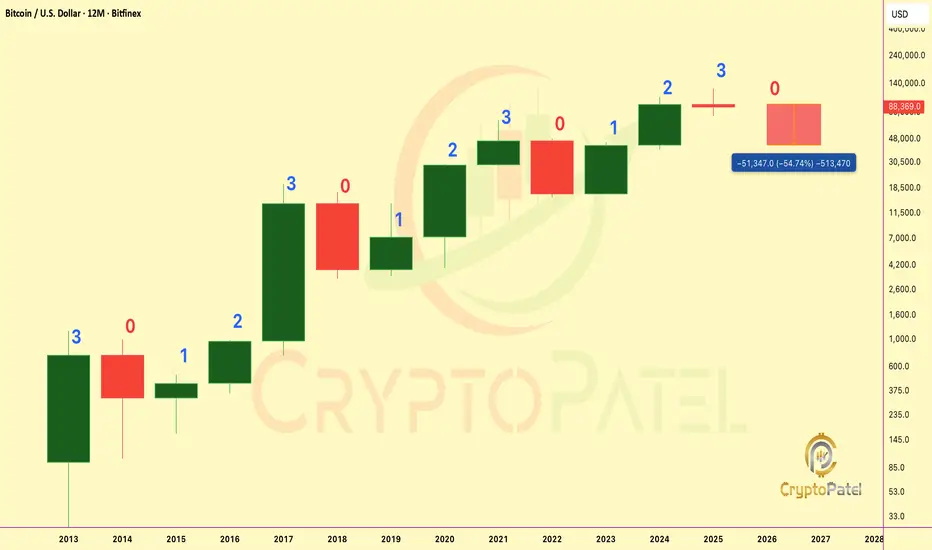
Bitcoin Most Critical 40 Days of the Entire Cycle🚨 Bitcoin Most Critical 40 Days of the Entire Cycle 🚨
CRYPTOCAP:BTC Yearly Fractal is clear: RED → 3 GREEN → BIG RED.
2025 = Candle 3, historically the strongest and always breaks ATH.
Bitcoin can hit a new ATH ONLY this year.
If BTC does not break ATH in the next 40 days, history shows it never breaks the 3rd candle high the following year: Meaning 2025 becomes the cycle top, and 2026 turns into a 50–70% retracement year ($30k–$40k).
✔ Break ATH → $150k–$180k
❌ No ATH → Biggest Correction of the Cycle in 2026
NFA & DYOR
CRYPTO MARKET JUST LOST $1.25 TRILLION🚨 CRYPTO MARKET JUST LOST $1.25 TRILLION: THIS IS NOT NORMAL 🚨
In just 42 days since the Oct 6 top, the market has wiped out a massive -$1.25T, A -28% collapse from the $4.27T peak → $3T zone.
This $3T level is the final line before a full liquidity vacuum.
If it breaks, volatility turns violent. Stay sharp.
NFA & DYOR

#BTC Technical Update: Structure Playing Out With Precision#BTC Technical Update: Structure Playing Out With Precision
CRYPTOCAP:BTC has tapped the $95K zone, completing the corrective leg projected when price was rejecting the $115K–$110K range.
Key downside levels already reached:
➡️ $105K ✔️
➡️ $93K ✔️
As long as price fails to break and close above $107,500, the bearish structure remains intact and the next liquidity target becomes: $73K
A confirmed close above $107.5K invalidates the bearish leg and reopens the path toward a new ATH.
Critical zones to watch:
➡️ 0.5 FIB — structural reaction level
➡️ 0.618 FIB — high-probability reversal pocket
🔻 Bearish below $107.5K
🔺 Bullish above $107.5K
Price is respecting structure with accuracy.
Charts > emotions. Levels > noise.
NFA & DYOR
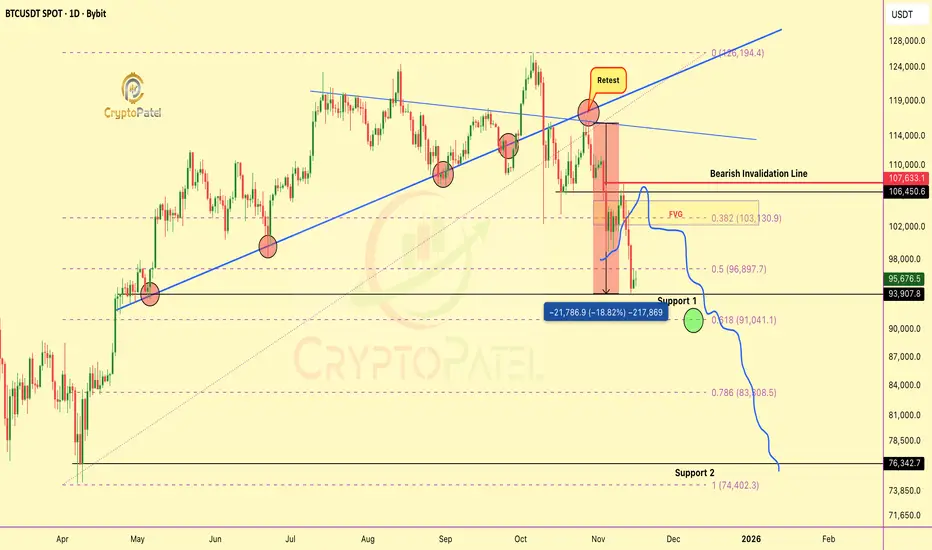
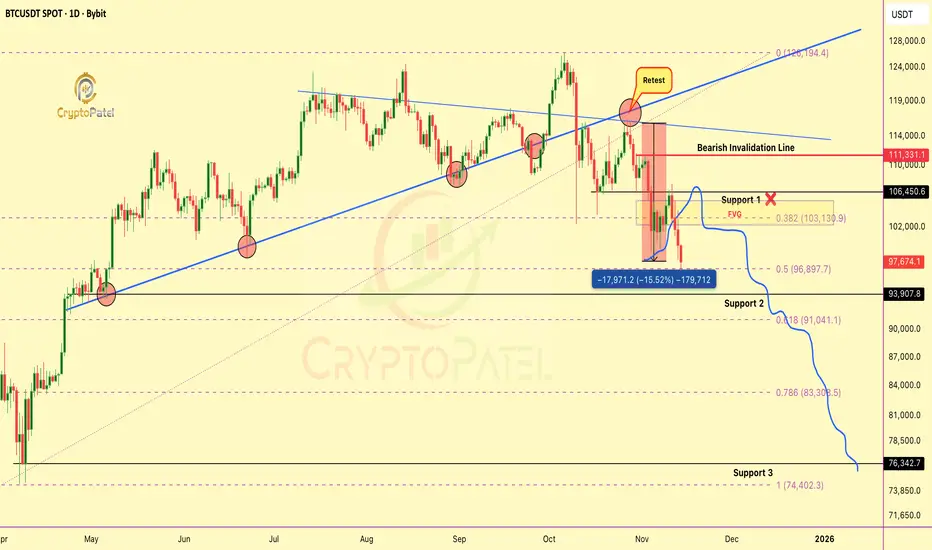
bearish retest I warned on Oct31 played out EXACTLY as projectedThe bearish retest I warned about on Oct 31 played out EXACTLY as projected
I clearly said CRYPTOCAP:BTC would dump again after filling the FVG at $106K–$107K and that’s exactly what happened.
BTC dropped from $107K → $98K (-9%) and from our retest entry, we’re now 15% in profit.
Hope you enjoyed the analysis and booked gains.
Now watch the 0.5–0.618 FIB zone closely.
✔️ If it holds → strong bounce possible
❌ If it fails → BTC could slide below $80K
I’ve been warning about this dump since BTC was above $120K+.
Structure always wins.
NFA & DYOR
XRP down 10% with 48 hoursCRYPTOCAP:XRP is down 10% on the inverse chart right after the first spot XRP ETF went live in the US
This is why I kept Saying Sell the News. Markets move before headlines.
Retail moves after. That gap is where most people lose money.
NFa & DYOR

Breaking: XRP ETF to Launch on Nasdaq TomorrowBreaking: XRP ETF to Launch on Nasdaq Tomorrow
Big news for the CRYPTOCAP:XRP community!
Canary Capital has officially filed to list the first-ever Spot #XRPETF on the Nasdaq, trading under the ticker XRPC. If all goes as expected, trading could begin tomorrow.
This ETF will let U.S. investors get direct exposure to XRP through a regulated investment product, just like Bitcoin and Ethereum ETFs.
Why this matters:
🔹 It opens the doors for institutional investors to enter XRP legally and easily.
🔹 It could bring huge liquidity and more attention to the XRP ecosystem.
🔹 If the launch goes smoothly, it may spark a strong bullish move not only for XRP but also for the broader altcoin market.
Possible outcomes:
🔹 Positive: XRP price pumps as new money flows in.
🔹 Neutral: Market already priced it in.
🔹 Negative: Any delay or SEC hurdle could cause a short-term dip.
Overall, this launch could be a major milestone for XRP and the crypto market beyond BTC and ETH.
Keep your eyes on the charts tomorrow, The market reaction could be big!
NFA & DYOR

#BITCOIN TECH UPDATE: BEARISH IN CONTROL#BITCOIN TECH UPDATE: BEARISH IN CONTROL
CRYPTOCAP:BTC is down 14% from $115K retest, clean rejection.
Trend remains bearish, structure forming lower highs & lower lows.
Key Zones:
Relief zone: $105K–$108K (short setup area).
Major support: $94K → break below = $76K next.
Momentum:
Selling pressure dominates; no bullish divergence yet.
Invalidation:
Only a close above $111.5K flips bias bullish toward $150K. ( Super Bullish Above $116.5K)
Plan:
Sell rallies. Manage risk. Avoid FOMO longs.
NFA & DYOR

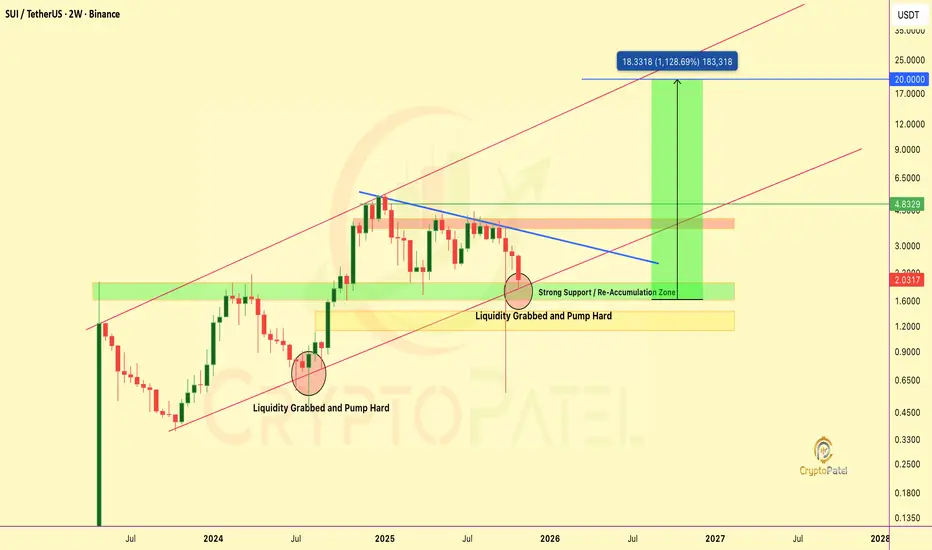
SUI– Breakout Setup Forming, Bulls Eyeing a Move Toward $20SUI/USDT – Breakout Setup Forming, Bulls Eyeing a Move Toward $20
SUI is building a strong re-accumulation base after months of correction. The $1.6–$2 demand zone continues to attract heavy buying interest, the same zone that triggered the last major rally.
Technical Highlights:
✅ Multiple liquidity grabs with strong rebounds
✅ $1.6–$2 zone acting as key accumulation area
✅ Descending trendline compression nearing breakout
✅ Structure remains bullish above $1.6
A confirmed breakout above the descending trendline could launch SUI into a high-momentum phase, targeting higher resistances.
Upside Levels: $4.8 / $10 / $20 – Macro channel target
Accumulation View:
Smart money is active below $2, positioning early before expansion. As long as $1.6 holds, the structure favors a bullish continuation.
High compression. Low noise. When this trendline breaks, volatility will speak loud. NFA & DYOR
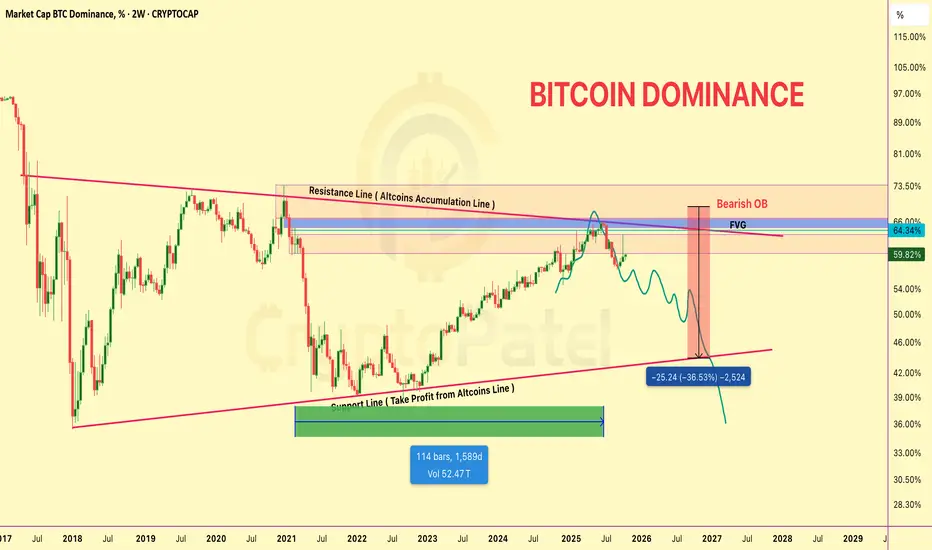
Why Altcoin Holders Need to See This BTC Dominance Chart RIGHT NWhy Altcoin Holders Need to See This BTC Dominance Chart RIGHT NOW
BTC.D still trending UP → targeting 63% before the reversal
Yes, it hurts altcoin bags right now 😤
63% → flip to 40-45% → ALTSEASON 🚀
Let BTC run. Your bags will pump after.
Patience wins.
NFa & DYOR
Bitcoin Is Flashing a Major Warning Signal Right NowBitcoin Is Flashing a Major Warning Signal Right Now ⚠️
KEY LEVELS:
Resistance: $123K (triple top) & $115.9K barrier
Support: $106K - CRITICAL level
BEARISH PATH (if $106K breaks):
→ Target 1: $91K (-18%)
→ Target 2: $79K (-28%)
BULLISH SCENARIO:
Reclaim $115.9K & break $123K to invalidate bearish structure
STRUCTURE ANALYSIS:
▶️ Lower highs forming = Reversal signal
▶️ Weakening momentum post- New ATH
▶️ Distribution pattern visible at resistance
STRATEGY:
✅ SHORT: Below $106K | Targets: $91K-$79K
✅ LONG: Above $115.9K | Stop: $106K
The chart doesn't lie. $106K is the line in the sand.
Risk management > predictions.
Trade smart. Adapt fast. Survive longer.
CRYPTOCAP:BTC #Bitcoin
NFa & DYOR

$XRP ON THE EDGE OF SOMETHING BIGCRYPTOCAP:XRP ON THE EDGE OF SOMETHING BIG
XRP just broke out of a multi-year downtrend and is retesting major support at $2–$1.70.
Holding this zone keeps the bullish structure intact, a break above $3.30 could ignite a run toward $5 and even $10.
NFA & DYOR

Will $SEI hit $2 in current bull market?NYSE:SEI up 140% from my initial entry, but I'm targeting an 800% gain from current levels 🚀
Looking at $2 as a key target in this bull run — strong support, bullish structure, and key levels lined up.
Let’s see if NYSE:SEI can make this move 💎
NFa & DYOR

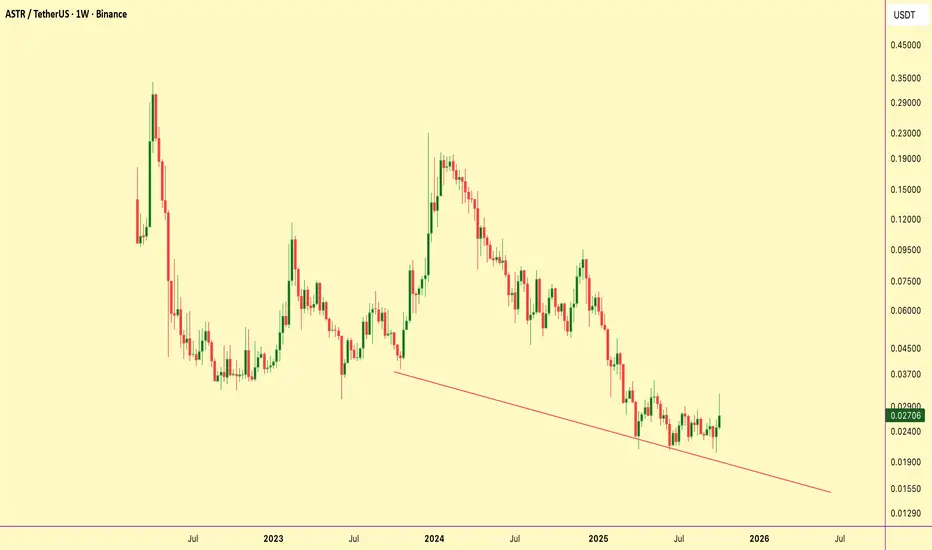
$ASTR gearing up for a breakout from key Order Block!RUS:ASTR showing strong bullish continuation signs on the 4H chart.
Entry Zone: 0.02567 (Bullish Order Block)
Stop Loss: 0.02406
Target: 0.03177 (Liquidity Pool Above)
Technical Breakdown:
🔹 Price broke out with clear bullish displacement after a period of consolidation.
🔹 Now retracing back into a key order block, offering a potential re-entry zone for continuation.
🔹 Liquidity resting above 0.03177 acts as a magnet for price — expect draw-on-liquidity play.
🔹 Market structure is still printing higher highs and higher lows, confirming bullish bias.
Bias: Bullish
Strategy: Order Block Re-entry (4H)
Plan: Wait for confirmation at OB zone before executing longs for continuation toward liquidity target.
Smart Money traders, keep this setup on radar. DYOR, NFA.
XRP Breaks Above $3 – Bullish Momentum BuildsOverview:
XRP has officially closed the week above the $3 mark, a psychological resistance now turning into support. This is a major technical shift suggesting renewed bullish control.
🔑 Key Levels to Watch:
Support: $3.00
Short-Term Target: $3.20
Major Resistance / Magnet: $3.60 (All-Time High)
📊 Market Structure:
XRP appears to be breaking out of a consolidation zone between $2.70 and $3.00. This range held for several weeks, and a clean breakout could fuel a strong continuation toward previous highs.
🐂 Bullish Scenario:
Continued higher highs with volume could open the path to $3.20 and eventually $3.60.
A successful retest of the $3 level as support would further validate the breakout.
⚠️ Risk Note:
Watch for any fakeouts or low-volume rallies. A drop below $3 would negate the breakout and put the $2.70 support back in play.
📅 Outlook:
With Q4 2025 underway, a rally toward the ATH at $3.60 could be driven by both technical momentum and market sentiment.
💬 What’s your take? Are we heading for a new ATH this quarter?
📌 #XRP #Crypto #Altcoins #Breakout #TechnicalAnalysis #Q4Outlook

XRP Price Action – Accumulation Before GrowthXRP is currently navigating a phase defined by liquidity-driven swings and rapid sentiment shifts. After the market endured a heavy decline, buyers have re-emerged, showing resilience through aggressive rebounds. This behavior reflects a deeper pattern: sellers are losing efficiency in driving the market lower, while buyers are treating each dip as an opportunity to accumulate.
In the short term, the market appears to be balancing between two forces — the need for a corrective retracement to secure liquidity, and the desire of participants to push price into higher zones. This tug-of-war often results in shallow pullbacks, where temporary declines are quickly absorbed. Such behavior highlights that speculative capital is rotating back into XRP, aligning with broader risk-on sentiment across digital assets.
If this pattern holds, the near-term trajectory favors gradual expansion, with the asset likely aiming for higher valuations. However, investors should remain aware that short-term corrections are less about trend reversals and more about the mechanics of liquidity collection.

#ETHEREUM – Macro Breakout Setup#ETHEREUM – Macro Breakout Setup 🚀
▶️ 6th time in history testing $4K macro resistance.
▶️ A clean weekly close above could ignite HTF expansion to $8K → $10K → $15K.
6 rejections in 4 years… one breakout can change it all.
NFA & DYOR

POL Could 3x After Breakout: Are You Buying the Right Zone?Price is consolidating above the accumulation zone ($0.19–$0.21) after multiple rejections off demand.
Now trading above this base, if price retests the zone, it could offer a high-probability entry.
Key Resistance = Targets: $0.28 → $0.41 → $0.52 → $0.70 → $1–$2
Structure remains valid above $0.150 (HTF close below = invalidation)
Break + Retest of $0.28 = Bullish continuation confirmed
Setup: Accumulation → Expansion
NFA & DYOR

XRP - 3.98 or move is comingXRP is following wave theory and price will see minimum 3.98 will be seen in this up move.

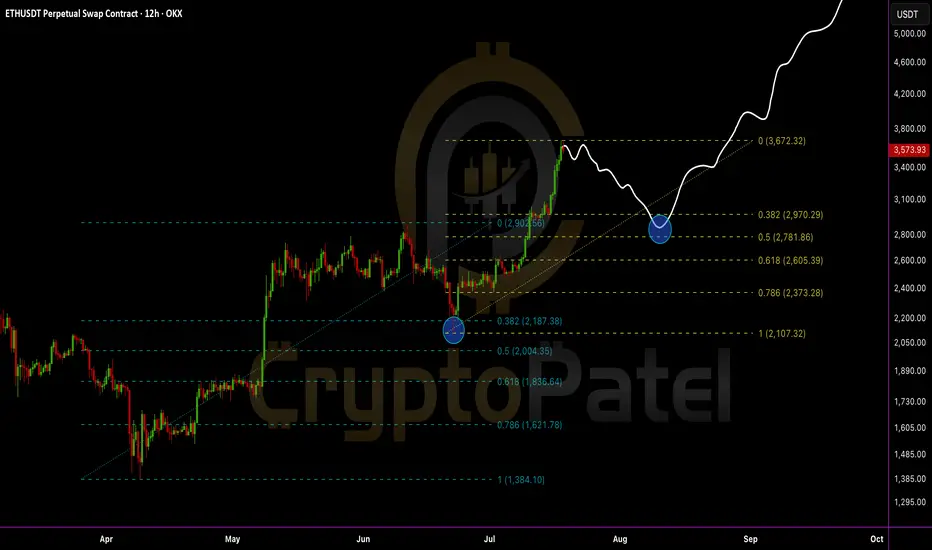
Everyone’s bullish now… but smart traders are waiting for this EEthereum just tapped a key resistance near $3,672 and is starting to show signs of cooling off.
A healthy retracement could bring ETH back to:
0.382 Fib – $2,970
0.5 Fib – $2,781
0.618 Fib – $2,605 (Strong demand zone)
IMO, we can expect ETH to revisit the $2,700–$3,000 zone before the next leg up.
This area will be the golden re-entry for long-term targets of $6,000–$8,000.
Stop-loss: Recent high and candle close above $3,675
Structure remains bullish:
✅ Previous dips into Fibs triggered strong buybacks
✅ Clean higher highs and higher lows
✅ Demand zone + retracement = opportunity
My View: Let price pull back. Then load up again. Bigger wave incoming.
DYOR | NFA