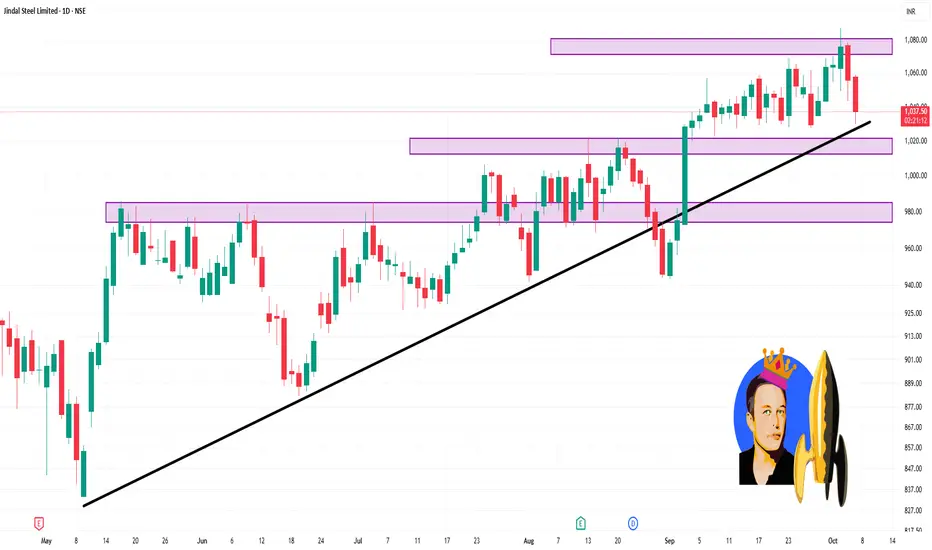
Jindal Steel 1D Next levels on Track Jindal Steel & Power shares have climbed recently as the company continues executing its capacity expansion at the Angul plant — commissioning new furnaces and boosting steelmaking throughput — which has improved volume visibility and supported sentiment. Stronger broker target revisions, including analysts raising target prices on the stock following capacity additions and better product mix expectations, have also helped lift the share price in recent sessions
Psychological resistance zone: ₹1217
Next important resistance: ₹1277
(This is for informational context only, not buy/sell advice.)
Jindalsteel

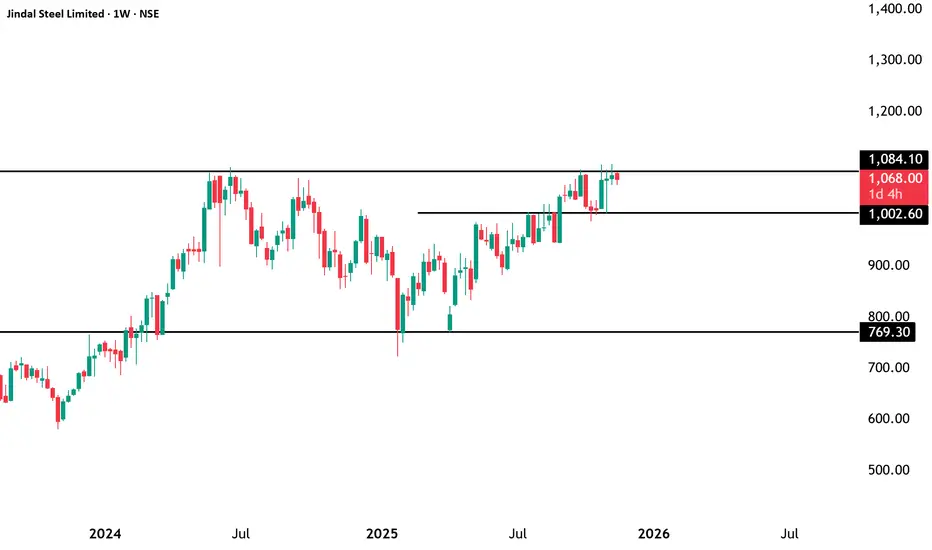
Jindal Steel (W): Cautiously Bullish (Breakout Rejection)(Timeframe: Weekly | Scale: Logarithmic)
The stock attempted a major breakout from its 2-year consolidation but faced a classic "Shooting Star" / Rejection at the All-Time High. While the trend is up, the inability to close above ₹1,085 signals that the "Smart Money" is booking profits ahead of the Jan 30 earnings.
🚀 1. The Fundamental Catalyst (The "Why")
The price action is dominated by the upcoming event:
> Q3 Earnings (Jan 30): With results just a week away, investors are risk-averse. The stock needs a "Earnings Beat" to justify a price above ₹1,100.
> Sector Strength: The Nifty Metal Index is strong (up ~7% this month), which is why the stock is hugging the resistance rather than crashing.
📈 2. The Chart Structure (The Trap)
> The Box: ₹750 – ₹1,085 consolidation range. This "Time Correction" has been healthy.
> The Fakeout (This Week):
- The Move: The stock spiked to ₹1,104 (New High) but was hammered down to close below ₹1,085 .
- Interpretation: This leaves a long "Upper Wick" on the weekly candle, indicating that bears are still defending this fortress. A "Look Above and Fail" often leads to a short-term pullback.
📊 3. Volume & Indicators
> Volume: The "Above Average" volume on a rejection candle is a warning. It implies that while buyers tried to push up, sellers unloaded heavy quantities (Churning).
> RSI: Rising but showing a potential Negative Divergence on daily frames if price makes a high but RSI doesn't.
🎯 4. Future Scenarios & Key Levels
The trade is now an "Event Play."
🐂 Bullish Breakout (Post-Earnings):
- Trigger: A decisive Weekly Close above ₹1,105 (clearing the new wick).
- Target 1: ₹1,235.
- Target 2: ₹1,350.
🛡️ Support (The "Buy Zone"):
- Immediate Support: ₹980 – ₹1,000 .
- Strategy: If the stock dips to ₹980 before Jan 30, it is a low-risk entry.
- Stop Loss: A close below ₹950 invalidates the bullish structure.
Conclusion
This is a "Wait for Confirmation" Setup .
> Refinement: Do not buy the "intraday breakout." Wait for a Closing Basis breakout above ₹1,105.
> Action: Keep it on the watchlist. The real move will likely happen after Jan 30 results.

JSPL: Steeling Up for a Breakout MoveNSE:JINDALSTEL
======================================
1. Technical Analysis (Chart)
======================================
Trend: Strong Bullish (Higher Highs, Higher Lows).
Breakout Zone: ₹1,084. A weekly close above this enters uncharted territory (Blue Sky Zone).
Immediate Support: ₹1,002. The trend remains positive as long as the price holds above this.
Major Support: ₹770. Best accumulation zone for long-term investors.
Price Action: Currently consolidating at the top. A "Red Candle" at resistance suggests minor profit booking before the next leg up.
======================================
2. Fundamental Analysis (Q2 FY26 Data)
======================================
Recent Earnings: Weak. Net Profit fell ~26% YoY to ₹635 Cr due to higher input costs, though Revenue was stable at ₹13,505 Cr.
Valuation: Expensive. Trading at a P/E of ~39x (vs Industry ~20x). The market is pricing in future growth, leaving little room for error.
Margins: Compressed to ~17-18% (down from ~24%).
Debt: Controlled. Net Debt reduced to ~₹14,156 Cr, showing good balance sheet discipline despite heavy Capex.
======================================
3. Future Growth (The "Why" to Buy)
======================================
Angul Expansion: Capacity recently jumped from 6 MTPA to ~12.6 MTPA. This volume doubling is the key revenue driver for FY26-27.
Product Shift: Moving to Flat Steel (Hot Strip Mill). This commands higher margins than construction steel.
Raw Material Security: Owns captive coal mines (Utkal-C), protecting it from global coal price shocks better than peers.
2030 Vision: Aiming for 25 MTPA capacity, targeting to be the world’s largest single-location steel plant.
⚠️ Disclaimer:
This analysis is for educational and informational purposes only.
We are not SEBI-registered analysts or advisors.
This is our personal view based on available data and market trends.
Please consult your SEBI-registered investment advisor before making any investment or trading decisions.
You are solely responsible for any financial decisions you make based on this content.
========================
Trade Secrets By Pratik
========================
JINDALSTEEL: Classic Breakout & Retest Setup!1. Price is rejecting from the 17years ath level acting as very strong support.
2. EMAs are also supporting the strength.
3. Overall RRR looks decent enough.
⚠️ Disclaimer: This is NOT a buy/sell recommendation. This post is meant for learning purposes only. Views are personal. Please, do your due diligence before investing.⚠️
💬 What are your thoughts on this share it in the comments below. ✌️
🔥 Happy Trading!✅🚀

JINDALSTEL 1 Day Time Frame 📈 Intraday Support & Resistance Levels
Resistance Levels:
₹1,078.87
₹1,071.93
₹1,063.47
Support Levels:
₹1,056.54
₹1,048.07
₹1,041.13
These levels are derived from pivot point calculations and are useful for short-term trading decisions.
🔍 Technical Indicators
Relative Strength Index (RSI): Currently at 39.78, indicating a bearish condition.
MACD: At -3.67, suggesting a bearish trend.
Moving Averages: The stock shows a strong sell outlook based on moving averages ranging from MA5 to MA200, with 2 buy signals and 10 sell signals.
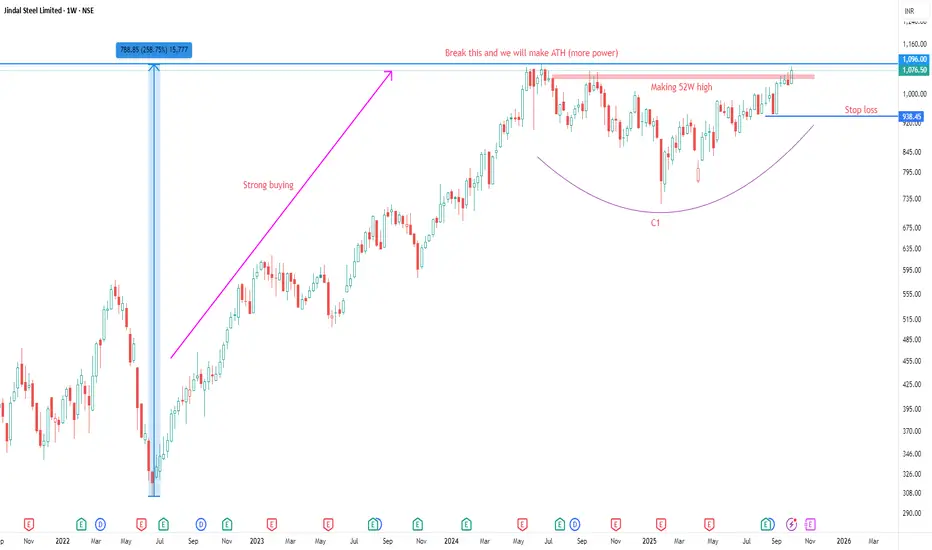
JINDAL STEEL LTD ANALYSISFOR LEARNING PURPOSE
JINDAL STEEL LTD- The current price of JINDAL STEEL LTD is 1076.50 rupees
I am going to buy this stock because of the reasons as follows-
1. Its making 52W high with some good volume (sign of strength)
2. It got a great buying force and moved up by 250% in 2022-2023 (which shows smart money)
3. It is showing better relative strength as it stood strong in volatile times including last few weeks.
4. The risk and reward is favourable. The good part- The stock is not extended.
5. The stock can be a good turnaround story if it does great in coming time.
6. The stock has got a good catalyst and that is- Promoters have increased their stake in this stock.
7. Another good part- The sector is looking bullish. Metal sector is on the verge of making ATH
I am expecting more from this in coming weeks
I will buy it with minimum target of 35-40% and then will trail after that.
My SL is at 938.45 rupees
I will be managing my risk.
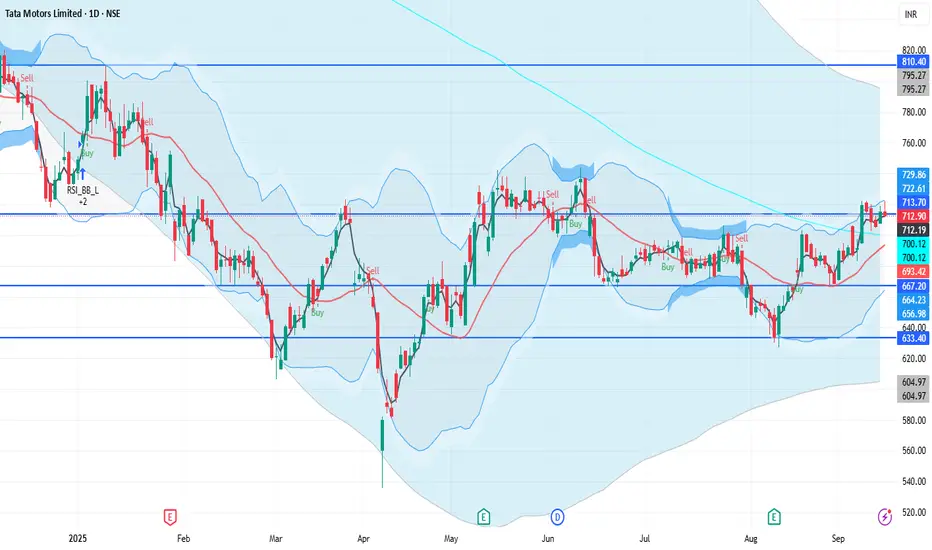
TATAMOTORS 1D Time frameUpdated Snapshot
Current Price: ₹712 – ₹715
Day’s Range: ₹712 – ₹721.95
Previous Close: ₹705.85
🔹 Support & Resistance
Support 1: ₹710 – ₹708
Support 2: ₹700 – ₹705
Resistance 1: ₹721 – ₹725
Resistance 2: ₹735 – ₹740
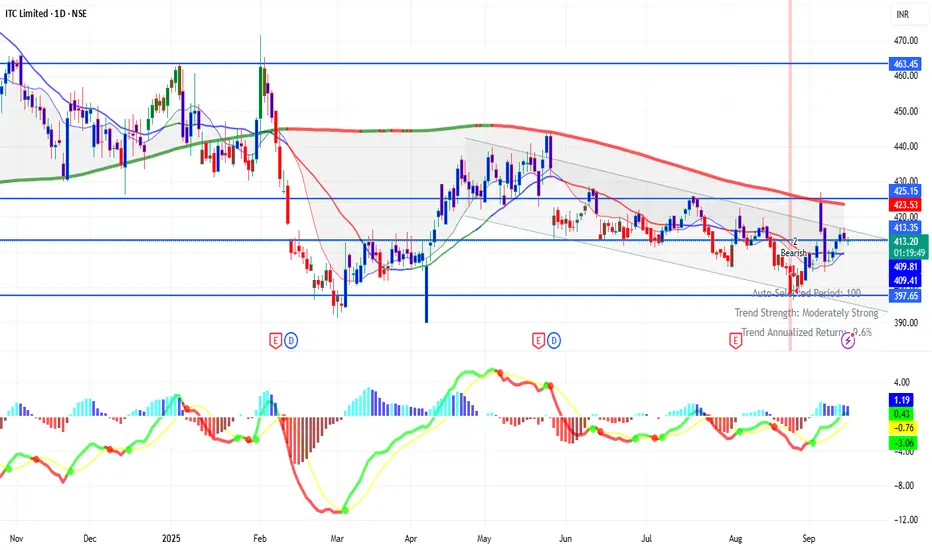
ITC 1D Time framePrice Action
Current Price: ₹413.75 (approx)
Day’s Range: ₹413.05 – ₹414.30
52-Week Range: ₹390.15 – ₹528.50
🔹 Support & Resistance
Immediate Support: ₹410 – ₹408
Next Support: ₹402 – ₹397
Immediate Resistance: ₹416 – ₹420
Next Resistance: ₹422 – ₹428
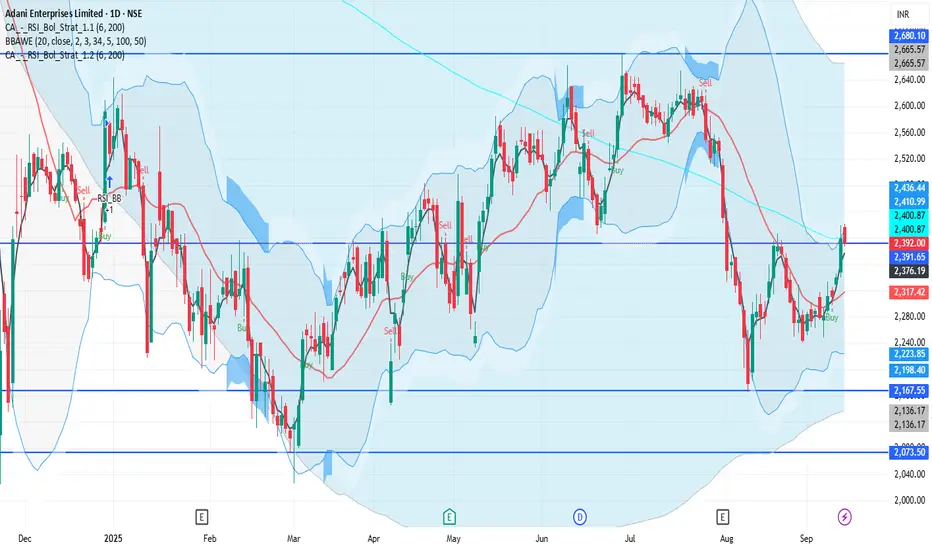
ADANIENT 1D Time frameCurrent Price & Trend
Price: ₹2,392.00
Trend: Neutral; trading approximately 25.5% below its 52-week high of ₹3,211.00, achieved on July 1, 2025.
Momentum: Indicators suggest a neutral to slightly bearish outlook.
Bullish Scenario
Breakout Above ₹2,420: A sustained move above ₹2,420 could target ₹2,440 – ₹2,450 in the short term.
SBIN 1D Time frameCurrent Price Action (Daily Chart)
Price Range: Stock is moving between ₹815 – ₹830 right now.
Trend: Consolidation with mild bullish bias.
Key Levels
Immediate Resistance: ₹830
Next Resistance: ₹840 – ₹850
Major Resistance: Around ₹875 (previous high)
Immediate Support: ₹815 – ₹820
Strong Support: ₹800 – ₹805
Critical Support: ₹785

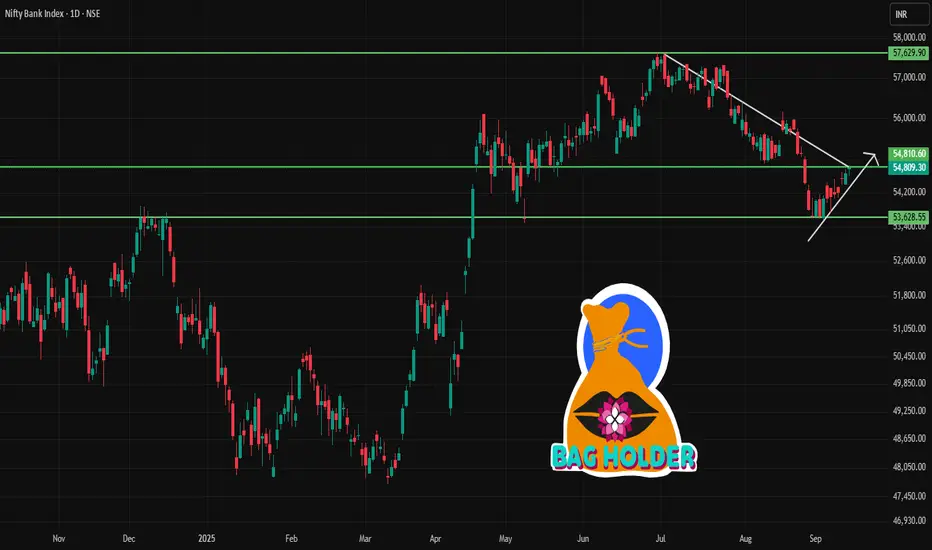
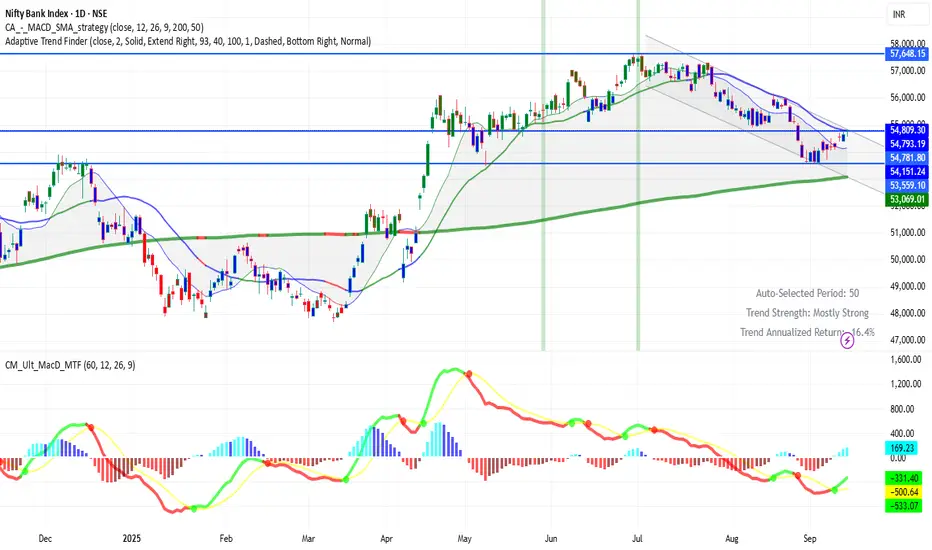
BANKNIFTY 1D Time frame📉 Current Market Snapshot
Closing Price: ₹54,809.30
Day's Range: ₹54,580.35 – ₹54,852.25
52-Week Range: ₹47,702.90 – ₹57,628.40
Market Cap: ₹45,50,788 crore
P/E Ratio: 14.9
Dividend Yield: 1.09%
Price-to-Book Ratio: 2.03
1-Year Return: +5.87%
5-Year Return: +147.36%
10-Year Return: +12.5%
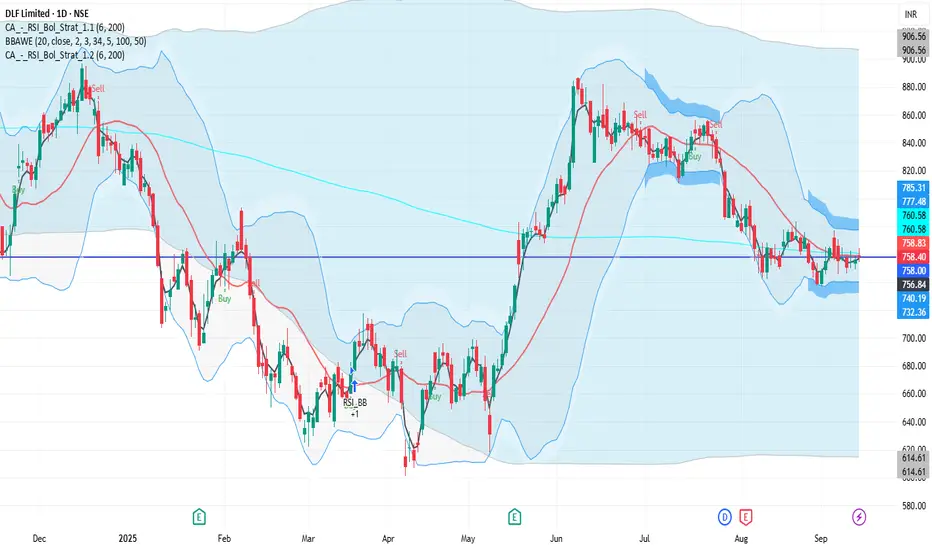
DLF 1D Time frame📉 Current Market Snapshot
Current Price: ₹758.40
Previous Close: ₹756.35
Day's Range: ₹754.20 – ₹764.40
52-Week High: ₹929.00
52-Week Low: ₹601.20
Market Cap: ₹1.87 lakh crore
P/E Ratio: 41.85
Dividend Yield: 0.79%
ROE: 10.76%
Debt-to-Equity Ratio: 0.10
Beta: 1.78
EPS (TTM): ₹18.12
Book Value: ₹172.51
Face Value: ₹2.00
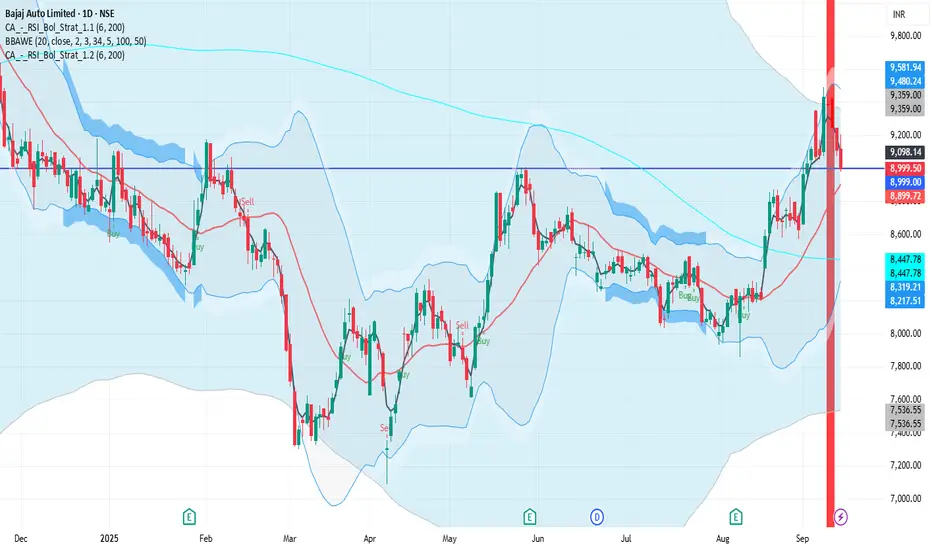
BAJAJ_AUTO 1D Time frame📉 Current Market Snapshot
Previous Close: ₹9,113.50
Today's Range: ₹8,979.50 – ₹9,205.00
Current Price: ₹8,999.50
Market Cap: ₹2,51,318 crore
P/E Ratio: 33.1
Dividend Yield: 2.33%
52-Week High: ₹12,774
52-Week Low: ₹7,089.35
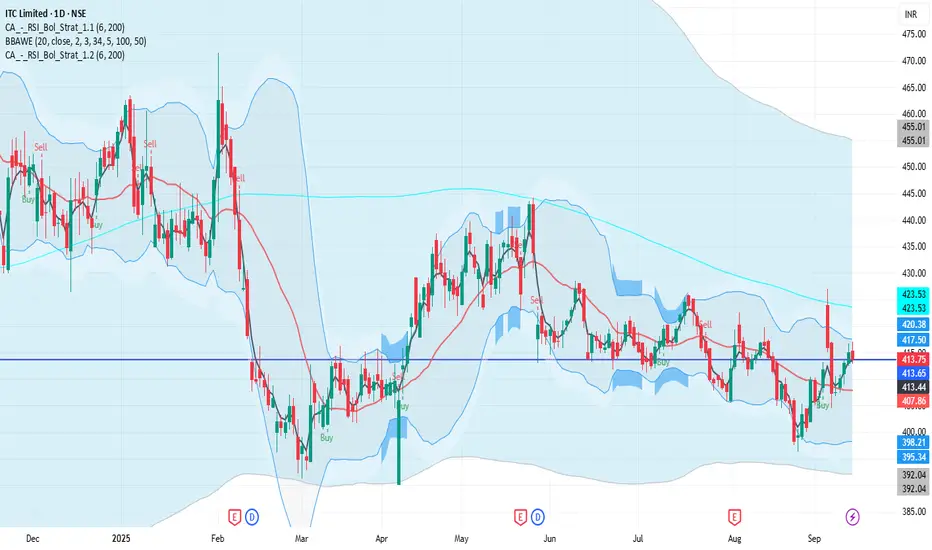
ITC 1D Time frame📉 Current Market Snapshot
Previous Close: ₹413.05
Day's Range: ₹412.85 – ₹417.05
52-Week High: ₹528.50
52-Week Low: ₹390.15
Market Cap: ₹5.18 lakh crore
Dividend Yield: ~3.47%
P/E Ratio: 25.9
ROE: 27.3%
ROCE: 36.8%
Debt-to-Equity Ratio: 0.00
NIFTY 1D Time frame📍 Current Level
25,114.00 (closing value)
Short-Term Outlook
Bullish Scenario: A sustained move above ₹25,200 could lead to a test of the 52-week high around ₹26,277.35.
Bearish Scenario: A drop below ₹25,000 may signal a potential pullback toward ₹24,800.

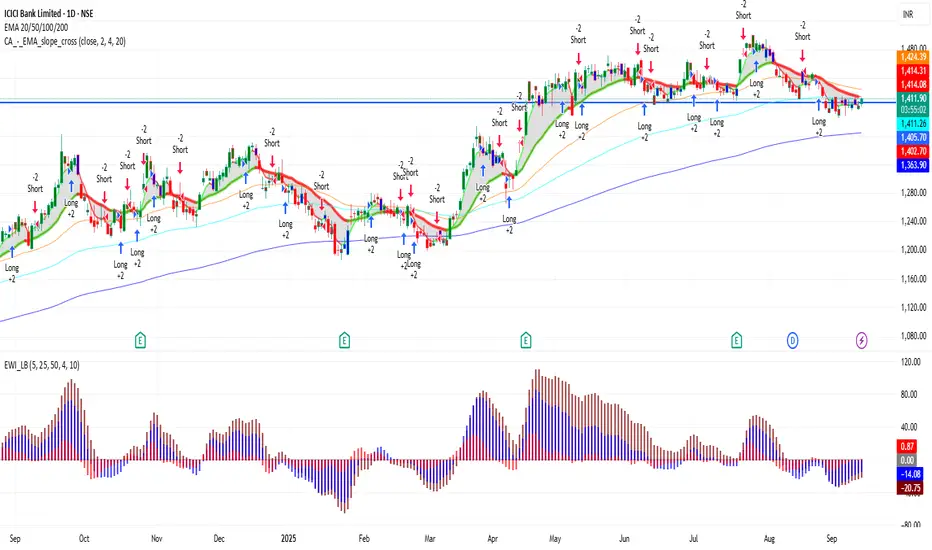
ICICIBANK 1D Time frame📍 Current Price
₹1,417.70 (closing price)
Short-Term Outlook
Bullish Scenario: A sustained move above ₹1,430 could lead to a test of the 52-week high around ₹1,500.
Bearish Scenario: A drop below ₹1,390 may signal a potential pullback toward ₹1,350.

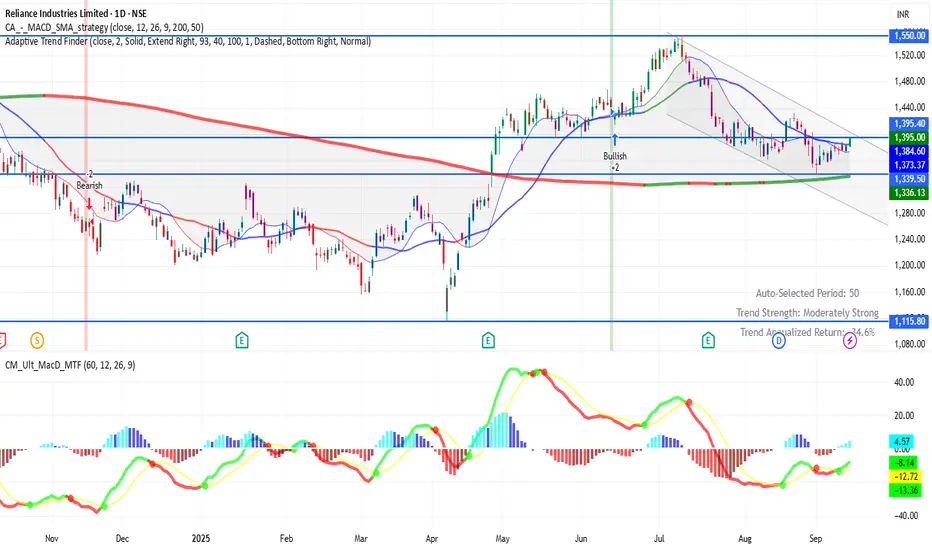
RELIANCE 1D Time frame Current Status
Price around ₹1395
Day range: ₹1380 – ₹1396
52-week range: ₹1115 – ₹1551
Key Levels
Support zones: ₹1380 → ₹1370 → ₹1350
Resistance zones: ₹1400 → ₹1410 → ₹1430
BANKNIFTY (1D timeframe)📍 Current Level
Trading around 54,809 points
🔑 Key Levels
Immediate Resistance: 55,000 → 55,200
Immediate Support: 54,400 → 54,500
Deeper Support: 53,800 → 53,500
✅ Outlook
If BankNifty breaks and holds above 55,000–55,200, more upside is possible.
If it falls below 54,400–54,500, weakness can take it down toward 53,800–53,500.
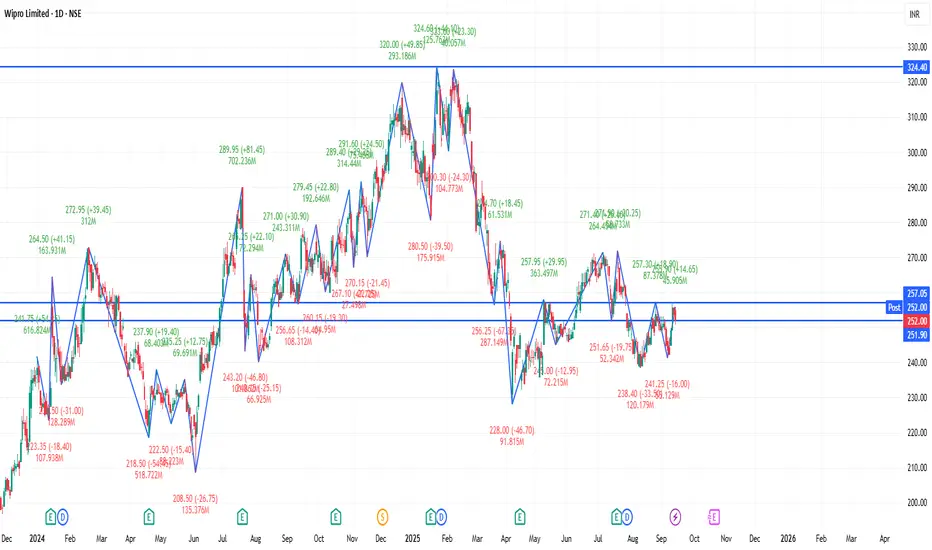
WIPRO 1D Time frame🔢 Current Level
Trading around ₹252.91
🔑 Key Resistance & Support Levels
Resistance Zones:
₹254.00 – ₹255.00 (recent highs; breakout above this may lead to further upside)
₹260.00 – ₹262.00 (stronger resistance above)
Support Zones:
₹250.00 – ₹251.00 (immediate support; failure to hold above this may lead to a decline)
₹245.00 – ₹246.00 (short-term support; a break below this could indicate weakness)
₹240.00 – ₹242.00 (deeper support zone if price dips further)
📉 Outlook
Bullish Scenario: If Wipro holds above ₹251.00, upward momentum may continue. Break above ₹255.00 can open the way toward ₹260.00+.
Bearish Scenario: If it falls below ₹245.00, risk increases toward ₹240.00 – ₹242.00.
Neutral / Range: Between ₹251.00 – ₹255.00, Wipro may consolidate before a directional move.
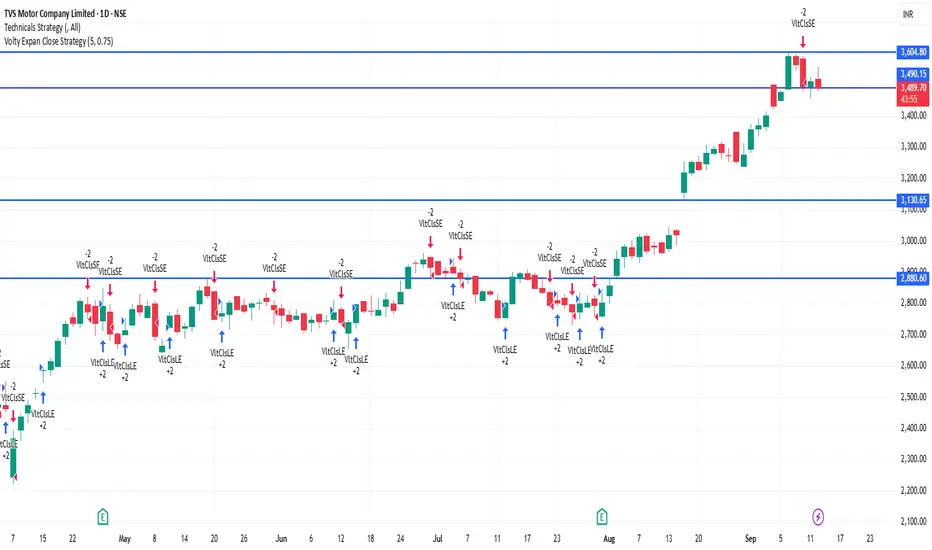
TVSMOTOR 1D Time frame🔢 Current Level
Trading around ₹3,490 – ₹3,526
🔑 Key Resistance & Support Levels
Resistance Zones:
₹3,550 – ₹3,556 (near-term resistance; breakout above this may lead to further upside)
₹3,600 (psychological resistance)
₹3,650 (stronger resistance above)
Support Zones:
₹3,510 – ₹3,520 (immediate support; failure to hold above this may lead to a decline)
₹3,480 – ₹3,490 (short-term support; a break below this could indicate weakness)
₹3,400 – ₹3,450 (deeper support zone if price dips further)
📉 Outlook
Bullish Scenario: If TVS Motor holds above ₹3,520, upward momentum may continue. Break above ₹3,556 can open the way toward ₹3,600+.
Bearish Scenario: If it falls below ₹3,480, risk increases toward ₹3,400 – ₹3,450.
Neutral / Range: Between ₹3,520 – ₹3,556, TVS Motor may consolidate before a directional move.
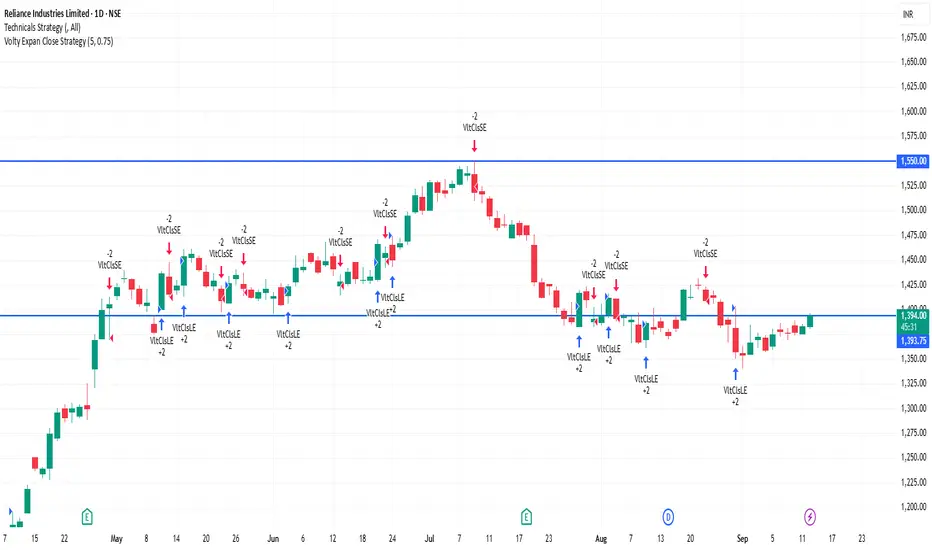
RELIANCE 1D Time frame🔢 Current Level
Trading around ₹1,391.50 - ₹1,395.50
🔑 Key Resistance & Support Levels
Resistance Zones:
₹1,396 – ₹1,400 (recent highs; breakout above this may lead to further upside)
₹1,420 – ₹1,430 (stronger resistance above)
Support Zones:
₹1,380 – ₹1,385 (immediate support; failure to hold above this may lead to a decline)
₹1,370 – ₹1,375 (short-term support; a break below this could indicate weakness)
₹1,350 – ₹1,360 (deeper support zone if price dips further)
📉 Outlook
Bullish Scenario: If Reliance Industries holds above ₹1,385, upward momentum may continue. Break above ₹1,400 can open the way toward ₹1,420+.
Bearish Scenario: If it falls below ₹1,370, risk increases toward ₹1,350 – ₹1,360.
Neutral / Range: Between ₹1,385 – ₹1,400, Reliance Industries may consolidate before a directional move.
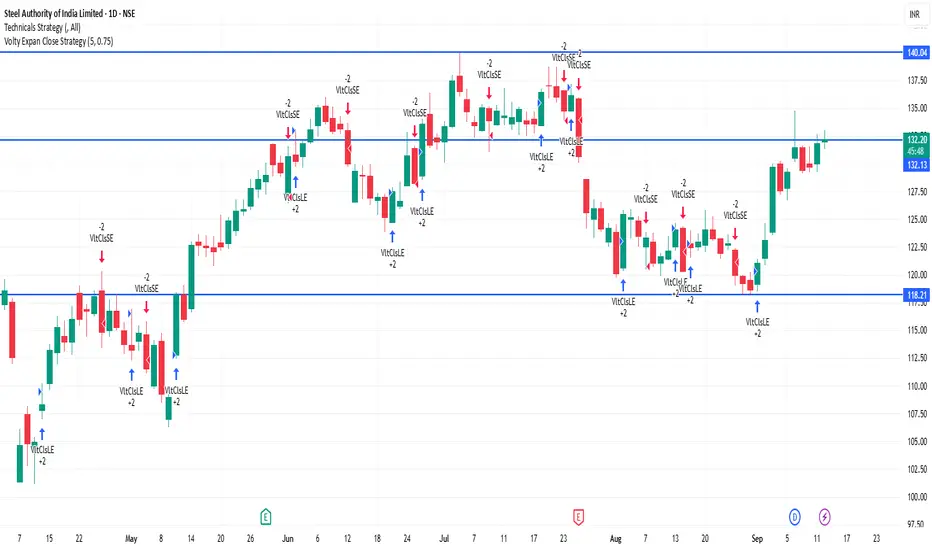
SAIL 1D Time frame🔢 Current Level
Trading around ₹132.28
🔑 Key Resistance & Support Levels
Resistance Zones:
₹133.00 – ₹134.00 (near-term resistance; breakout above this may lead to further upside)
₹135.00 – ₹136.00 (stronger resistance above)
Support Zones:
₹131.50 – ₹132.00 (immediate support; failure to hold above this may lead to a decline)
₹130.00 – ₹130.50 (short-term support; a break below this could indicate weakness)
₹128.00 – ₹129.00 (deeper support zone if price dips further)
📉 Outlook
Bullish Scenario: If SAIL holds above ₹132.00, upward momentum may continue. Break above ₹134.00 can open the way toward ₹135.00+.
Bearish Scenario: If it falls below ₹130.00, risk increases toward ₹128.00 – ₹129.00.
Neutral / Range: Between ₹132.00 – ₹134.00, SAIL may consolidate before a directional move.
ICICIBANK 1D Time frame🔢 Current Level
ICICIBANK is trading around ₹1,401 – ₹1,412
🔑 Key Resistance & Support Levels
Resistance Zones:
₹1,407 – ₹1,415 (near-term resistance)
₹1,416 (next resistance level)
Support Zones:
₹1,390 – ₹1,392 (immediate support)
₹1,360 – ₹1,365 (stronger support if price dips further)
📉 Outlook
Bullish Scenario: If ICICIBANK holds above ₹1,392, upward momentum may continue. Break above ₹1,410 – ₹1,414 can open the way toward higher levels.
Bearish Scenario: If it falls below ₹1,360, risk increases toward ₹1,340 – ₹1,345.
Neutral / Range: Between ₹1,392 – ₹1,410, ICICIBANK may consolidate before a directional move.