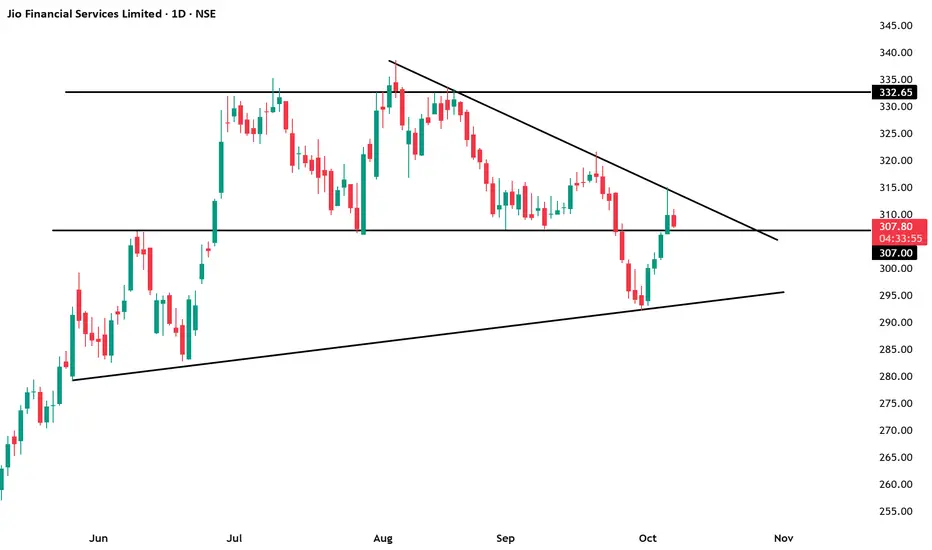
JIOFIN : Strong Story, Weak Chart — Waiting for the Breakout.NSE:JIOFIN
📊 Jio Financial Services – Quick Analysis (Weekly)
CMP: ~₹297
🔹 Technical
Above ₹301, price may see a technical rebound with pullback buyers becoming active.
Primary trend bearish (lower highs–lower lows)
Price inside descending channel / falling wedge
Resistance: ₹330–335
Support: ₹288
Above ₹335 (weekly close): Trend reversal
Below ₹288: Downside risk to ₹260–240
🔹 Fundamental
Debt-free NBFC backed by Reliance Group
Strong balance sheet, execution still evolving
Valuation driven by future potential, not current earnings
🔹 Future Growth
Entry into lending, payments, AMC, digital finance
Leverages Jio ecosystem & data advantage
Growth depends on speed of monetization & execution
🔹 Outlook
Short term: Range-bound / weak
Medium term: Neutral till ₹335 breakout
Long term: Positive with patience
==============
⚠️ Disclaimer:
==============
This content is shared strictly for educational and informational purposes.
We are not SEBI-registered investment advisors or analysts.
The views expressed are personal opinions, based on publicly available data and market observations.
Please consult a SEBI-registered investment advisor before taking any investment or trading decisions.
Any actions taken based on this content are entirely at your own risk and responsibility.
========================
Trade Secrets By Pratik
========================
JIOFIN

Jio Financial – Breakout Base Forming | Momentum Rebuilding
Structure
Price forming a clean ascending triangle with horizontal resistance near ₹285–289.
Higher lows forming consistently → accumulation behaviour visible.
Trend & Momentum
Trading above 21 EMA and 200 EMA, trend supportive.
RSI holding above 55, bull-range intact.
MACD flattening & attempting a positive crossover.
Volume
Contraction during consolidation → typical pre-breakout behaviour.
Key Levels
Breakout Trigger: Close above ₹289
Supports: ₹270 → ₹263
Invalidation: Close below ₹263
Bias
Bullish above breakout zone
Monitoring for volume expansion and strong close.
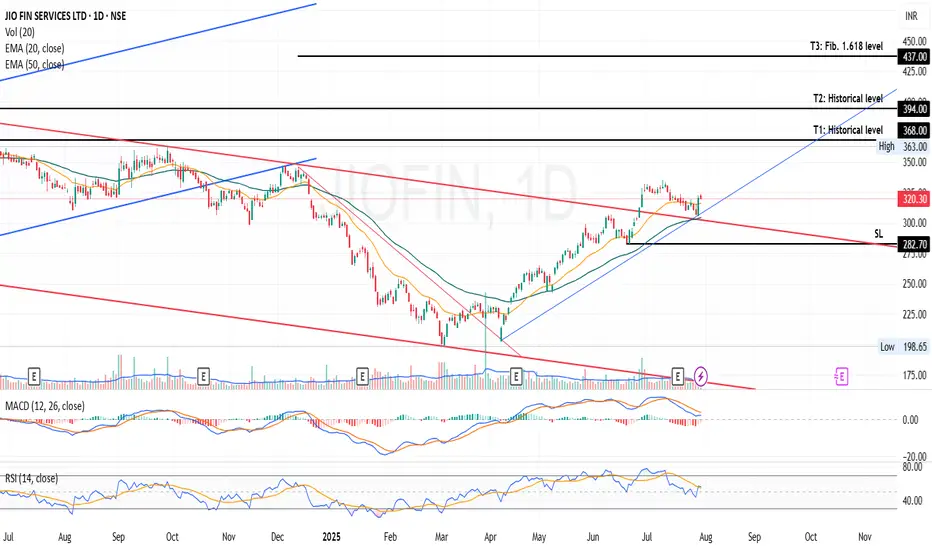
Jio Financial Services Ltd - Breakout OpportunityDate : 30-Jul-2025
LTP : Rs. 320.30
Targets: (T1) Rs. 368 --> (T2) Rs. 394 --> (T3) Rs. 437
SL : Rs. 282
Technical View:
• NSE:JIOFIN was going through primary downtrend since Apr 2024. From it's lifetime high of 394.70 in Apr 2024, it has retraced 50% to 198.65 in Mar 2025.
• From Apr 2025, NSE:JIOFIN has started moving in secondary uptrend within its primary downtrend and had given a breakout from its primary downtrend on 26-Jun-2025 with higher than average volume.
• on 28-Jul-2025, NSE:JIOFIN has re-tested the downtrend line and bounced back closing above 20 DEMA.
• NSE:JIOFIN is currently trading above 20 DEMA and 50 DEMA.
• MACD is trading at 2.38 and RSI is trading at 56.18.
• Looking good to continue the current momentum.
If you have liked this analysis, please Boost/Like this idea and follow my ID for more ideas.
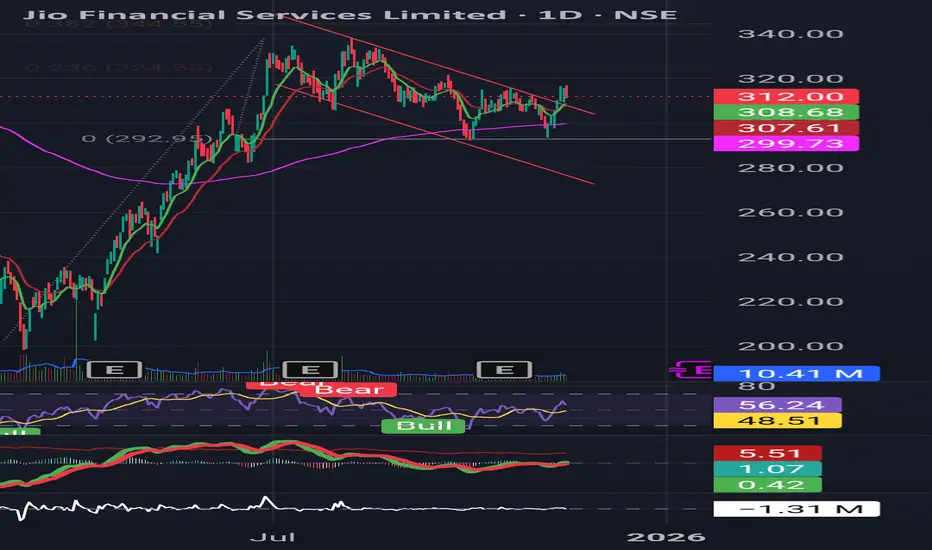
Jio Financial Services (JIOFIN)Pattern: Bullish Flag
Breakout Zone: Above ₹312
Structure: Flag developing after a strong pole; EMAs supportive and flattening upward
Momentum: RSI recovering above 50, MACD histogram turning positive
Plan:
Buy Trigger: Close above ₹312
Stoploss: ATR-based (~₹298)
Targets: ₹360 → ₹388
View: Post-consolidation breakout potential; improving sentiment in Financials sector.

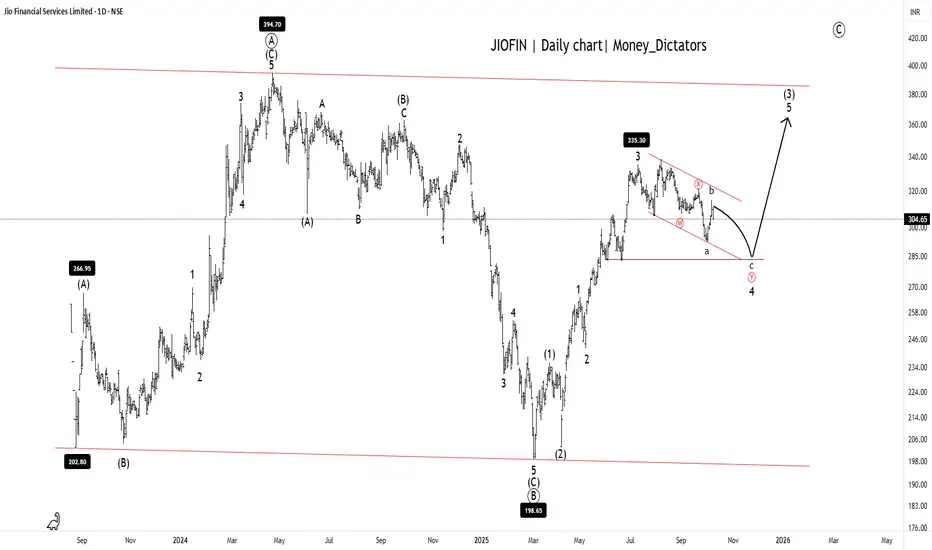
JIOFIN Setting Up for the Next Big Breakout!JIOFIN Daily chart
Possible short-term dip toward 285 - 290.
Long-term Levels: 335, 368, and 342.
Overall Trend: Bullish
Short-term trend: Bearish
JIOFIN is ready for the final upsurge as the correction ends at wave (C). A major A-B-C correction of the primary degree is clearly visible on the daily timeframe chart. Upon closer examination, it appears that the JIOFIN is currently in wave (Y) of wave 4. After completion of the wave 4 structure, stock will set for the wave 4 for the given long-term levels.
Stay tuned!
@Money_Dictators
Thanks :)
JIOFin Good to keep on RadarNSE:JIOFIN
JioFin has been Consolidating for long time; it's good to keep on radar as we are expecting BO soon
⚠️ Disclaimer:
This analysis is for educational and informational purposes only.
We are not SEBI-registered analysts or advisors.
This is our personal view based on available data and market trends.
Please consult your SEBI-registered investment advisor before making any investment or trading decisions.
You are solely responsible for any financial decisions you make based on this content.
========================
Trade Secrets By Pratik
========================
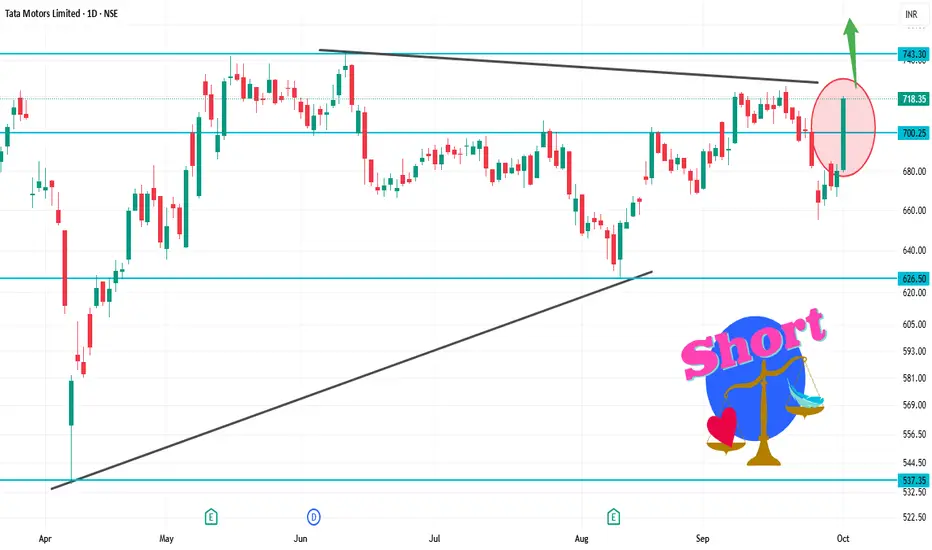
TATAMOTORS 1D Time frameCurrent Price: ₹718
Day Range (today): Around ₹705 – ₹725
52-Week Range: ₹535 – ~₹1,000
📏 Key Levels with ₹718 in focus
Immediate Resistance: ₹750 – ₹800 (needs breakout above this zone)
Current Level: ₹718 → price is right between support and resistance
Immediate Support: ₹700 – ₹705 (if broken, could fall further)
Next Support: ₹650 – ₹660 (major zone to watch)
🧠 What this means
Since price is just above support (₹705) and below resistance (₹750), it’s at a decision point.
If Tata Motors holds above ₹705–₹710, buyers may try to push toward ₹740–₹750.
If it fails and breaks below ₹705, price may revisit ₹660 levels.
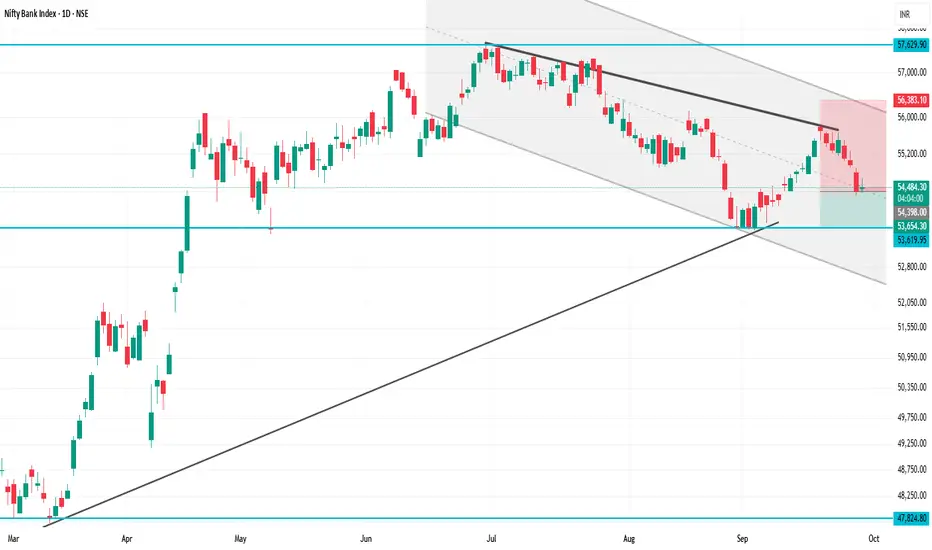
BANKNIFTY 1D Time frameCurrent Level: ₹54,651
Opening Level: ₹54,460
Day’s Range: ₹54,366 – ₹54,686
🔑 Key Support & Resistance
Immediate Support: ₹54,500
Immediate Resistance: ₹54,800
Pivot Point: ₹54,651
📈 Strategy (1D Timeframe)
1. Bullish Scenario
Entry: Above ₹54,800
Stop-Loss: ₹54,500
Target: ₹55,100 → ₹55,300
2. Bearish Scenario
Entry: Below ₹54,500
Stop-Loss: ₹54,800
Target: ₹54,300 → ₹54,100
⚠️ Risk Management
Limit risk to 1% of capital per trade.
Always use stop-loss to protect against unexpected market moves.
Watch sector news and broader market trends that can impact BANKNIFTY.
JIO FINANCE Jio finance could test below support 📉 at 292 -- 295 level within 4th Sep to 16th Sep 2025
or to the white trend line marked on the chart.
Disclaimer :
It's a personal view not a financial advice and I assume no responsibility and liability whatever outcome arises.

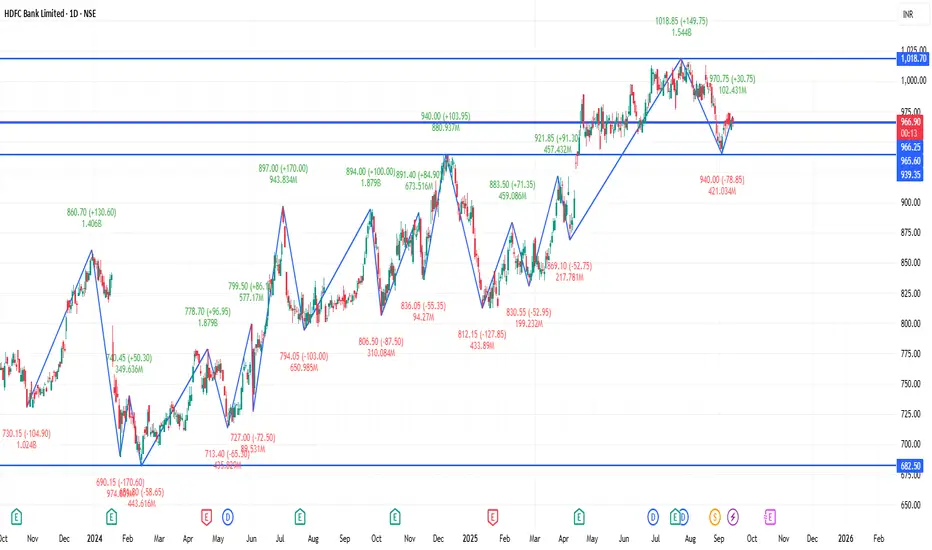
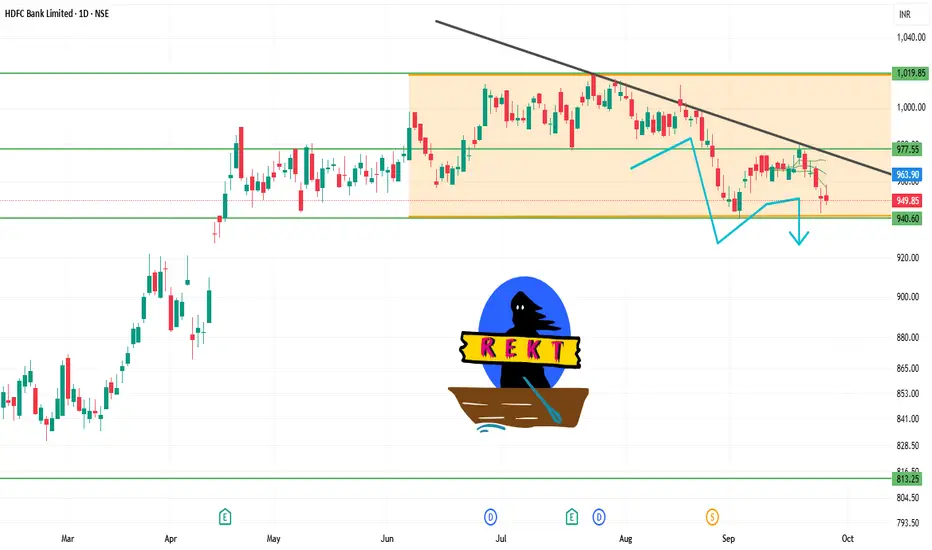
HDFCBANK 1D Time frame📊 Daily Snapshot
Closing Price: ₹949.20
Day’s Range: ₹947.40 – ₹958.00
Previous Close: ₹957.20
Change: Down –0.52%
52-Week Range: ₹806.50 – ₹1,018.85
Market Cap: ₹14.6 lakh crore
P/E Ratio: 20.66
Dividend Yield: 2.32%
EPS (TTM): ₹45.97
Beta: 0.92 (indicating lower volatility)
🔑 Key Technical Levels
Support Zone: ₹947.40 – ₹950.00
Resistance Zone: ₹957.20 – ₹960.00
All-Time High: ₹1,018.85
📈 Strategy (1D Timeframe)
1. Bullish Scenario
Entry: Above ₹957.20
Stop-Loss: ₹947.40
Target: ₹965.00 → ₹970.00
2. Bearish Scenario
Entry: Below ₹947.40
Stop-Loss: ₹957.20
Target: ₹940.00 → ₹935.00
MARUTI 1D Time frame📊 Daily Snapshot
Closing Price: ₹16,240
Day’s Range: ₹16,063 – ₹16,375
52‑Week Range: ₹10,725 – ₹16,375
Market Cap: ₹5.1 lakh crore
P/E Ratio: 35.1
Dividend Yield: 0.83%
EPS (TTM): ₹463.5
Beta: 0.88 (lower volatility)
🔑 Key Levels
Support Zone: ₹16,100 – ₹16,150
Resistance Zone: ₹16,300 – ₹16,375
All-Time High: ₹16,375
📈 Strategy (1D Timeframe)
1. Bullish Scenario
Entry: Above ₹16,300
Stop-Loss: ₹16,150
Target: ₹16,500 → ₹16,600
2. Bearish Scenario
Entry: Below ₹16,100
Stop-Loss: ₹16,150
Target: ₹15,900 → ₹15,800

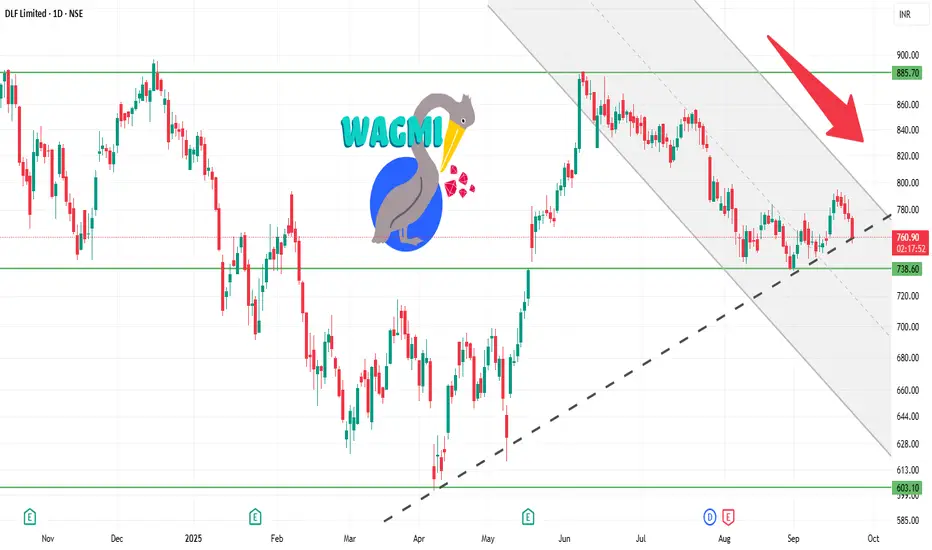
DLF 1D Time frame📍 Today’s Expected Range (Intraday Approximation)
Expected High: ₹767–₹775
Expected Low: ₹756–₹750
These are approximate intraday levels. Actual prices may fluctuate slightly due to market volatility.
🔍 Key Points
Current price: ₹760–₹761, trading near the middle of the day’s range.
If price breaks above ₹767–₹775 with strong volume → bullish momentum likely.
If price falls below ₹756–₹750 → short-term correction or pullback possible.
📊 Suggested Trading Strategy
Bullish Scenario
If DLF breaks ₹767–₹775, you can buy, targeting ₹780–₹785.
Stop-loss: ₹755
Bearish Scenario
If DLF drops below ₹756–₹750, you can sell/short, targeting ₹740–₹735.
Stop-loss: ₹760
Range-Bound / Sideways
If price trades between ₹756–₹767, it’s better to wait and avoid trading until a clear breakout occurs.
💡 Summary
Resistance Zone: ₹767–₹775
Support Zone: ₹750–₹756
Strategy: Trade in the direction of the breakout, and always use stop-loss to manage risk.
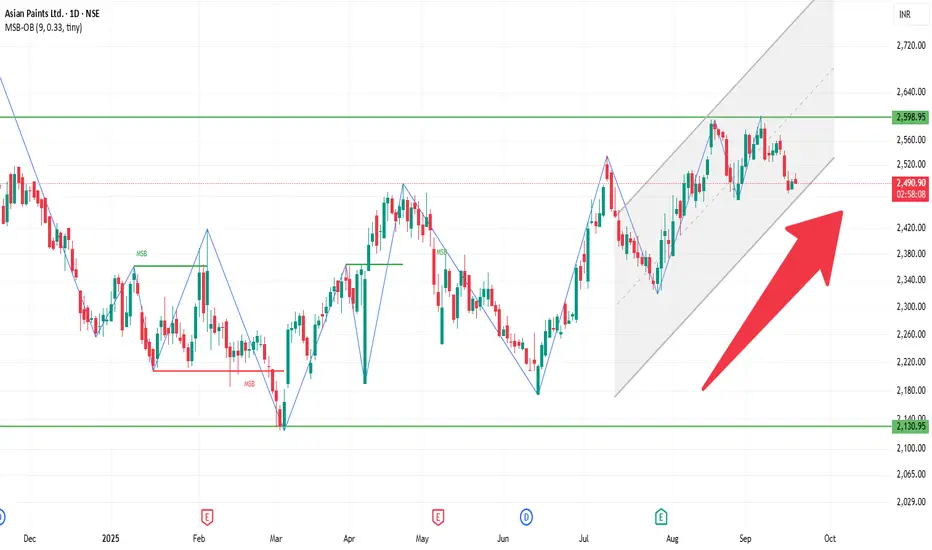
ASIANPAINT 1D Time frameCurrent View
The stock is trading around ₹2,490-₹2,500, roughly in that band.
Recent price action suggests sideways to slightly negative bias in the short term.
The stock is below many of its medium-to-long term moving averages, but above some short term ones — mixed signals.
⚙️ Indicators & Momentum
RSI is in neutral to slightly weak territory (not deeply oversold, not overbought).
MACD shows bearish pressure in recent periods.
Some oscillators & momentum tools showing mild divergence, meaning upward momentum is not strong.
Short-term moving averages are giving mixed signals: some support, some resistance.
📌 Key Levels to Watch
Resistance Zones: ~ ₹2,520-₹2,550 is a resistance range.
Support Zones: ~ ₹2,450-₹2,470 nearer support. More substantial support around ₹2,400-₹2,430.
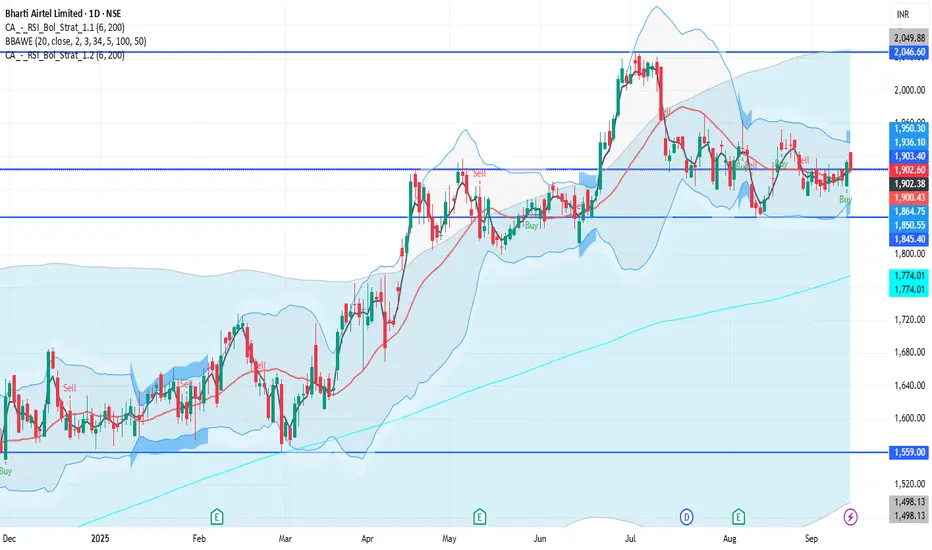
BHARTIARTL 1D Time frameCurrent Price & Trend
Price: ₹1,902.60
Trend: Neutral to mildly bullish; trading approximately 6.9% below its 52-week high of ₹2,045.50, achieved on July 2, 2025.
Momentum: Indicators suggest a neutral to slightly bullish outlook.
Bullish Scenario
Breakout Above ₹1,930: A sustained move above ₹1,930 could target ₹1,950 – ₹1,960 in the short term.
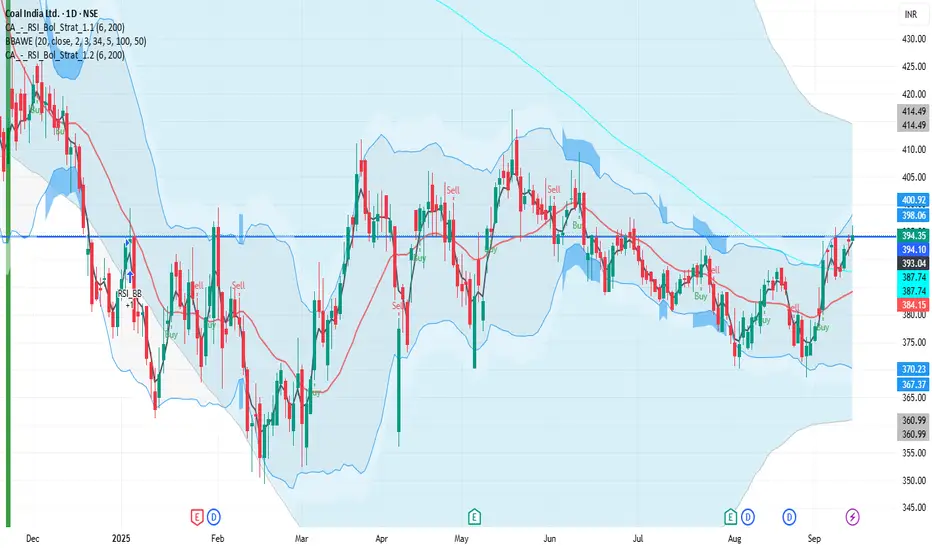
COALINDIA 1D Time frame📉 Current Market Snapshot
Current Price: ₹394.35
Previous Close: ₹391.90
Day's Range: ₹390.45 – ₹396.00
52-Week Range: ₹349.20 – ₹517.85
Market Cap: ₹2.42 lakh crore
P/E Ratio: 7.3
Dividend Yield: 6.72%
EPS (TTM): ₹53.78
ROE: 48.7%
Debt-to-Equity Ratio: 0.00
Beta: 1.01
RSI: 61.69
MACD Signal: 1.12
MFI: 71.75
ATR (14): ₹5.72
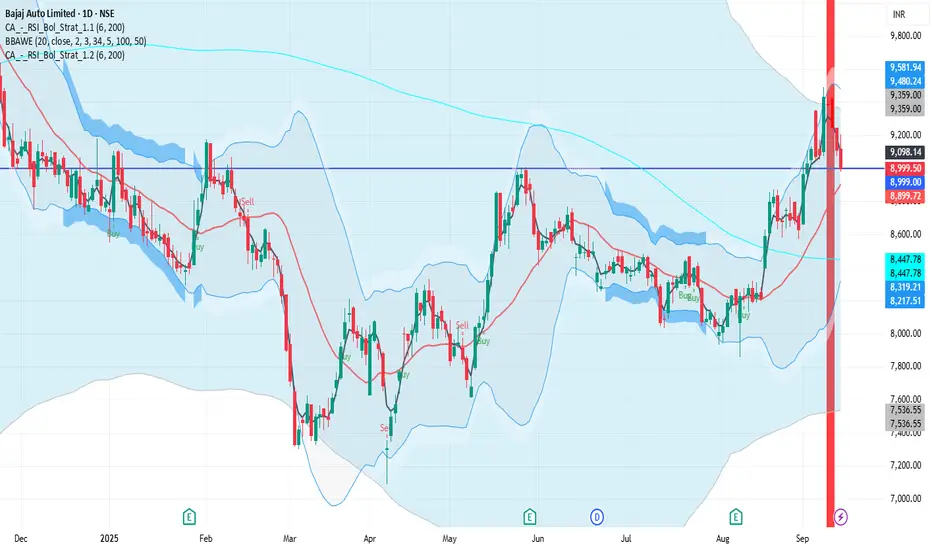
BAJAJ_AUTO 1D Time frame📉 Current Market Snapshot
Previous Close: ₹9,113.50
Today's Range: ₹8,979.50 – ₹9,205.00
Current Price: ₹8,999.50
Market Cap: ₹2,51,318 crore
P/E Ratio: 33.1
Dividend Yield: 2.33%
52-Week High: ₹12,774
52-Week Low: ₹7,089.35
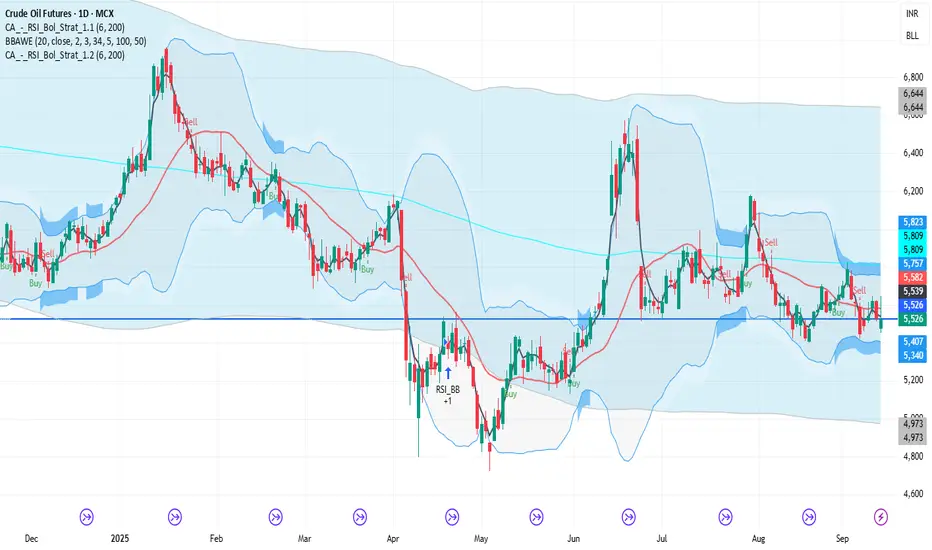
CRUDEOIL1! 1D Time frame📉 Current Market Snapshot (as of September 13, 2025)
Previous Close: ₹5,526
Day's Range: ₹5,454 – ₹5,647
Open: ₹5,480
Close: ₹5,530
📊 Key Levels
Support: ₹5,495, ₹5,442
Resistance: ₹5,663, ₹5,800, ₹5,865
NATURALGAS1! 1D Time frame📍 Current Price
₹261
🔑 Key Levels
Immediate Resistance: ₹268 → ₹272
Immediate Support: ₹257 → ₹253
52-Week High: ₹366
52-Week Low: ₹188
Short-Term Outlook
Bullish Scenario: Sustained above ₹272 → possible move toward ₹280–₹285
Bearish Scenario: Falls below ₹257 → may test ₹253–₹250

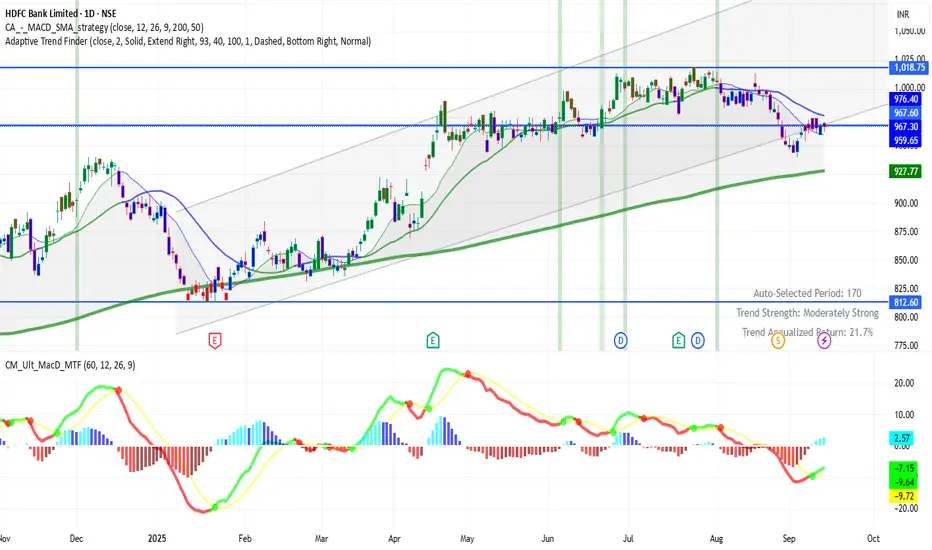
HDFCBANK 1D Time frame📊 Current Status
Price around ₹967
Trading near resistance zone
🔑 Key Levels
Support: ₹960 → ₹950
Resistance: ₹970 → ₹975
✅ Outlook
If price sustains above ₹975, further upside possible. Falling below ₹950 may bring weakness or sideways movement.
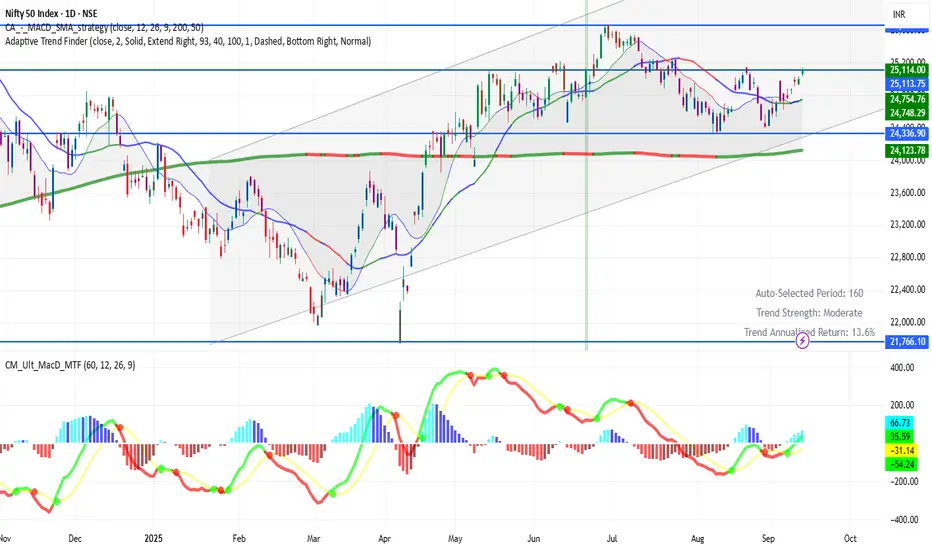
NIFTY (1D timeframe)📍 Current Level
Trading around 25,114
🔑 Key Levels
Immediate Resistance: 25,150 → 25,200
Immediate Support: 25,000 → 24,950
Deeper Support: 24,800 → 24,600
✅ Outlook
If Nifty sustains above 25,150–25,200, more upside can open up.
If it slips below 24,950–25,000, weakness may extend toward 24,800–24,600.
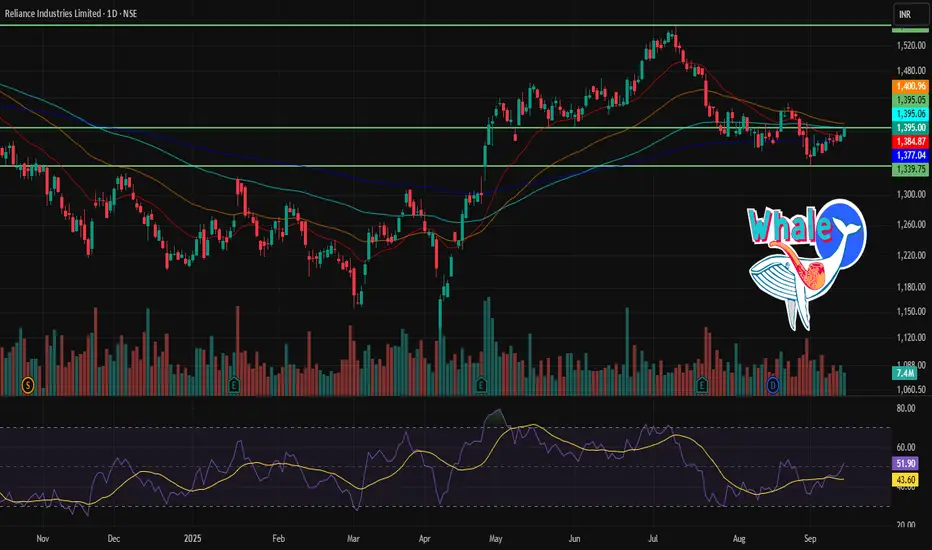
RELIANCE 1D Time frame🔢 Current Level
Trading around ₹1,395
🔑 Key Resistance & Support Levels
Resistance Zones:
~ ₹1,400 – ₹1,410 (near-term resistance)
~ ₹1,420 – ₹1,430 (stronger resistance above)
Support Zones:
~ ₹1,380 – ₹1,370 (first support)
~ ₹1,360 – ₹1,350 (secondary support)
📉 Outlook
Bullish Scenario: Holding above ₹1,400 could push price toward ₹1,420 – ₹1,430.
Bearish Scenario: A fall below ₹1,370 may drag it toward ₹1,350 or lower.
Neutral / Range: Likely to trade between ₹1,370 – ₹1,420 until a breakout or breakdown occurs.
SENSEX 1D Time frame🔢 Current Level
Trading near ₹81,905
🔑 Key Resistance & Support Levels
Resistance Zones:
~ ₹82,150 – ₹82,400 (immediate resistance)
~ ₹82,800 – ₹83,000 (higher resistance above)
Support Zones:
~ ₹81,600 – ₹81,500 (first support)
~ ₹81,200 – ₹81,300 (secondary support)
~ ₹80,800 – ₹80,900 (deeper support if selling continues)
📉 Outlook
Bullish Scenario: Sustaining above ₹81,600 and breaking ₹82,150+ may fuel an up-move toward ₹82,800+.
Bearish Scenario: A break below ₹81,300 may invite weakness toward ₹80,900 or lower.
Neutral / Range: Likely to consolidate between ₹81,500 – ₹82,400 until a decisive move.

HDFCBANK 1D Time frame🔢 Current Level
Trading around ₹966 – ₹968
🔑 Key Support & Resistance Levels
Resistance Zones:
~ ₹973 – ₹975 (near-term resistance)
~ ₹980 – ₹985 (stronger resistance if price crosses above the earlier zone)
Support Zones:
~ ₹962 – ₹960 (immediate support)
~ ₹955 – ₹953 (lower support if downward pressure continues)
📉 Outlook
Bullish Scenario: Holding above ₹960-₹962 may push price toward ₹973-₹975, and a breakout above that can lead to ₹980-₹985.
Bearish Scenario: Falling below ₹955 may increase downside risk toward deeper supports.
Neutral / Range Zone: Between ₹960-₹975, likely sideways consolidation until a breakout happens.