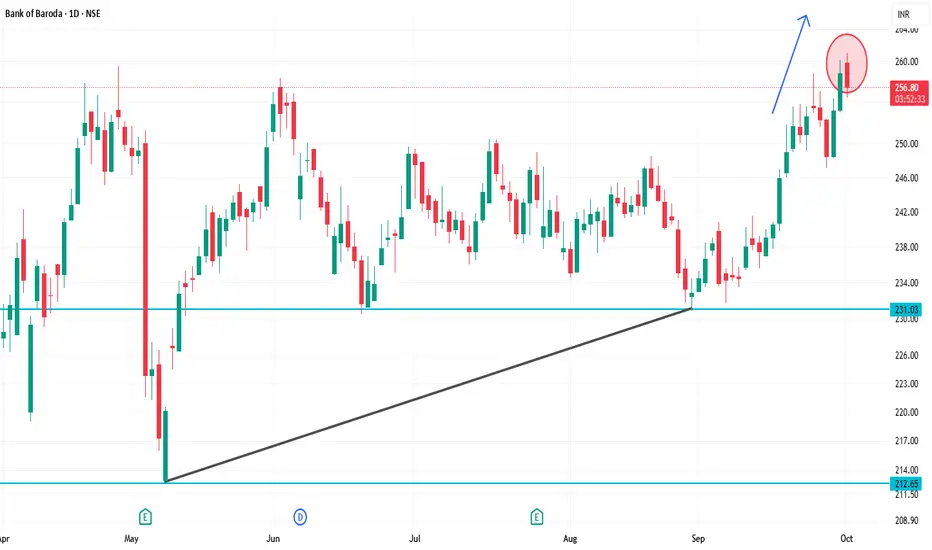
BANKBARODA 1D Time frameClosing Price: ₹257.60
Day Range: ₹253.70 – ₹260.00
Previous Close: ₹258.54
📉 Trend Analysis
Short-Term Trend: Bearish — The stock is trading below key moving averages, confirming the bearish trend.
Medium-Term Trend: Neutral — The stock is in a consolidation phase, characterized by lower highs and lower lows.
Long-Term Trend: Neutral — No significant trend identified; the stock is trading within a range.
🔮 Conclusion
Bank of Baroda is in a bearish trend with weak momentum.
Break below ₹250.00 could lead to further decline toward ₹245.00.
Break above ₹265.00 would indicate a potential trend reversal.
JLL
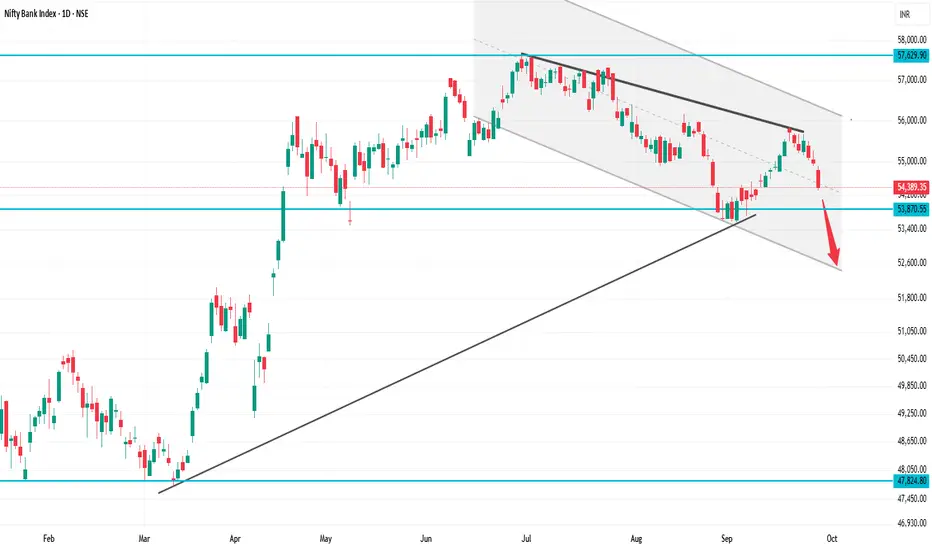
BANKNIFTY 1D Time frame
Previous Close: 55,121
Today Open: 55,061
Day’s High: 55,276
Day’s Low / Last: 54,389
⚡ Strategy
For Intraday / Short-Term Traders:
If BankNIFTY holds above 54,400 – 54,500, a small bounce toward 54,800 – 55,000 is possible.
If it fails to hold 54,400, expect more downside toward 54,000 – 53,800.
Bullish View (Only if recovery): Buy above 54,800 for targets 55,100 – 55,250, SL below 54,500.
Bearish View (Preferred): Sell on rise near 54,700 – 54,900 with SL above 55,000, targets 54,300 → 54,000.
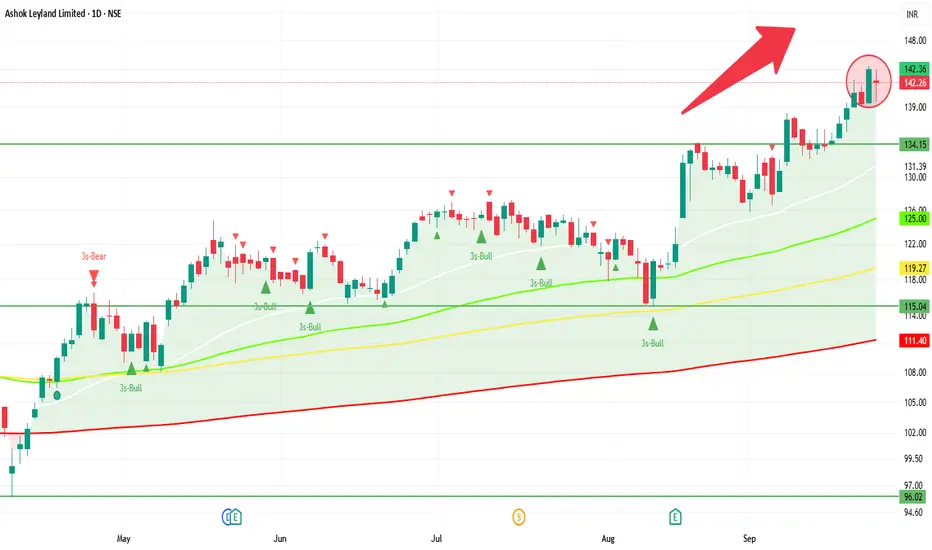
ASHOKLEY 1D Time frame📊 Today's Performance
Closing Price: ₹142.26
Day’s Range: ₹139.60 – ₹143.99
Previous Close: ₹144.04
Change: Down ~ –1.24%
52-Week Range: ₹95.93 – ₹144.50
Volume: ~36.96 million shares
Market Cap: ₹83,556 crore
P/E Ratio: 26.05
Dividend Yield: 4.39%
EPS (TTM): ₹5.46
🔍 Key Technical Levels
Support Zone: ₹139.60 – ₹140.00
Resistance Zone: ₹143.50 – ₹144.50
All-Time High: ₹144.50
📈 Strategy (1D Timeframe)
1. Bullish Scenario
Entry: Above ₹143.50
Stop-Loss: ₹141.50
Target: ₹146.00 – ₹148.00
2. Bearish Scenario
Entry: Below ₹139.60
Stop-Loss: ₹141.50
Target: ₹136.00 – ₹134.00
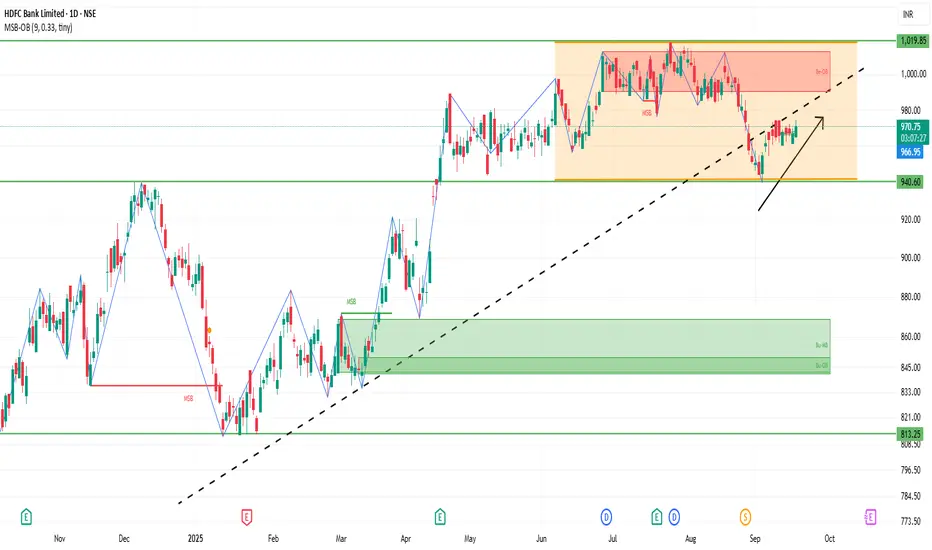
HDFCBANK 1D Time frame📍 Current Price & Range
Current price: ₹964.20
Day’s High / Low: ₹968.20 / ₹955.50
52-week High / Low: ₹1,018.85 / ₹806.50
🔍 Key Levels (with current context)
Immediate support: ₹955-₹958
Stronger support: ₹945-₹950
Immediate resistance: ₹970-₹975
Next resistance: ₹980-₹985
Major psychological resistance: ₹1,000+
📊 Indicators & Momentum
Price is near resistance zone (₹964-₹967), showing hesitation.
Holding above ₹955 is important for stability.
Price is below the 50-day moving average → short-term weakness.
Still above the 200-day moving average → long-term structure remains intact.
RSI around 40-45 → momentum is neutral to slightly weak.
🔮 Possible Scenarios
Bullish breakout: Above ₹975-₹980 with volume → upside toward ₹1,000–₹1,018.
Sideways: Between ₹955–₹975 until a decisive breakout.
Bearish pullback: Below ₹955 → could slide toward ₹945-₹950 or even ₹940.
👉 Outlook: At the current level (₹964), the stock is sitting close to resistance. It needs strength above ₹975 to turn bullish; otherwise, it risks drifting back toward ₹955 support.

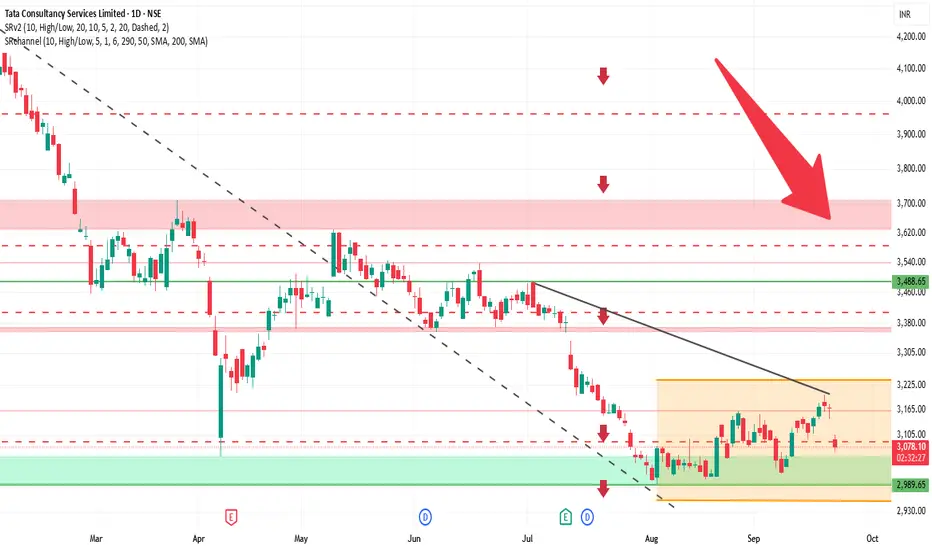
TCS 1D Time frame🔍 Current Price & Context
Trading around ₹3,089
Day’s range: ₹3,065 – ₹3,107
Previous close: ₹3,171
Market sentiment: Bearish, influenced by external factors affecting IT stocks.
📊 Technical Indicators
Moving Averages: Short-term averages are slightly above current price, acting as resistance.
RSI (14): ~30, indicating oversold conditions.
MACD: Negative, showing bearish momentum.
Stochastic Oscillator: Oversold, may suggest a short-term reversal.
CCI (20): Below zero, confirming bearish trend.
ROC (20): Negative, indicating declining momentum.
🧮 Strategy / Trade Ideas
Long Setup:
Entry near support (~3,050) if bullish reversal appears
Stop Loss: Below 3,000
Targets: 3,100 first, then 3,150
Short / Pullback Setup:
Entry if price fails near resistance (~3,100)
Stop Loss: Above 3,150
Targets: 3,050 first, then 3,000
✅ Summary
TCS on daily chart is bearish but oversold. Watch immediate support (~3,050) for potential reversal, and resistance (~3,100 – 3,120) for pullback risk. A breakout above resistance could target 3,150+, while failure of support may lead toward 3,000.
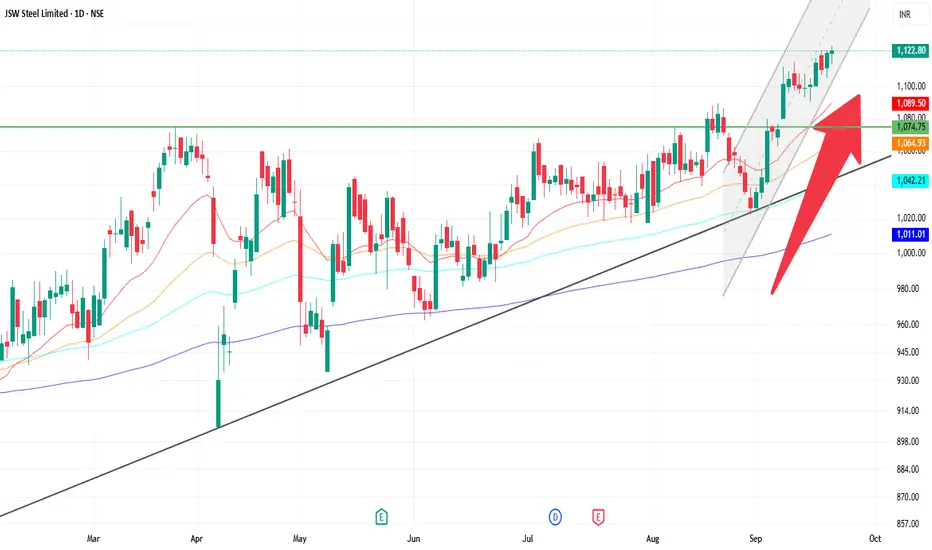
JSWSTEEL 1D Time frame📊 Current Overview
Current Price: Around ₹1,122 – ₹1,123
Recently touched 52-week high levels.
Trend is overall bullish with strong momentum.
🔍 Support & Resistance
Immediate Support: ₹1,110 – ₹1,100
Next Support: ₹1,085
Immediate Resistance: ₹1,125 – ₹1,130
Next Resistance: ₹1,140+
📈 Indicators
Moving Averages (5, 10, 20, 50, 100, 200): All pointing bullish, price is trading above them.
RSI (14): Around 67, showing strong momentum but close to overbought zone.
MACD & ADX: Both suggest continuation of uptrend.
🎯 Possible Scenarios
Bullish Side: A breakout above ₹1,130 can push towards ₹1,140 – ₹1,150.
Bearish Side: If price rejects at resistance, it may pull back to ₹1,110, and deeper towards ₹1,085.
SENSEX 1D Time frameCurrent Trend: Still sideways to mildly bullish, but trading closer to support levels.
Support Zone: Now the strong support shifts to 82,300 – 82,500. If this zone holds, bounce is possible.
Resistance Zone: On the upside, watch 83,200 – 83,500 for resistance. Breakout above this can push price higher.
Indicators: Daily candle suggests consolidation; buyers defending 82,300 zone.
Outlook:
Above 83,500 → fresh bullish momentum likely.
Below 82,300 → weakness can extend further.
👉 In short (based on 82,626 level):
Range: 82,300 – 83,500.
Market neutral, waiting for breakout either side.

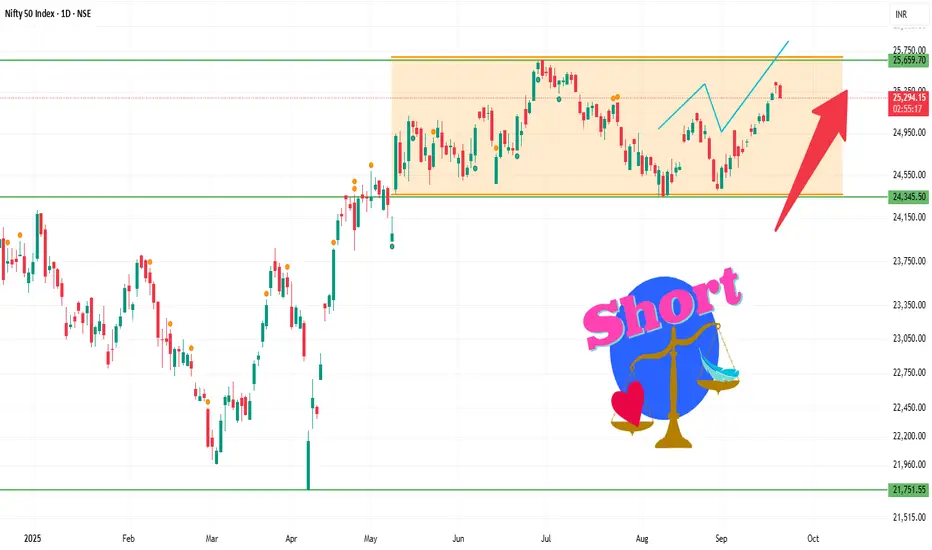
Nifty 1D Time frameCurrent Facts
Current Level: ~25,300–25,310
Trend: Mildly bullish; Nifty is trading above short-term moving averages (20-day & 50-day EMA).
Momentum Indicators:
RSI (14-day): ~60 → positive but not overbought.
MACD: Positive → supports short-term bullish bias.
Price Action: Daily candles show small upper wicks → slight profit-booking near resistance levels.
⚙️ Outlook
Bullish Scenario:
Holding above 25,270 → retest 25,350–25,370 and possibly 25,420–25,450.
Range / Consolidation:
Price oscillates between 25,270 – 25,350 → sideways action expected.
Bearish Scenario:
Close below 25,250 → downside risk toward 25,180–25,200 or lower.
⚠️ Facts
25,300–25,310 acts as a short-term pivot — above it favors bulls, below it favors bears.
Immediate resistance is at 25,350–25,370; breakout here can trigger upside momentum.
Support at 25,250 is crucial; failure to hold may result in deeper correction.
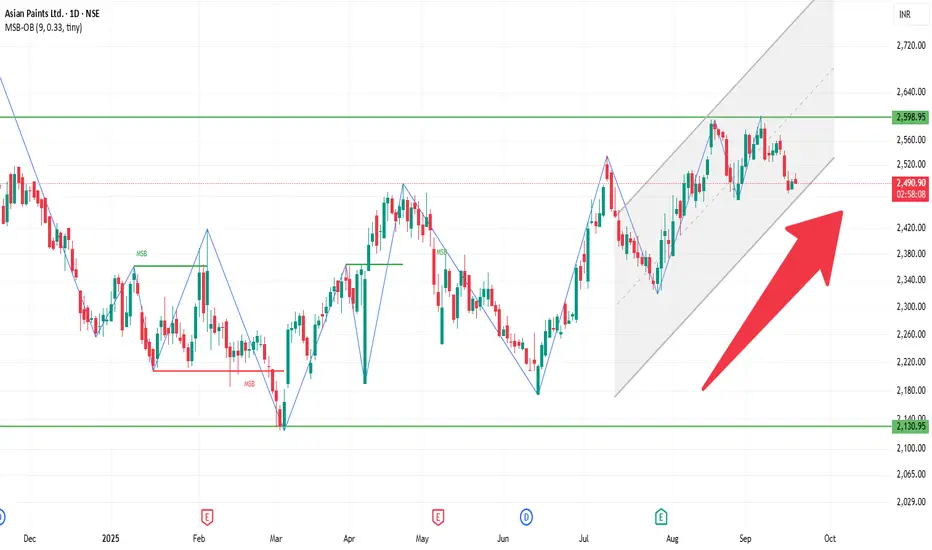
ASIANPAINT 1D Time frameCurrent View
The stock is trading around ₹2,490-₹2,500, roughly in that band.
Recent price action suggests sideways to slightly negative bias in the short term.
The stock is below many of its medium-to-long term moving averages, but above some short term ones — mixed signals.
⚙️ Indicators & Momentum
RSI is in neutral to slightly weak territory (not deeply oversold, not overbought).
MACD shows bearish pressure in recent periods.
Some oscillators & momentum tools showing mild divergence, meaning upward momentum is not strong.
Short-term moving averages are giving mixed signals: some support, some resistance.
📌 Key Levels to Watch
Resistance Zones: ~ ₹2,520-₹2,550 is a resistance range.
Support Zones: ~ ₹2,450-₹2,470 nearer support. More substantial support around ₹2,400-₹2,430.
HDFCBANK 1D Time frameCurrent Stock Price
Current Price: ₹966.85
Day’s Range: ₹965.15 – ₹974.40
52-Week Range: ₹806.50 – ₹1,018.85
Market Cap: ₹14.88 lakh crore
P/E Ratio: 21.03
EPS (TTM): ₹45.97
Dividend Yield: 1.13%
Book Value: ₹339.84
📈 Trend & Outlook
Short-Term Trend: Mildly bullish; stock showing positive movement in recent sessions.
Resistance Levels: ₹974.40 (day’s high), ₹1,018.85 (52-week high).
Support Levels: ₹965.15 (day’s low), ₹950.00 (recent low).
Investor Sentiment: Positive, supported by institutional buying and favorable outlook.
🧭 Key Notes
Stock has room to move higher if it breaks near-term resistance.
If it falls below support, downside may extend to ₹950 or lower.
Overall, bulls are slightly stronger, but watch resistance for profit booking.
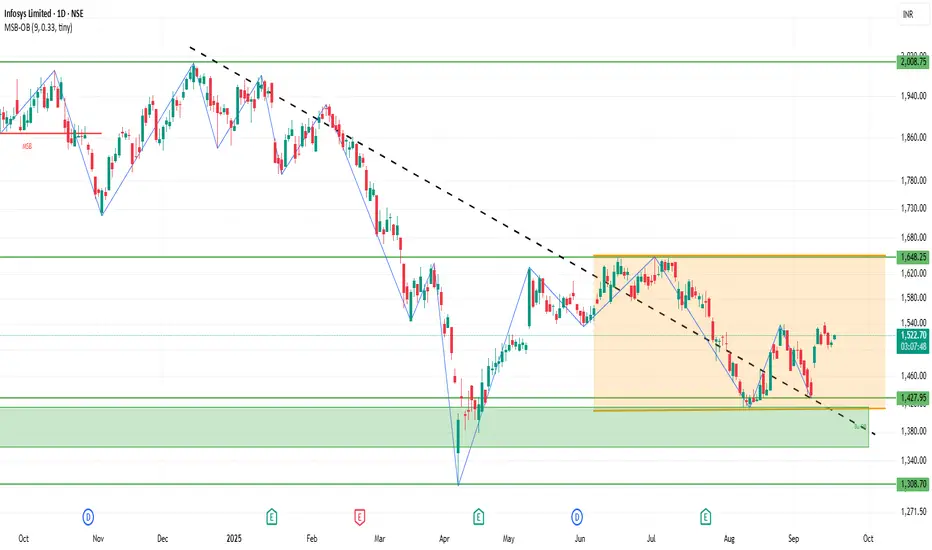
INFY 1D Time frameCurrent Stock Price
Current Price: ₹1,525.60
Day’s Range: ₹1,521.10 – ₹1,542.90
52-Week Range: ₹1,307.00 – ₹2,006.45
Market Cap: ₹6.33 lakh crore
P/E Ratio (TTM): 23.0
EPS (TTM): ₹65.63
Dividend Yield: 2.82%
Book Value: ₹230.65
📈 Trend & Outlook
Short-Term Trend: Bullish; the stock is trading near its 52-week high, indicating strong investor confidence.
Resistance Levels: ₹1,542.90 (day’s high), ₹2,006.45 (52-week high).
Support Levels: ₹1,521.10 (day’s low), ₹1,500.00 (psychological support).
Investor Sentiment: Positive, with strong institutional interest and favorable analyst outlooks.
🧭 Analyst Insights
Valuation: The stock is trading at a P/E ratio of 23.0, which is below the sector average of 28.56, suggesting potential value.
Growth Prospects: The company’s strong earnings growth and robust capital position support its premium valuation.
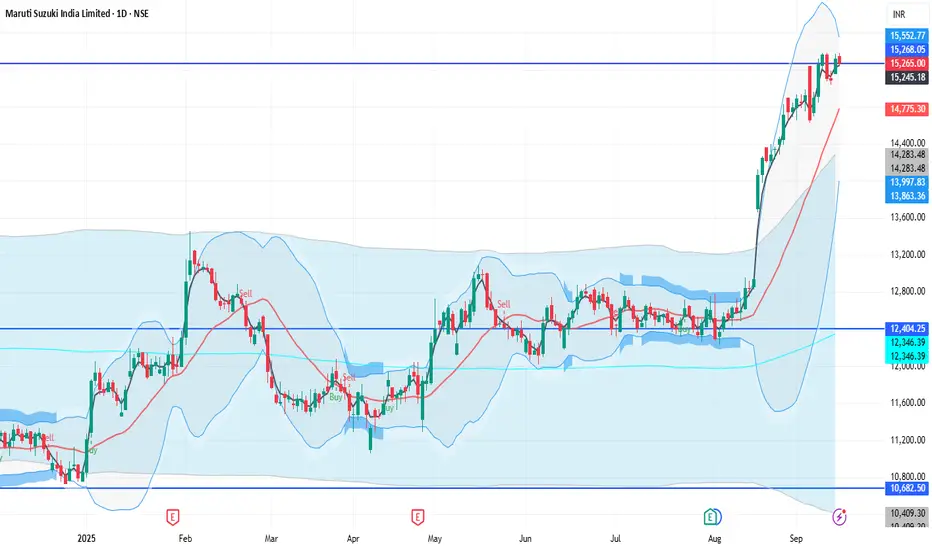
MARUTI 1D Time frame📊 Price Levels
Current Price: Around ₹15,265
Day’s High: ~₹15,378
Day’s Low: ~₹15,249
52-Week High: ~₹15,384
52-Week Low: ~₹10,725
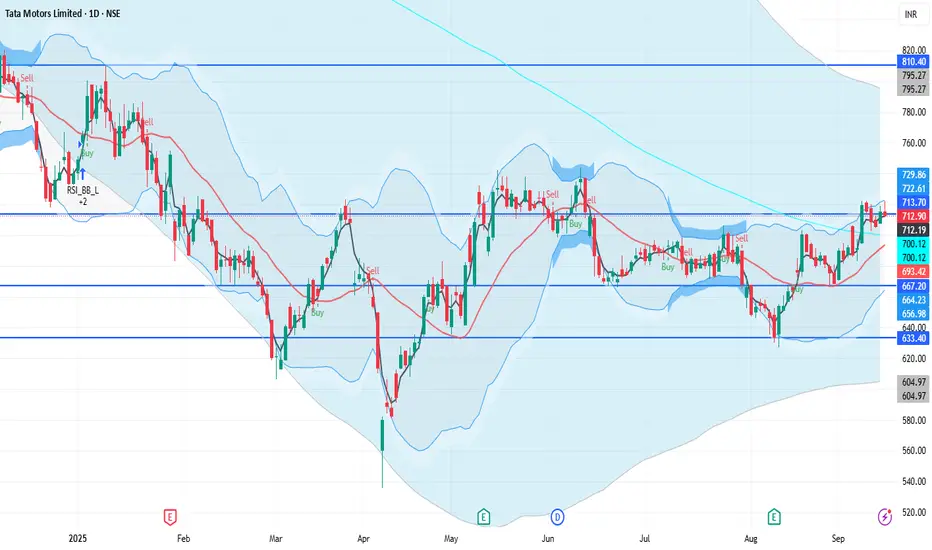
TATAMOTORS 1D Time frameUpdated Snapshot
Current Price: ₹712 – ₹715
Day’s Range: ₹712 – ₹721.95
Previous Close: ₹705.85
🔹 Support & Resistance
Support 1: ₹710 – ₹708
Support 2: ₹700 – ₹705
Resistance 1: ₹721 – ₹725
Resistance 2: ₹735 – ₹740
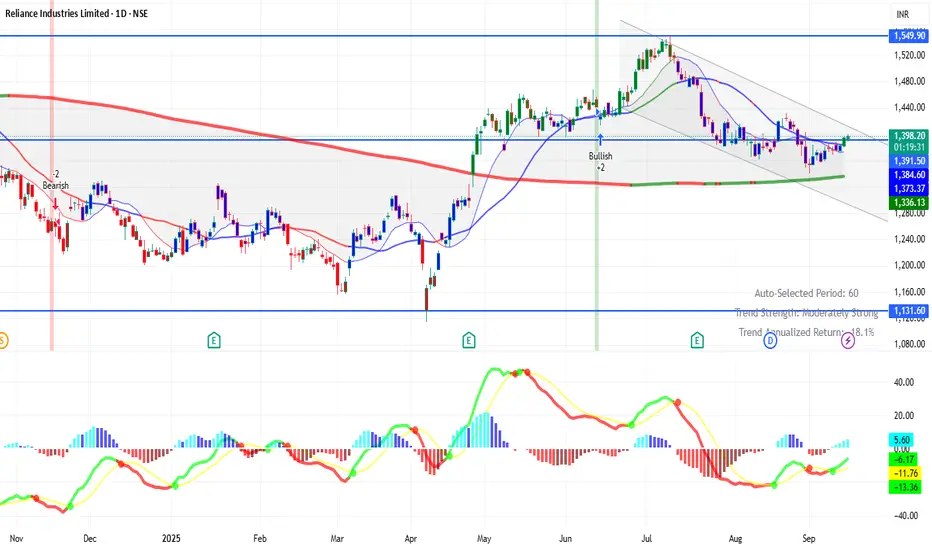
RELIANCE 1D Time framePrice Action
Current Price: ₹1,392 – ₹1,395 (approx)
Previous Close: ₹1,383.50
52-Week Range: ₹1,114.85 – ₹1,551.00
🔹 Support & Resistance
Immediate Support: ₹1,385 – ₹1,375
Next Support: ₹1,369
Immediate Resistance: ₹1,400 – ₹1,406
Next Resistance: ₹1,417
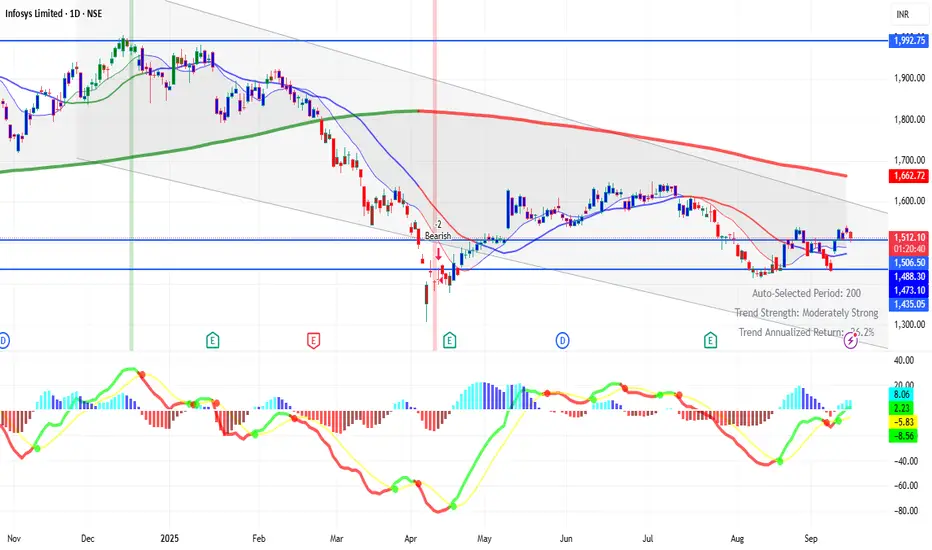
INFY 1D Time frameCurrent Price: ₹1507 (approx)
Day’s Range: ₹1507 – ₹1543
Previous Close: ₹1509.10
🔹 Support & Resistance
Support 1: ₹1500
Support 2: ₹1490 – ₹1470
Resistance 1: ₹1539 – ₹1552
Resistance 2: ₹1560 – ₹1570
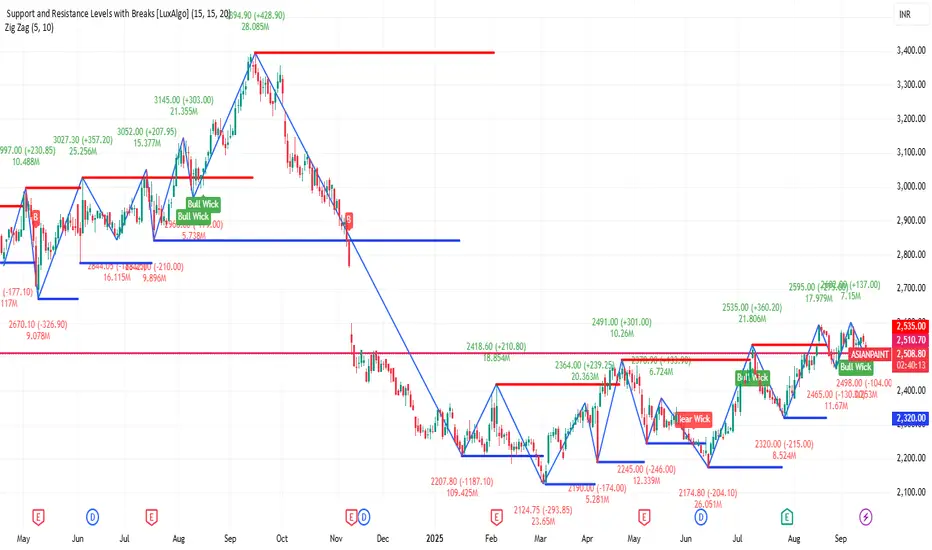
ASIANPAINT 1D Time frameToday's Trading Range:
Day's Range: ₹2,498.00 – ₹2,543.50
Opening Price: ₹2,535.10
Previous Close: ₹2,540.50
52-Week Range: ₹2,124.75 – ₹3,394.90
📈 Circuit Limits:
Upper Circuit Limit: ₹2,800.90
Lower Circuit Limit: ₹2,291.70
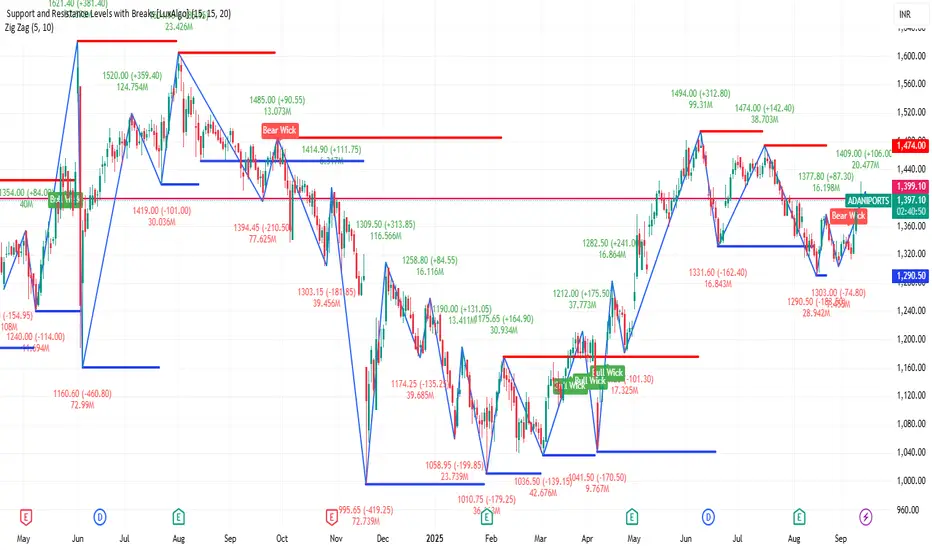
ADANIPORTS 1D Time frameUpdated Snapshot
Current Price: ₹1,399
Day’s Range: ₹1,391 – ₹1,406.50
Previous Close: ₹1,393.10
🔹 Support & Resistance
Support 1: ₹1,391 – ₹1,385
Support 2: ₹1,370 – ₹1,360
Resistance 1: ₹1,406 – ₹1,410
Resistance 2: ₹1,420 – ₹1,430
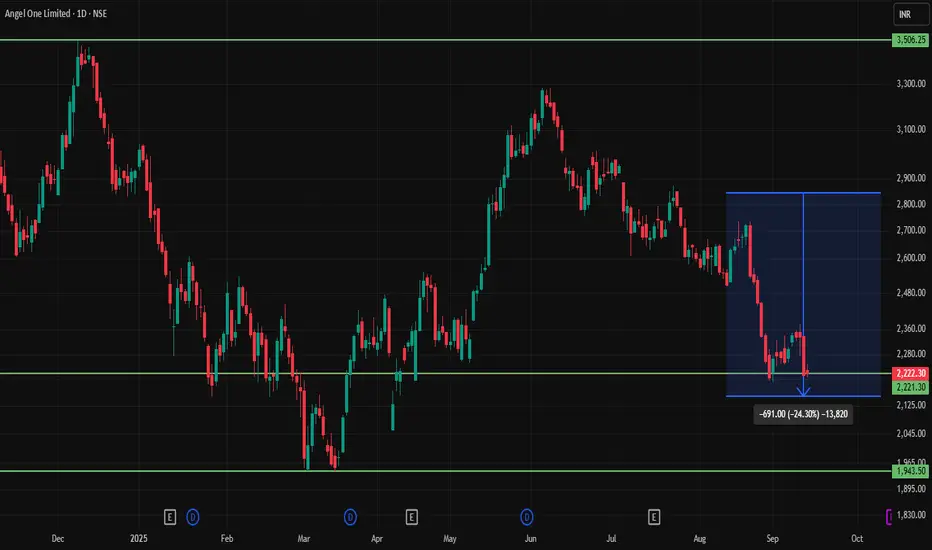
ANGELONE 1D Time frameCurrent Price & Trend
Current Level: ₹2,222
Trend: Neutral to weak → stock is under pressure, trading below many key moving averages.
Momentum: Lacks strong buying interest; near lower-mid range of recent price action.
Indicators
RSI: Around 40–45 → closer to oversold but still in neutral zone.
MACD: Bearish crossover → signals continued weakness.
Moving Averages: Price is below 20- & 50-day averages → selling pressure still present.
✅ Bullish Scenario
If price sustains above 2,250, it can move toward 2,350 – 2,400.
Breakout above 2,400 would indicate a stronger reversal.
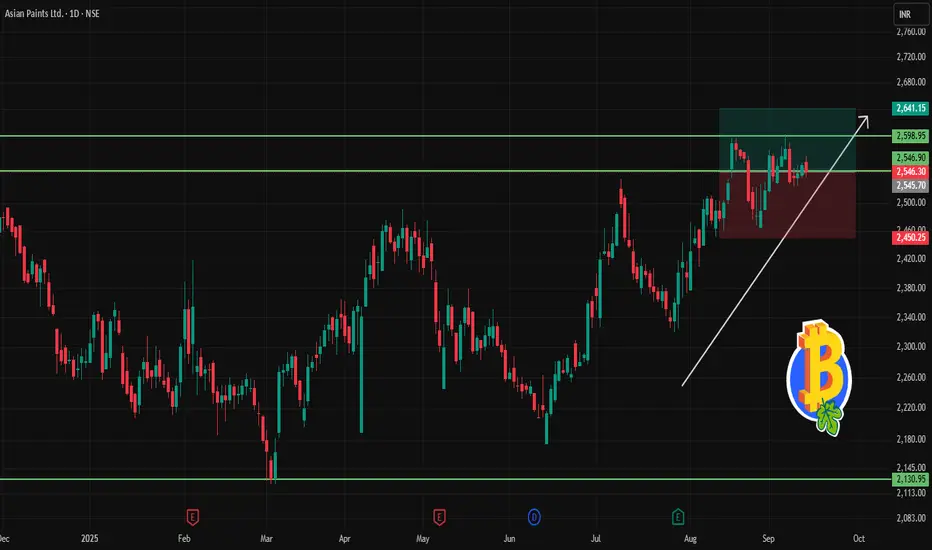
ASIANPAINT 1D Time frameCurrent Status
Price: ~ ₹2,546
It is well below its 52-week high (~₹3,394) and above its 52-week low (~₹2,125)
Market capitalization is large; the stock is considered a large-cap, stable name in decorative paints
Key Metrics
P/E (TTM) is high (≈ 67-70) → indicates expensive valuation relative to earnings
P/B is also elevated (≈ 12-13)
Return on Equity (ROE) ~ 18-20% — reasonable, not exceptional but solid
Bullish Scenario
If Asian Paints can reclaim and hold above ~₹2,550-₹2,600, it may move toward retesting higher resistance levels around ~₹2,750-₹3,000
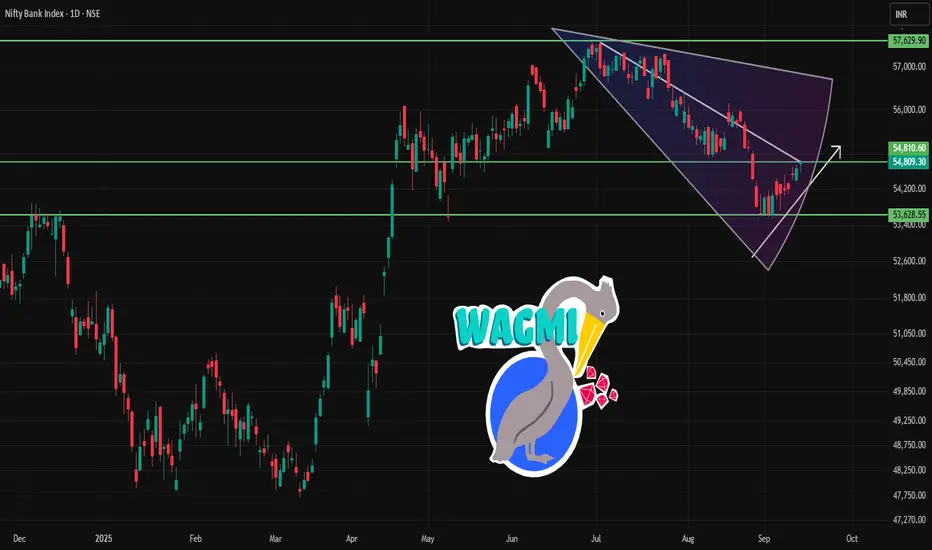
BANKNIFTY 1D Time frameCurrent Price & Trend
Current Level: 54,809
Trend: Neutral to mildly bullish
Range Context: Close to resistance zone, so movement here is crucial
Bullish Case
If Bank Nifty closes above 55,000–55,200, it can rally toward 55,500–55,700.
Sustained buying could push further toward 57,000 in coming sessions.