JSWENERGY Quarterly Breakout#jswenergy Strong Breakout and Sustaining strongly on Quarterly Chart.
Good to Hold for Swing, Short and Long-term #Investment.
Strong on Technical's.
Charts never Disappoint me !
JSWENERGY

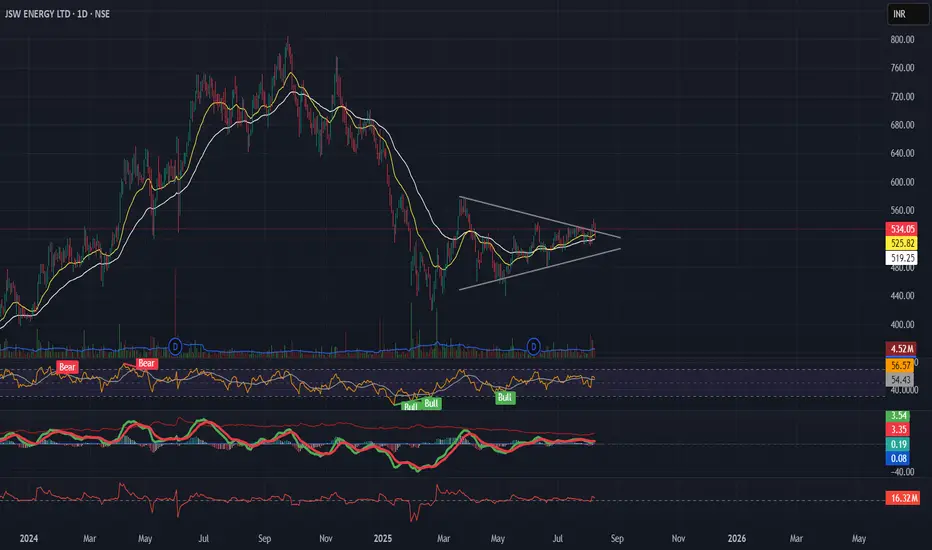
JSWENERGY | Symmetrical Triangle Breakout in Progress?Description:
JSW Energy is forming a symmetrical triangle on the daily chart after a downtrend — resembling a potential bearish pennant, but price structure, sloping EMAs, rising momentum, and positive EFI hint at bullish strength.
📌 Breakout Level: ₹534
📉 Stoploss: ₹519 (ATR-based)
🎯 Targets: ₹563 → ₹597 → ₹694 (as per Fib projections)
🧭 Macro Context:
- Infra & Energy sectors improving
- Govt push for renewables
- Dollar weakening, risk-on tone aiding sentiment
Structure, volume, and macro are aligned — tracking this breakout closely.
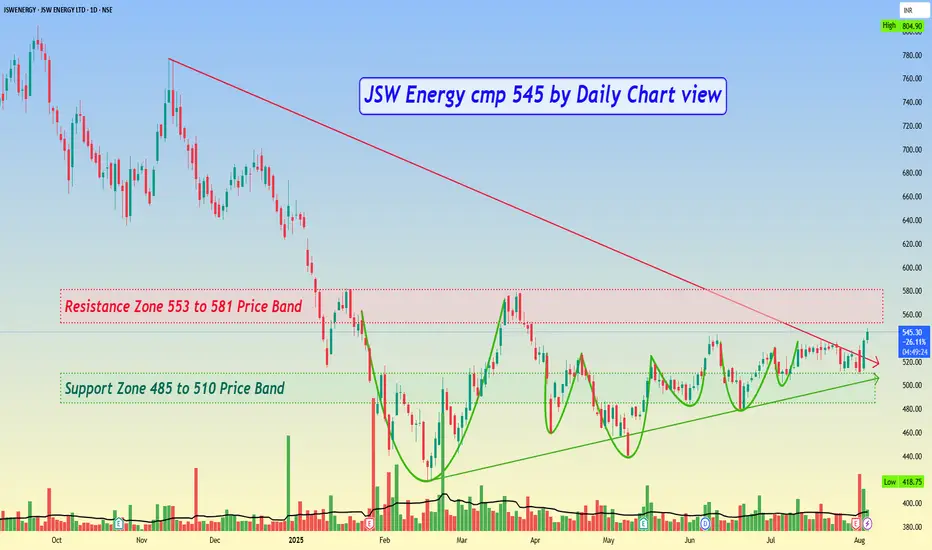
JSW Energy cmp 545 by Daily Chart viewJSW Energy cmp 545 by Daily Chart view
- Support Zone 485 to 510 Price Band
- Resistance Zone 553 to 581 Price Band
- Falling Resistance Trendline Breakout has well sustained
- Rising Support Trendline well respected by upwards Price Momentum
- Multiple Bullish Rounding Bottoms plus considerate VCP pattern too, as viewed individually
JSW ENERGY - SwingJSW Energy is transitioning aggressively toward renewables, with investments in solar, wind, energy storage, and green hydrogen.
P/E ratio stands at 46.36, indicating a premium valuation compared to the sector average of 32. While growth is underwhelming, the company maintains good asset quality. Debt levels are manageable, and promoter holding remains strong.
The stock recently showed consolidation between 510 - 530, with support near ₹500 and strong resistance around 540. Technical indicators suggest a bullish bias, with MACD showing early signs of upward momentum. Traders may consider swing opportunities if the stock breaks above ₹542 with volume confirmation.

JSW Energy : Energy Stock Heating Up — Watch This Level!NSE:JSWENERGY
🧩 JSW Energy Ltd – Integrated Analysis (Technical + Fundamental)
🔍 1. Chart Technical Analysis
============================
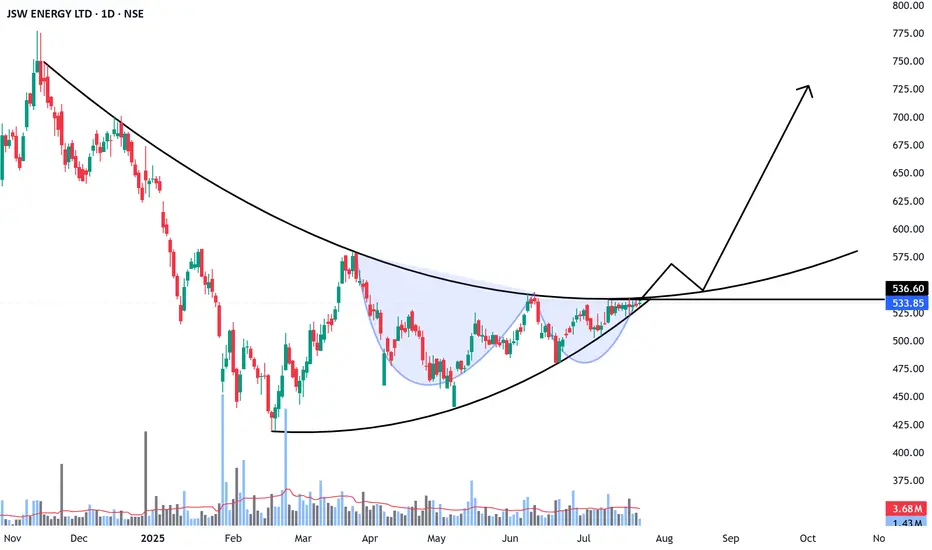
✅ Cup and Handle Breakout in Progress
Pattern: Classic Cup and Handle visible on the daily chart.
Neckline: ₹536.60 — price is at ₹533.85, very close to breakout.
Cup base: ~₹440, Top: ~₹640 ⇒ Cup depth: ₹200
Measured Target: ₹537 + ₹200 = ₹735
🔼 Price Action & Momentum
Higher lows forming in handle → Sign of accumulation.
Volume contracting in the handle → textbook setup.
A breakout with strong volume can trigger sharp upward momentum.
📉 Indicators (Daily Timeframe)
RSI (14) ~58 Bullish, not overbought
MACD Crossover possible Upside momentum brewing
20/50/200 EMA Price trading above all Strong uptrend confirmation
Volume Contracted Perfect setup for breakout
==========================
🧠 2. Fundamental Analysis
==========================
💰 Q4 FY25 Snapshot
Net Profit: ₹408 Cr (YoY +16%)
Revenue: ₹3,189 Cr (YoY +16%)
Fundraising Plan: ₹10,000 Cr approved for green capacity expansion
🔋 Business Strength
Installed Capacity: 8,400+ MW
Diversified portfolio: Thermal, Hydro, Wind, Solar
Acquired: 4,700 MW renewable platform
On track to hit 20 GW by 2030
📊 Financial Metrics
P/E Ratio ~45–70x Slightly overvalued
ROE 8–11% Healthy
Operating Margin ~33% Efficient operations
Dividend Yield ~0.3–0.4% Low, due to reinvestment
Promoter Holding ~69% Strong promoter confidence
🌱 Growth Catalysts
Rising power demand (especially during heatwaves)
Government push for green hydrogen, energy storage
ESG-focused investors: recently added to ESG index
🧾 Final Takeaway –
Why JSW Energy Looks Attractive Now?
📈 Technical Setup : Cup & handle near breakout
💰 Earnings Growth : 16% profit, 16% revenue YoY
🌱 Renewable Push : Target 20GW by 2030
📊 Valuation : Slightly premium, justified
🔍 Volume Pattern : Accumulation confirmed
📌 Summary
JSW Energy is showing strong technical and fundamental convergence:
Technical: Breakout-level Cup & Handle + EMAs + RSI/MACD momentum
Fundamental: Rising profits, capacity expansion, green energy positioning
✅ Best viewed as a medium-to-long-term breakout play
🔐 Stop-loss discipline is very important for risk control
=====================================================
⚠️ Disclaimer:
This analysis is for educational and informational purposes only.
We are not SEBI-registered analysts or advisors.
This is our personal view based on available data and market trends.
Please consult your SEBI-registered investment advisor before making any investment or trading decisions.
You are solely responsible for any financial decisions you make based on this content.
========================
Trade Secrets By Pratik
========================
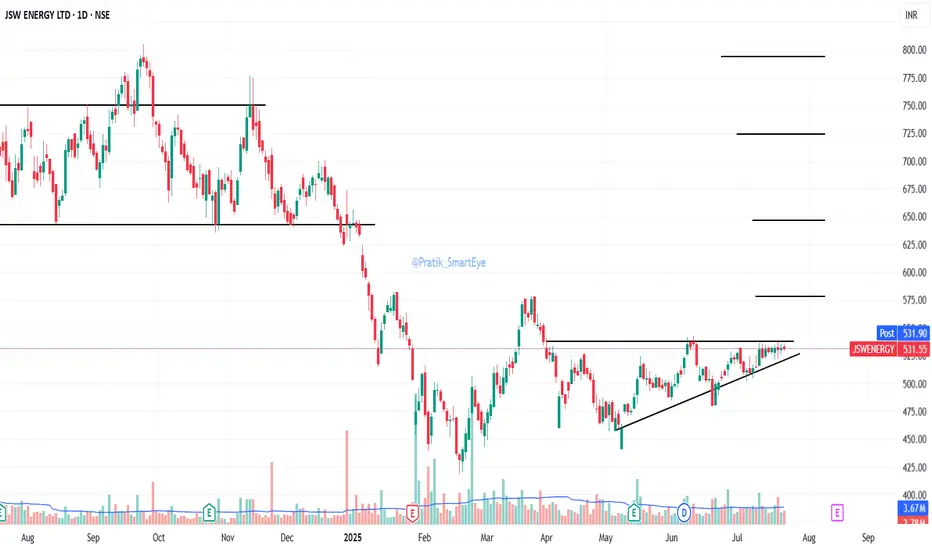
JSW Energy: forming a ascending triangleJSW Energy: forming a ascending triangle. CMP 531.
Breakout at sustained close above 540.
Resistance 578/646/724/794
Support 515/508
Earnings expected on 14Aug25
TATAMOTORS: Reversal Possible?1. The setup is exactly similar to the one I post earlier from JSW ENERGY.
2. The price is coming doen to the demand and then we plan for the entry based on the price structure shift.
⚠️ Disclaimer: This is NOT a buy/sell recommendation. This post is meant for learning purposes only. Views are personal. Please, do your due diligence before investing.⚠️
💬 Drop your thoughts below in the comments section if you liked this analysis!✌️
🔥Happy Trading!✅🚀

JSW ENERGY: The BO+RT Setup looks promising1. Price broke the 2 year ATH Resistance and now, it has almost has done a retest.
2. Expecting for the price to reverse and continue doing the upmove.
⚠️ Disclaimer: This is NOT a buy/sell recommendation. This post is meant for learning purposes only. Views are personal. Please, do your due diligence before investing.⚠️
💬 Drop your thoughts below in the comments section if you liked this analysis!✌️
🔥Happy Trading!✅🚀

JSWENERGYReasons to consider going long on JSWENERGY
1. Bullish Reversal Patterns:
• The green candle on horizontal support could signify a potential reversal.
2. 200-Day Moving Average as Support:
• The 200-day moving average is a key long-term support level. A bounce from this level often attracts institutional interest and signals strength in the stock.
3. Relative Strength vs. Nifty:
• Positive relative strength suggests that JSWENERGY is outperforming the broader market, making it a strong candidate for an uptrend continuation.
4. Sector Support:
• Nifty Energy index taking support on its horizontal support increases the likelihood of a sector-wide bounce, which could positively impact JSWENERGY.
Waiting for confirmation with a CHOCH (Change of Character) on the 1-hour timeframe is a solid approach. Here’s a structured plan based on that:
1. Wait for CHOCH on 1-Hour: The CHOCH would confirm a potential shift in market structure, signaling the beginning of bullish momentum. This adds more reliability to the trade setup.
2. Entry on Retest / FVG / IFVG:
• Retest: After the CHOCH, a retest of the breakout zone could provide an optimal entry, ensuring the breakout holds.
• Fair Value Gap (FVG): If an FVG appears within this structure, entering here could capture the shift in momentum at a lower-risk point.
• Imbalance Fair Value Gap (IFVG): An entry on an IFVG could further refine your risk-to- reward ratio, especially if market liquidity fills these gaps.

JSWEnergy Bullish Bias Set up Low Risk Reward Set upSimple Structure
Stock taking support at 200days EMA
Low risk set up
SL 640s
Targets 700+ / 750+

JSW Energy RSI positive divergene and HARMONIC ANTI BAT patternHello Everyone,
Jsw energey taking support of trendlines and demand zone of 600 and 640 small bounce is there RSI positive divergence and BULLISH harmonic pattern ANTI BAT formed so its overall confluence set up EMA50 will act as resistance breaking above that will go for bullish upto 780++ gor both swing as well as positional is overall reverasl set up

BUY JSWENERGYBuy entry for JSWENERGY as it has made a flag pattern also it has touched the trendline and might go up 10% - 12%.

PTC India for 100%+ gainsDate: 25 Nov’24
Symbol: PTC
Timeframe: Weekly
Seems like, Wave 4 is finally over in PTC India (in my 15th Sept post, I mentioned it as already over but the Wave was a complex one) and it will soon resume its up move in Wave 5 for the destination of 370-80. Some interesting facts to know why it can still double up from its current price of 168?
a. Healthy sales growth and debt reduction (lower interest cost) resulting in better balance sheet
b. Trading at very low Market Cap to Sales ratio of 0.30 and below book value
c. On charts, the stock is currently trading at price lower than December 2007 (it made a high of 201 in 2007)
This is not a prediction but a possible wave count. This is also not a recommendation to trade or invest. Please do your own analysis.
Aakhirkaar PTC India mein Wave 4 khatam hota dikh raha hai (mere 15 September ke post mein, maine kaha tha Wave 4 lagta hai end ho gaya hai par usne complex roop leliya) aur yah jald hee 370-80 ke lakshya ke lie Wave 5 mein apanee upmove phir se shuroo kar dega. Yah stock 168 se current price se kyon double ho sakta hai, neeche padhe.
a. Achi sales growth aur debt mein kamee (kam interest payments) ke kaaran ab balance sheet better hogayi hai
b. 0.30 ke bahut kam market cap to sales ratio aur aaj ka price book value se bhi kam hona
c. Chart par, stock abhi bhi December 2007 se bhi kam price par trade kar raha hai (2007 mein isne 201 ka high banaaya tha)

Tata Power for 20% gainsDate: 27 Sept’24
Stock: Tata Power
Timeframe: Daily chart
Tata Power seems to be in Wave V of 5 which is heading towards 580 levels (20% from current price of 485) as seen in the chart. It is then likely to go into a longer consolidation (a larger timeframe Wave 4) which I will analyse in due course. Likely to achieve this target by end of this year? (Yes, I would like to think so).
This is not a trade recommendation. Please do your own due diligence.

JSW energy reversal Market Cap
₹ 1,26,557 Cr.
Current Price
₹ 723
High / Low
₹ 805 / 348
Stock P/E
65.0
Book Value
₹ 127
Dividend Yield
0.28 %
ROCE
8.59 %
ROE
8.40 %
Face Value
₹ 10.0

JSWENERGY - Ready for next swing?JSWENERGY - Appears to have bounced back from it's recent favorite support. I see a good upside of 15-17% in the short time in this stock.
The company has been a in good up trend and has dipped for a good R:R grab of 1:1.7 RR.
Please check the fundamentals, do your own research before making a decision.

JSW ENERGYNote:
1. Views are personal and for educational purposes only. Recheck and take the trade as per your RR.
2. Always remember SL is your lifeline, not the big target...
3. Follow us for more patterns and like, share so that we feel it is helpful to many and share more patterns...
3. Views given here is not a tip rather it is for educational purpose... Aftermarket opens, the condition might change so learn to handle different conditions...
Keep an eye ladies and gentlemen. Cheers and Happy Trading

JSW Energy Ltd view for Intraday 9th September JSW Energy Ltd view for Intraday 9th September #JSWENERGY
Buying may witness above 715
Support area 702. Below ignoring buying momentum for intraday
Selling may witness below 702
Resistance area 715
Above ignoring selling momentum for intraday
Charts for Educational purposes only.
Please follow strict stop loss and risk reward if you follow the level.

JSW Energy Analysis for Swing positionIn day timeframe it break the resistance of 645 and make it support of now. . Now it behave like retracement .
Weekly timeframe it's bullish.
If we have any entry at 645 then Stop loss will be between 624-609 ,
Maximum volume will be at 609. it's a golden zone .
Entry position : At first let break 720 level with good volume and our entry will be next day from breaking the level.

"JSW Energy: Potential Breakout Ahead?""JSW Energy Nearing Breakout: RSI Rising (58.36) and Positive MACD - Await Breakout Candle with Volume"
Plan of action -
Buy above 660 ( proper closing )
Target 740-800
Sl 630
Wait for the volumes to come with a big fatgreen breakout candle.

JWS Energy - Showing Rounding PatternThe stock has formed a rounding bottom and currently following the breakout and expected to follow the trend till the target given with Minor dips in between.
RSI is above 70 showing strength.

Daily Bullish Flag breakout in JSW energy for 23% upsideHi,
NSE:JSWENERGY has given a Bullish Flag Breakout on Daily charts with very good volume.
MACD is also on the bullish side on daily and weekly time frames. RSI is also on the bullish side on daily and weekly time frames.
In the current market scenario, I am expecting that the bullish momentum will continue.
Complete price projection like entry, stop loss and targets mentioned on the charts for educational purpose.
Please share your feedback or any queries on the study.
Disclaimer: Please consult your financial advisor before making any investment decision.

JSWENERGY | Positional Trade📊 DETAILS
Sector: Power Generation/Distribution
Mkt Cap: 82,225 cr
JSW Energy Ltd and its subsidiaries are primarily engaged in the business of generation of power from its power assets located at Karnataka, Maharashtra, Nandyal and Salboni. It is the holding company for the JSW group's power business.
The company also has a JV company engaged in mining activities and an associate engaged in manufacturing of turbines.
TTM PE : 50.05 (Average PE)
Sector PE : 24.89
Beta : 1.01
📚 INSIGHTS
Mid range performer
Stock with medium financial performance with average price momentum and valuation. These stocks may be affordable and are showing some investors interest.
4.20% away from 52 week high
Underperformer - JSW Energy down by -0.29% v/s NIFTY 50 up by 2.5% in last 1 month
📈 FINANCIALS
Piotroski Score of 6/9 indicates Average Financials
Disclaimer: This analysis is for educational purposes only, and I'm not a SEBI registered analyst.
If you found this analysis helpful, I encourage you to like and share it. Your observations and comments are also welcomed below. Your support, likes, follows, and comments motivate me to consistently share valuable insights with you.
🔍 More Analysis & Trade Setups 🔍
For more technical analysis and trade setups, make sure to follow me on TradingView: www.tradingview.com
