KOTAKBANK -Long - 2 Hour chartKotak Bank Analysis (2H Chart)
Trend: Price is still in an overall uptrend and has taken support exactly on the rising trendline. The recent fall looks like a normal pullback inside a falling wedge.
Volumes: Volumes were low during the fall, which shows sellers were weak. The latest green candle has slightly higher volume, showing buyers are coming back.
Divergence: RSI has formed a bullish divergence. Price made lower lows but RSI made higher lows. This signals a possible trend reversal on the upside.
RSI: RSI is near 58, which is a healthy zone. Momentum is improving and there is room for the price to move higher.
ADX: ADX is around 38, which means the stock is still in a trending phase. If the price breaks out from the wedge, the trend may continue.
Overall View: The chart is showing early signs of a bullish move from trendline support with divergence and improving momentum.
KOTAKBANK

Kotak Mahindra Bank (Neowave Trading Idea)Namaskaram
Cycle - consolidated 5th up swing on Long Term Chart (Black Labelling).
Medium Cycle (Blue Labelling) giving an correction, which most likely completed.
Currently retraced 61 percent.
LTP = 2079.7
stoploss = 1,986
About Target- Well target should be above 2302.
But this price should reach before January. So if you see price is rising but not giving enough speed than exit where you get a good price.
I will also make a video on this one today and upload it here.
Thank You.

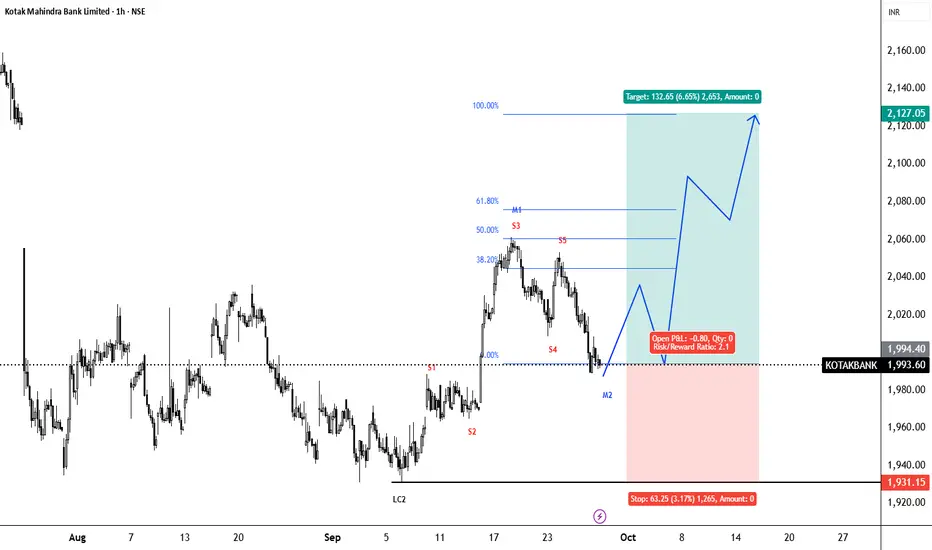
Kotak Mahindra Bank (Neowave Forecast)NSE:KOTAKBANK
Namaskaram
Cycle - consolidated 5th up swing on Long Term Chart (Black Labelling).
Medium Cycle (Blue Labelling) giving an correction, which most likely completed.
Currently retraced 61 percent.
LTP = 2079.7
stoploss = 1,986
About Target- Well target should be above 2302.
But this price should reach before January. So if you see price is rising but not giving enough speed than exit where you get a good price.
Thank You.

KOTAKBANK - Rectangle Consolidation Breakout Watch🚀 Kotak Mahindra Bank Ltd (NSE: KOTAKBANK) | Rectangle Consolidation Breakout Watch
📊 Current Market Snapshot
CMP: ₹2,063.30
Sector: Banking & Financial Services
Pattern Observed: 📦 Rectangle Consolidation (Range-Bound)
Candlestick Signal: Strong Bullish Candle + Bullish Engulfing
Strength Rating: ⭐⭐⭐⭐ (Bullish Breakout Watch)
________________________________________
📈 Price Action & Chart Pattern
The stock has been trading between support near ₹1,970 and resistance near ₹2,020, forming a sideways rectangle box. Today’s move shows a decisive bullish candle with high volume, suggesting a breakout attempt from this consolidation.
Support Range: ₹1,968 – ₹1,970
Resistance Range: ₹2,018 – ₹2,020
Breakout Zone: Above ₹2,020 with volume confirmation
Breakdown Zone: Below ₹1,970 may trigger renewed weakness
🔍 Why Important? Rectangle consolidations represent accumulation or distribution phases. A breakout above resistance often leads to strong directional moves.
________________________________________
🔎 Technical Indicators
RSI (14): 61.37 → Breaking out of consolidation zone.
EMA Support: Price reclaiming above EMA50, signaling trend strength.
Volume: Breakout attempt supported by 1.5x+ average volumes.
Kotak Bank — a strong bullish candle with Bullish Engulfing, RSI breakout, and Open = Low showing aggressive buying from the start. Price holding above VWAP signals institutional support, while the BB squeeze off suggests volatility expansion ahead. Together, these factors strengthen the case for a rectangle breakout continuation.
________________________________________
📍 Key Levels to Watch
Immediate Support: ₹1,968 – ₹1,970
Immediate Resistance: ₹2,018 – ₹2,020
Upside Possible (if breakout): ₹2,120 – ₹2,150
Downside Possible (if breakdown): ₹1,920 – ₹1,900
________________________________________
🔮 Bullish & Bearish Scenarios
✅ Bullish Case: Sustained close above ₹2,020 with strong volume may trigger a rally towards ₹2,120+.
⚠️ Bearish Case: Rejection near ₹2,020 and breakdown below ₹1,970 may drag the stock back to ₹1,920 or lower.
________________________________________
📝 STWP Trade Analysis
Entry: ₹2,063.30
Stop-loss: ₹1,968.60 (below rectangle support)
Risk: ~₹94.70 points
Strength: ⚡ Strong Bullish Momentum + High Volume + EMA Breakout
Demand Zone: ₹2,009 – ₹1,970 | SL: 1,968.60
📌 Note: Rectangle breakouts backed with volume tend to give quick moves. Traders should stay disciplined with SL.
________________________________________
🎯 Final Outlook
Kotak Mahindra Bank is attempting a bullish breakout from a rectangle consolidation zone. If the stock sustains above ₹2,020 with volumes, it could rally towards ₹2,120–₹2,150. However, failure to hold may drag it back inside the range.
________________________________________
💡 Learning Note: Rectangle patterns represent market indecision zones where buyers and sellers balance out. Breakouts with strong volume often indicate institutional participation, providing reliable trade setups.
________________________________________
⚠️ Disclosure & Disclaimer – Please Read Carefully
The information shared here is meant purely for learning and awareness. It is not a buy or sell recommendation and should not be taken as investment advice. I am not a SEBI-registered investment adviser, and all views expressed are based on personal study, chart patterns, and publicly available market data.
Trading—whether in stocks or options—carries risk. Markets can move unexpectedly, and losses can sometimes exceed the money you have invested. Past performance or past setups do not guarantee future results.
If you are a beginner, treat this as a guide to understand how the market works and practice on paper trades before risking real money. If you are experienced, always assess your own risk, position sizing, and strategy suitability before entering trades.
Consult a SEBI-registered financial adviser before making any real trading decision. By engaging with this content, you acknowledge full responsibility for your trades and investments.
💬 Found this useful?
🔼 Give this post a Boost to help more traders discover clean, structured learning.
✍️ Drop your thoughts, questions, or setups in the comments — let’s grow together!
🔁 Share with fellow traders and beginners to spread awareness.
👉 “If you liked this breakdown, follow for more clean, structured setups with discipline at the core.”
🚀 Stay Calm. Stay Clean. Trade With Patience.
Trade Smart | Learn Zones | Be Self-Reliant 📊
________________________________________

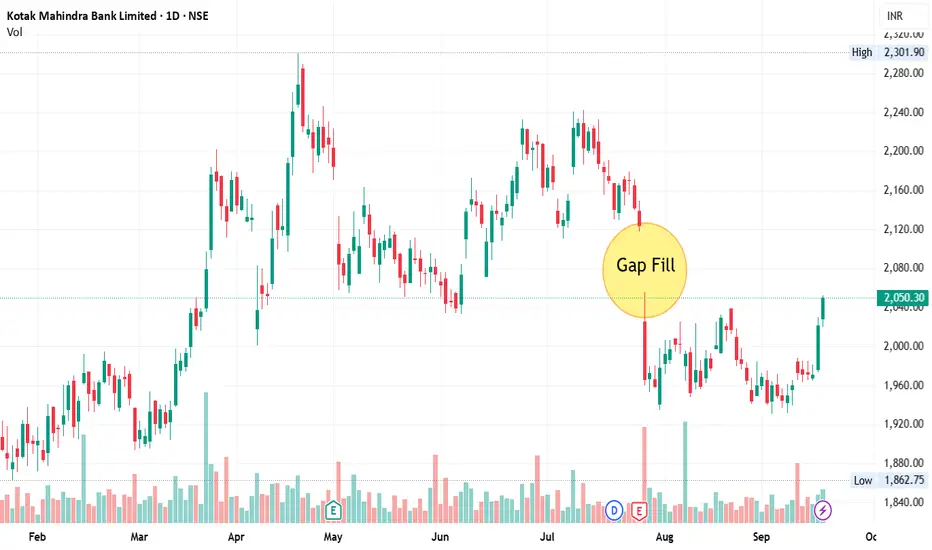
Gap Fill - Kotak Mahindra Bank📊 Script: KOTAKBANK
Key highlights: 💡⚡
📈 Script will fill gap in near future, we may see some good rally.
📈 One can go for Swing Trade.
⏱️ C.M.P 📑💰- 2050
🟢 Target 🎯🏆 - 2176
⚠️ Stoploss ☠️🚫 - 1991
⚠️ Important: Always maintain your Risk & Reward Ratio.
✅Like and follow to never miss a new idea!✅
Disclaimer: I am not SEBI Registered Advisor. My posts are purely for training and educational purposes.
Eat🍜 Sleep😴 TradingView📈 Repeat 🔁
Happy learning with trading. Cheers!🥂
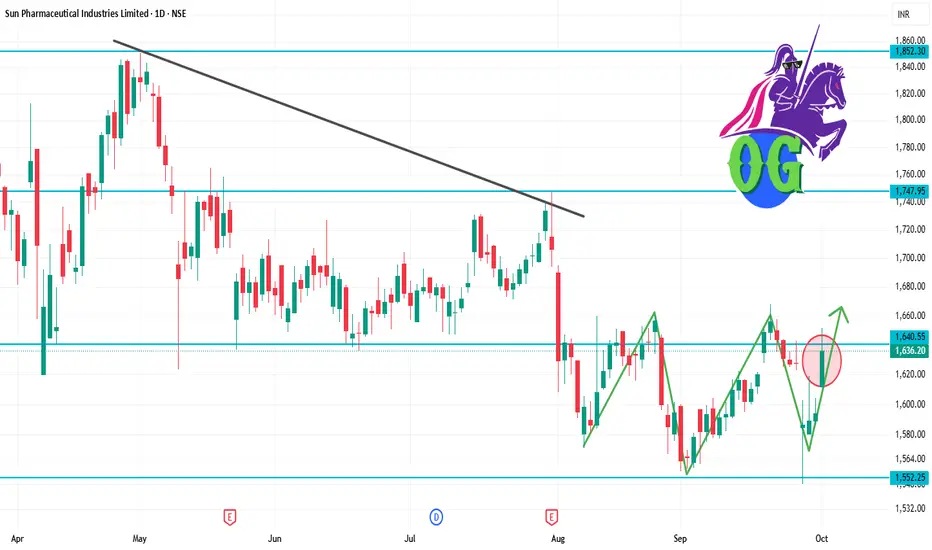
SUNPHARMA 1D Time frameCurrent Snapshot
Current Price: ₹1,636.20
52-Week High: ₹1,952.25
52-Week Low: ₹1,548.00
Strategy & Outlook
Bullish Bias: The stock is in a short-term uptrend with positive momentum indicators.
Buying Opportunity: Consider entering near support zones (₹1,600–₹1,610) with a target towards ₹1,650–₹1,670.
Risk Management: Place stop-loss orders below the support levels to manage potential downside risks.
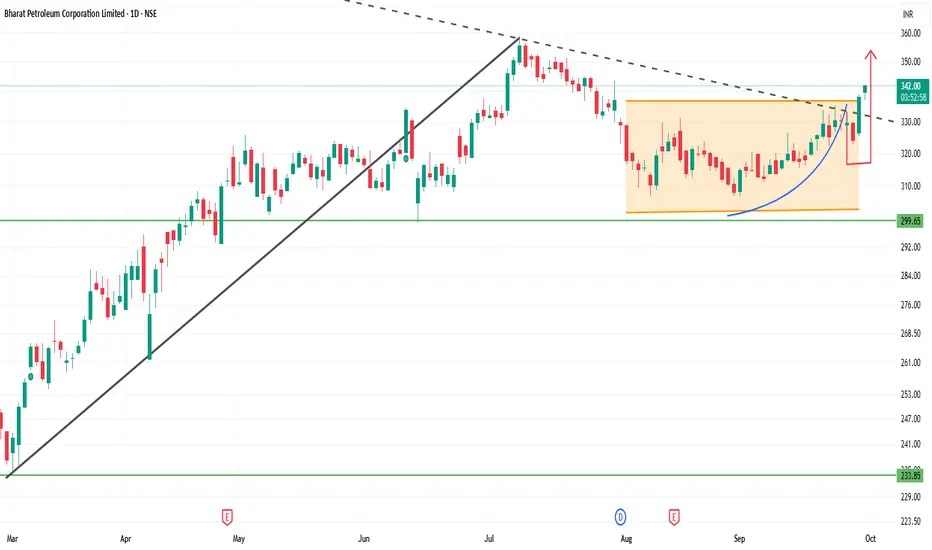
BPCL 1D Time frameCurrent Price Snapshot
Last Traded Price: ₹340.20
Day’s Range: ₹337.15 – ₹340.85
52-Week Range: ₹234.01 – ₹373.35
Technical Indicators
RSI (14-day): 53.27 — indicates a neutral momentum.
MACD: 2.49 — suggests a bullish trend.
Moving Averages:
5-day: ₹327.97 — indicates a Sell signal.
50-day: ₹322.14 — indicates a Buy signal.
200-day: ₹296.14 — indicates a Buy signal.
Pivot Points:
Support: ₹327.13
Resistance: ₹337.93
Summary
Above ₹340.85: Potential rise toward ₹345 – ₹350.
Below ₹337.15: Potential fall toward ₹330 – ₹325.
Between ₹330 – ₹340: Likely range-bound movement.
Kotak Mahindra Bank Neowave Trading IdeaNamaskaram Everyone
I trade using Neowave and on that I have created an trading setup, which is kind of automatic entry and exit with Neowave.
Neowave is kind of a method in which you synchronize all the price action across all the time frames. It hides all the noise and tells you market is bullish or bearish.
About Stock Structure
Entry Type- Medium Term Forecast mean Entry will take 4 to 8 weeks and some times more.
Wave Structure- We are at starting point of wave, which kind of gives you an edge in riding the wave when you above your buying level
60 percent Retracement- Mean you will have easily 1:2 or 3 easy risk reward.
Doubts-If you are fearing in taking trades that mean you are taking stop loss amount more than you & your capital can handle.
Follow 1 percent rule and trail, that's it. Don't complicate life and trading.
Simply live and die. HaHA
Like and share is appreciated.
Thank You
To understand how our coding works read the below post-
NSE:KOTAKBANK NSE:KOTAKBANK1!
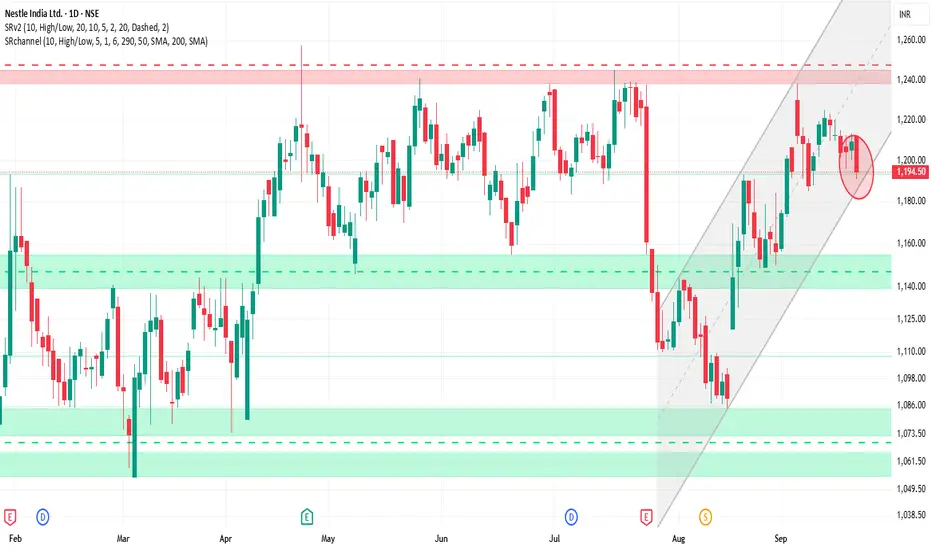
NESTLEIND 1D Time frame📊 Current Snapshot
Closing Price: ₹1,194.50
Day’s Range: ₹1,190.20 – ₹1,212.00
52-Week Range: ₹1,055.00 – ₹1,389.00
Volume: Approximately 2.4 million shares traded
Market Cap: ₹2,30,337 Crores
P/E Ratio: 78.40 (reflecting premium valuation)
Dividend Yield: 2.26%
⚙️ Technical Indicators
Relative Strength Index (RSI): 47.51 – Neutral
Moving Average Convergence Divergence (MACD): -4.12 – Bearish
Moving Averages: Mixed signals; short-term averages above the current price, while long-term averages are below, indicating potential resistance.
Pivot Points: Central pivot around ₹1,194.73, suggesting a balanced market sentiment.
🎯 Potential Scenarios
Bullish Scenario: A breakout above ₹1,197.26 with strong volume could target ₹1,202.16 and higher levels.
Bearish Scenario: Failure to hold above ₹1,187.46 may lead to a decline toward ₹1,183.83.
⚠️ Key Considerations
Market Sentiment: Nestlé India has shown strong performance recently, but broader market conditions can impact its movement.
Volume Analysis: Watch for volume spikes to confirm breakout or breakdown signals.
Technical Indicators: While the RSI indicates a neutral stance, the MACD and moving averages suggest caution.
SENSEX 1D Time frameCurrent Status
Sensex Level: 82,623
Change: +594.95 points (+0.73%)
Opening: 81,852
Day’s Range: 81,780 – 82,443
52-Week Range: 71,425 – 85,978
📈 Market Sentiment
Trend: Mildly bullish
Leading Sectors: Auto, Realty, Telecom
Investor Mood: Optimistic, but watching global cues
🔍 Key Levels to Watch
Immediate Support: 81,800 – 81,850
Resistance Zone: 82,400 – 82,500
Psychological Milestone: Breaking above 82,500 may push higher
🧭 Outlook
Sensex is showing positive momentum supported by strong sectors.
Bulls are slightly stronger, but resistance near 82,400–82,500 may cap upside.
A drop below 81,800 could bring downside pressure toward 81,500–81,400.

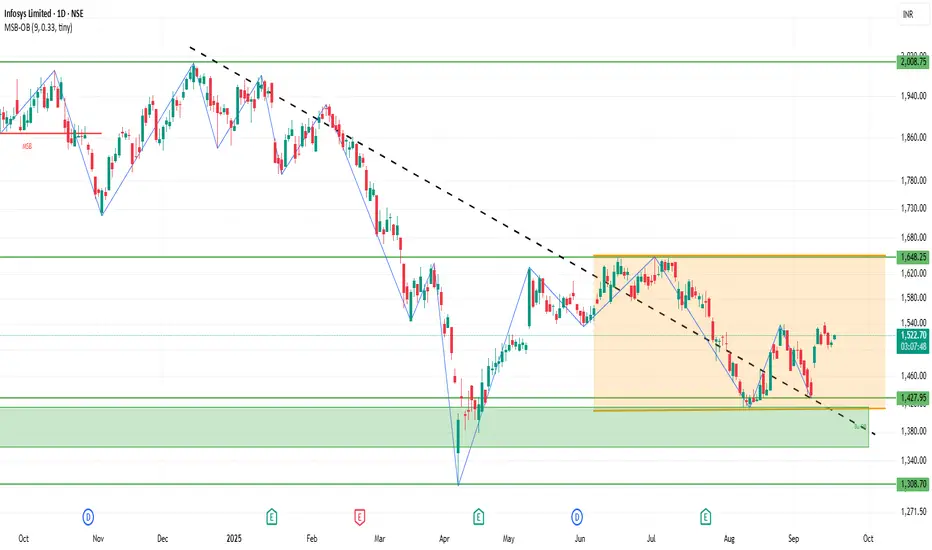
INFY 1D Time frameCurrent Stock Price
Current Price: ₹1,525.60
Day’s Range: ₹1,521.10 – ₹1,542.90
52-Week Range: ₹1,307.00 – ₹2,006.45
Market Cap: ₹6.33 lakh crore
P/E Ratio (TTM): 23.0
EPS (TTM): ₹65.63
Dividend Yield: 2.82%
Book Value: ₹230.65
📈 Trend & Outlook
Short-Term Trend: Bullish; the stock is trading near its 52-week high, indicating strong investor confidence.
Resistance Levels: ₹1,542.90 (day’s high), ₹2,006.45 (52-week high).
Support Levels: ₹1,521.10 (day’s low), ₹1,500.00 (psychological support).
Investor Sentiment: Positive, with strong institutional interest and favorable analyst outlooks.
🧭 Analyst Insights
Valuation: The stock is trading at a P/E ratio of 23.0, which is below the sector average of 28.56, suggesting potential value.
Growth Prospects: The company’s strong earnings growth and robust capital position support its premium valuation.
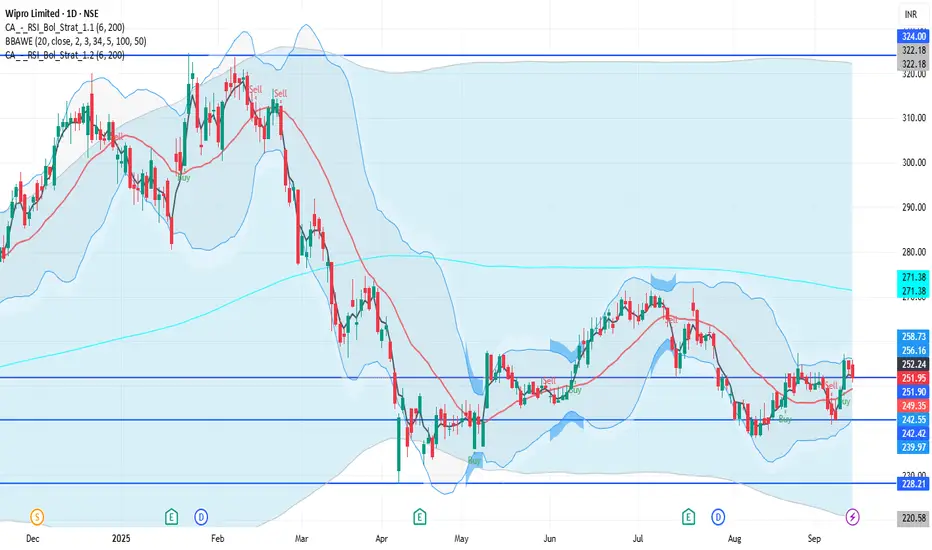
WIPRO 1D Time frameCurrent Price & Trend
Price: ₹251.95
Trend: Neutral; trading approximately 22.5% below its 52-week high of ₹324.60, reached on July 2, 2025.
Momentum: Indicators suggest a neutral to slightly bearish outlook.
Bullish Scenario
Breakout Above ₹257: A sustained move above ₹257 could target ₹265 – ₹270 in the short term.
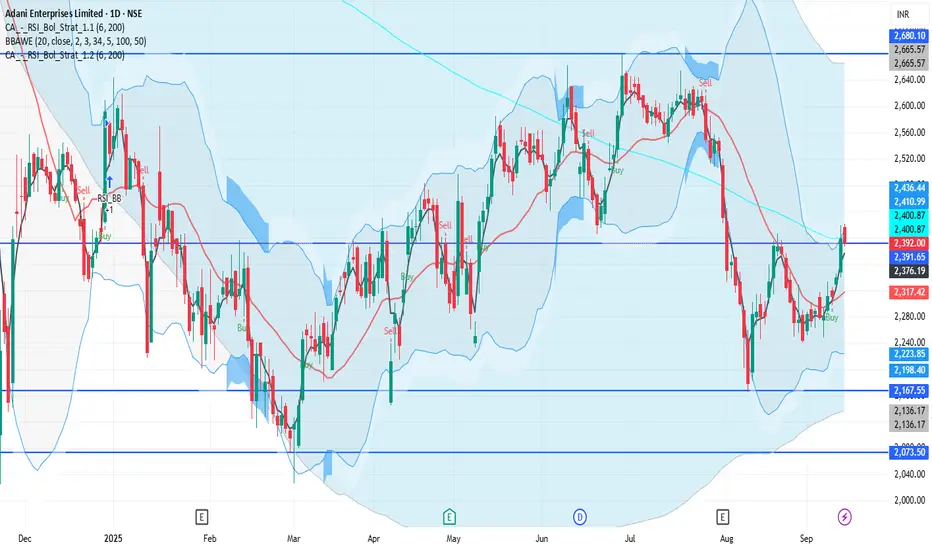
ADANIENT 1D Time frameCurrent Price & Trend
Price: ₹2,392.00
Trend: Neutral; trading approximately 25.5% below its 52-week high of ₹3,211.00, achieved on July 1, 2025.
Momentum: Indicators suggest a neutral to slightly bearish outlook.
Bullish Scenario
Breakout Above ₹2,420: A sustained move above ₹2,420 could target ₹2,440 – ₹2,450 in the short term.
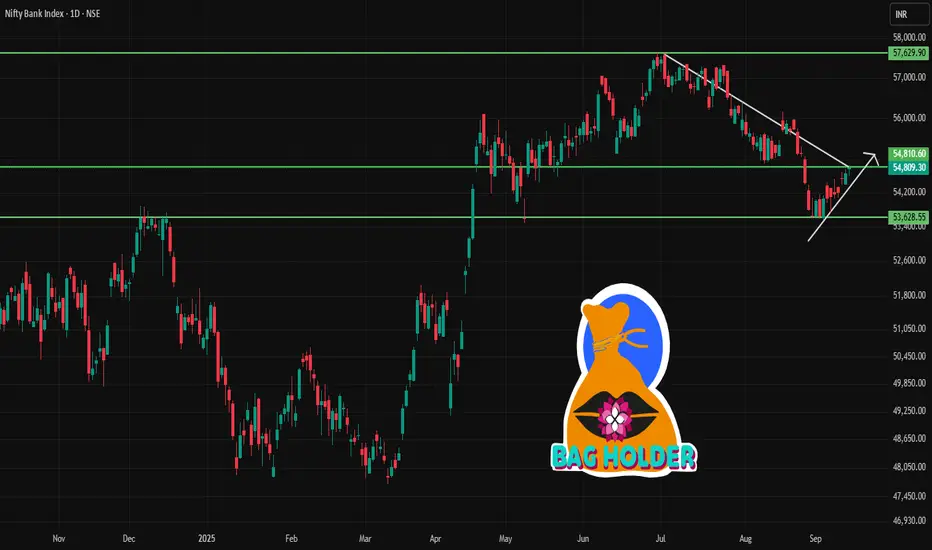
BANKNIFTY 1D Time frame📉 Current Market Snapshot
Closing Price: ₹54,809.30
Day's Range: ₹54,580.35 – ₹54,852.25
52-Week Range: ₹47,702.90 – ₹57,628.40
Market Cap: ₹45,50,788 crore
P/E Ratio: 14.9
Dividend Yield: 1.09%
Price-to-Book Ratio: 2.03
1-Year Return: +5.87%
5-Year Return: +147.36%
10-Year Return: +12.5%
HINDUNILVR 1D Time frame📍 Current Price
₹2,580.50 (down 1.58% from previous close)
Short-Term Outlook
Bullish Scenario: Sustained move above ₹2,650 could lead to a test of ₹2,700.
Bearish Scenario: Break below ₹2,553.70 may signal a deeper pullback toward ₹2,500.

Smart Money Secrets in Trading1. What Is Smart Money?
The term “smart money” refers to capital controlled by investors with the most knowledge, resources, and influence in the market. Unlike retail traders who rely on news headlines, gut feelings, or basic technical indicators, smart money entities often have:
Advanced Research – Access to data analytics, machine learning models, and macroeconomic reports that retail traders can’t afford.
Liquidity Power – Ability to move billions of dollars into or out of markets.
Insider Insights – Not illegal insider trading, but a network of analysts, lobbyists, and industry connections that help them anticipate shifts earlier.
Sophisticated Tools – Proprietary algorithms, HFT (High-Frequency Trading) systems, and volume analysis.
When smart money flows into an asset, it often precedes strong trends. Conversely, when it exits, the trend weakens. Spotting these shifts is the cornerstone of trading like institutions.
2. Why Following Smart Money Matters
Most retail traders face three challenges:
They are late. By the time news is published, smart money has already acted.
They are emotional. Fear and greed drive poor decisions.
They are undercapitalized. Limited funds mean smaller risk tolerance and forced exits.
Smart money, on the other hand, has time, patience, and size on its side. They often accumulate positions when the market is quiet and distribute them when hype peaks. If retail traders learn to read footprints left by institutions, they can avoid being trapped and instead ride the waves created by these giants.
3. Smart Money Psychology
Before diving into strategies, it’s crucial to understand how smart money thinks differently:
Accumulation vs. Distribution: Institutions quietly build positions (accumulation) when prices are low and sentiment is negative. Later, they sell (distribution) when retail enthusiasm is high.
Liquidity Hunting: Big players need liquidity to enter and exit. They often push prices into zones where retail traders place stop-loss orders, triggering forced selling or buying, which provides liquidity for institutions.
Contrarian Nature: Smart money often takes positions opposite to the crowd. If everyone is bullish on a stock, institutions might be preparing to sell.
This mindset explains why retail traders often feel “the market is against them.” In reality, they are just on the wrong side of institutional strategies.
4. Smart Money Strategies in Action
a) Wyckoff Method
Richard Wyckoff’s market theory is one of the earliest frameworks for analyzing smart money moves. It breaks market cycles into accumulation, markup, distribution, and markdown.
Accumulation: Institutions quietly buy. Prices stay in a range.
Markup: Price breaks out as buying accelerates.
Distribution: Institutions sell to latecomers.
Markdown: Prices collapse as supply overwhelms demand.
Recognizing these phases helps traders align with institutional activity instead of being victims of it.
b) Volume Profile and Order Flow
Smart money activity often shows up in volume spikes at key price levels.
High Volume Nodes: Suggest accumulation/distribution zones.
Low Volume Nodes: Indicate areas where price moves quickly (little resistance).
Using tools like Volume Profile, Order Flow Charts, or Footprint Charts allows traders to identify where institutions are active.
c) Stop-Loss Hunting
Ever noticed your trade gets stopped out before the price reverses in your favor? That’s not coincidence. Institutions deliberately push prices into stop-loss zones to trigger retail exits, giving them the liquidity to enter positions. Recognizing liquidity pools (clusters of retail stops) helps traders anticipate these moves.
d) Options and Derivatives
Smart money often uses options to hedge or accumulate exposure without moving the underlying asset visibly. For example, unusual options activity (UOA) often precedes big stock moves. Tracking options volume and open interest provides clues about institutional expectations.
e) Dark Pools
Institutions often trade in “dark pools”—private exchanges where large orders are hidden from the public order book. While retail traders can’t see these trades in real time, monitoring dark pool data feeds can reveal where institutions are accumulating or unloading.
5. Indicators of Smart Money Activity
How can a retail trader detect smart money flow? Here are practical signals:
Unusual Volume – Sharp spikes in trading volume without corresponding news often signal institutional activity.
Price Action at Key Levels – Repeated defense of support/resistance zones often shows accumulation or distribution.
Commitment of Traders (COT) Reports – For commodities and forex, COT reports reveal institutional positions.
Options Activity – Large trades in far-dated contracts signal expectations of future moves.
Insider Buying/Selling – Public filings (like Form 4 in the US) show what company executives are doing with their shares.
Market Breadth Divergence – If a few large-cap stocks push indices higher while the majority lag, smart money may be distributing.
6. Smart Money Secrets Retail Traders Overlook
Secret 1: News Is Noise
By the time retail traders act on CNBC headlines, smart money has already positioned. Institutions often use news events to exit positions while retail crowds rush in.
Secret 2: Patience Pays
Smart money is not chasing quick profits—they wait weeks or months to build positions. Retail traders who overtrade often lose by being too impatient.
Secret 3: Fake Moves Before Real Moves
Markets often create false breakouts or sharp wicks to trick retail traders into the wrong direction. These are engineered by big players to grab liquidity.
Secret 4: Scaling In and Out
Institutions never place all their capital at once. They accumulate in layers to avoid moving the market. Retail traders often go “all in” and get wiped out.
Secret 5: Risk Management Is Non-Negotiable
The true secret of smart money isn’t just knowing where to trade—it’s knowing how much to risk. They survive losing streaks by controlling position size and leverage.
Conclusion
Smart money isn’t a mysterious cabal manipulating markets—it’s simply capital managed by those with deeper knowledge, bigger resources, and stronger discipline. Their secrets are not inaccessible; they’re patterns and behaviors visible to those who know where to look.
By understanding accumulation/distribution, liquidity hunting, volume footprints, options flow, and institutional psychology, retail traders can stop fighting the market and instead surf the waves created by the giants.
The real secret, however, is not in any single indicator—it’s in the mindset: patience, discipline, risk management, and the ability to think like an institution rather than a gambler. Once traders internalize this, they transition from being part of the crowd to moving in sync with the real power behind the markets.
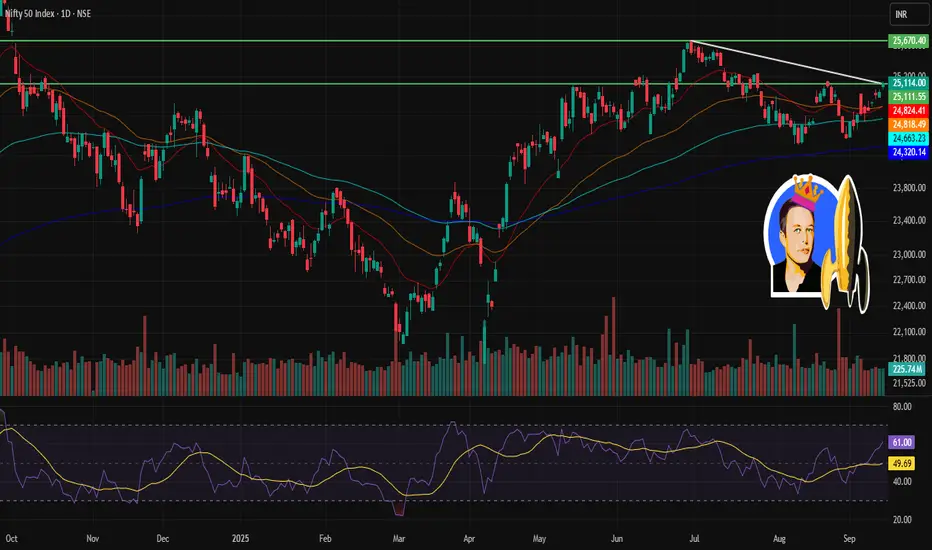
NIFTY 1D Time frame🔢 Current Level
NIFTY ~ 25,114
🔑 Key Resistance & Support Levels
Resistance Zones:
~ 25,200 – 25,250 (near-term resistance)
~ 25,400 – 25,500 (stronger resistance if it breaks above the first zone)
Support Zones:
~ 24,950 – 25,000 (immediate support)
~ 24,800 – 24,900 (short-term support)
~ 24,600 – 24,700 (deeper support, in case of downside move)
📉 Outlook
Bullish Scenario: If NIFTY holds above ~25,000 and clears ~25,250, it may head toward ~25,400-25,500.
Bearish Scenario: If it drops below ~24,950, then weakness may drag it toward ~24,800 or lower supports.
Neutral / Range: Between ~25,000 – 25,250 likely consolidation until a decisive move.
SBIN 1D Time frame🔢 Current Level
Trading around ₹823.65
🔑 Key Resistance & Support Levels
Resistance Zones:
₹825.00 – ₹830.00 (recent highs; breakout above this may lead to further upside)
₹835.00 – ₹840.00 (stronger resistance above)
Support Zones:
₹815.00 – ₹820.00 (immediate support; failure to hold above this may lead to a decline)
₹810.00 – ₹815.00 (short-term support; a break below this could indicate weakness)
₹800.00 – ₹805.00 (deeper support zone if price dips further)
📉 Outlook
Bullish Scenario: If SBIN holds above ₹820.00, upward momentum may continue. Break above ₹830.00 can open the way toward ₹840.00+.
Bearish Scenario: If it falls below ₹800.00, risk increases toward ₹790.00 – ₹795.00.
Neutral / Range: Between ₹820.00 – ₹830.00, SBIN may consolidate before a directional move.

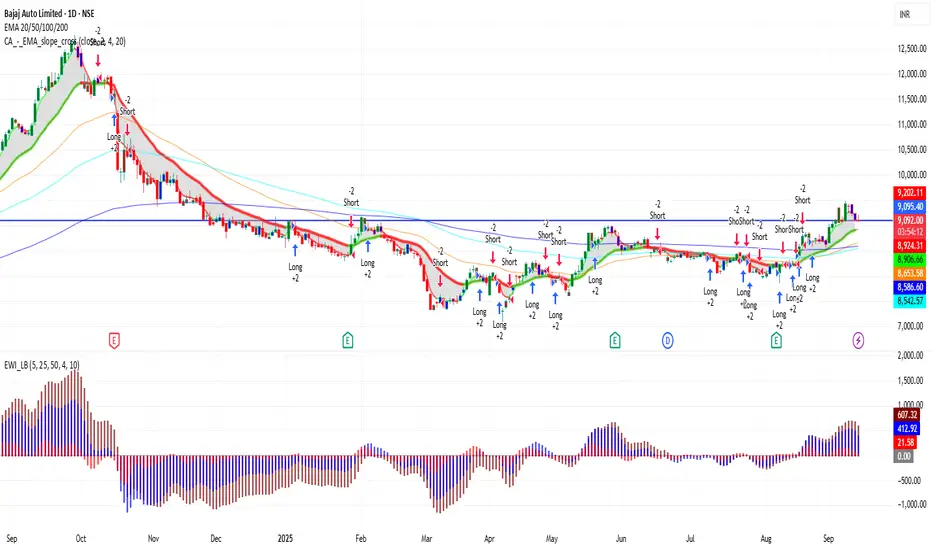
BAJAJ_AUTO 1D Time frame🔢 Current Level
Trading around ₹9,092 – ₹9,110
🔑 Key Resistance & Support Levels
Resistance Zones:
₹9,150 – ₹9,200 (near-term resistance; breakout above this may lead to further upside)
₹9,300 (stronger resistance above)
Support Zones:
₹9,070 – ₹9,090 (immediate support)
₹8,900 (stronger support if price dips further)
₹8,800 (deeper support zone)
📉 Outlook
Bullish Scenario: If Bajaj Auto holds above ₹9,090, upward momentum may continue. Break above ₹9,200 can open the way toward ₹9,300+.
Bearish Scenario: If it falls below ₹8,900, risk increases toward ₹8,800.
Neutral / Range: Between ₹9,090 – ₹9,200, Bajaj Auto may consolidate before a directional move.
ITC 1D Time frame🔢 Current Level
Trading around ₹414 – ₹432
🔑 Key Resistance & Support Levels
Resistance Zones:
₹435 – ₹438 (near-term resistance; breakout above this may lead to further upside)
₹442 (stronger resistance above)
Support Zones:
₹425 – ₹428 (immediate support)
₹420 (stronger support if price dips further)
₹415 – ₹417 (deeper support zone)
📉 Outlook
Bullish Scenario: If ITC holds above ₹428, upward momentum may continue. Break above ₹438 can open the way toward ₹442+.
Bearish Scenario: If it falls below ₹420, risk increases toward ₹415 – ₹417.
Neutral / Range: Between ₹428 – ₹438, ITC may consolidate before a directional move.
SENSEX 1D Time frame📊 Current Snapshot
Current Price: ₹81,571
Day’s Range: ₹81,500 – ₹81,600
Previous Close: ₹81,425.15
Opening Price: ₹81,504.36
Volume: Moderate
📈 Trend & Indicators
Trend: Neutral to mildly bullish; trading near short-term resistance.
RSI (14): Neutral zone.
MACD: Positive → indicating mild bullish momentum.
Moving Averages: Short-term averages indicate neutral to slightly bullish outlook.
🔮 Outlook
Bullish Scenario: Break above ₹81,700 with strong volume could target ₹81,900.
Bearish Scenario: Drop below ₹81,400 may lead to further decline toward ₹81,200.
Neutral Scenario: Consolidation between ₹81,400 – ₹81,700; breakout needed for directional move.
📌 Key Factors to Watch
Economic Indicators: Interest rates, inflation, and RBI policy updates.
Sector Performance: Trends in the IT and financial sectors.
Global Cues: Global market trends, US indices, crude oil, and currency movements.

NIFTY 1D Time frame📊 Current Snapshot
Current Price: ₹25,022.20
Day’s Range: ₹24,973.00 – ₹25,035.00
Previous Close: ₹24,976.10
Opening Price: ₹24,991.00
Volume: Moderate
📈 Trend & Indicators
Trend: Neutral to mildly bullish; trading near short-term resistance.
RSI (14): Neutral zone.
MACD: Positive → indicating mild bullish momentum.
Moving Averages: Short-term averages indicate neutral to slightly bullish outlook.
🔮 Outlook
Bullish Scenario: Break above ₹25,050 with strong volume could target ₹25,100.
Bearish Scenario: Drop below ₹24,950 may lead to further decline toward ₹24,900.
Neutral Scenario: Consolidation between ₹24,950 – ₹25,050; breakout needed for directional move.
📌 Key Factors to Watch
Economic Indicators: Interest rates, inflation, and RBI policy updates.
Sector Performance: Trends in the IT and financial sectors.
Global Cues: Global market trends, US indices, crude oil, and currency movements.

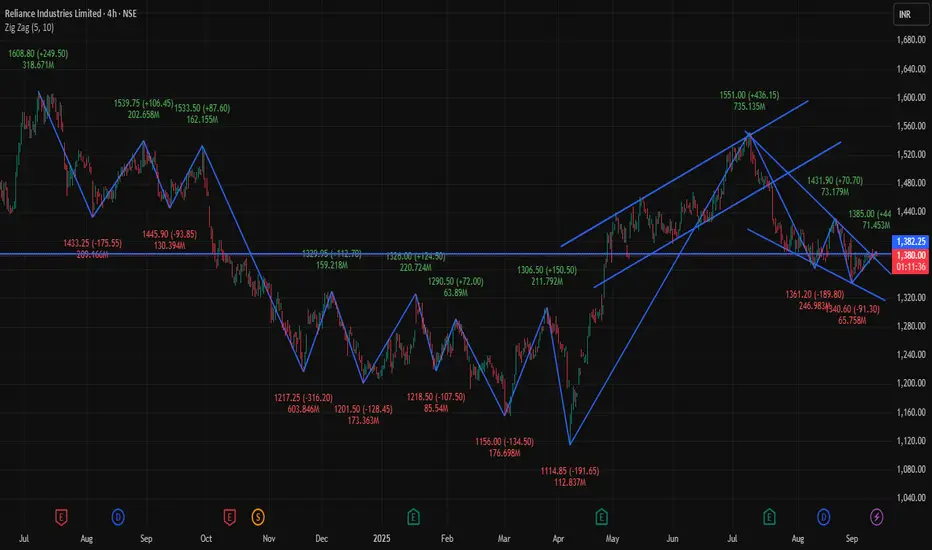
RELIANCE 4Hour 📊 Current Snapshot
Current Price: ₹1,380📈 Trend & Indicators
Trend: Neutral to mildly bullish; trading near short-term resistance.
RSI (14): Neutral zone.
MACD: Positive → indicating mild bullish momentum.
Moving Averages: Short-term averages indicate neutral to slightly bullish outlook.
🔮 Outlook
Bullish Scenario: Break above ₹1,385.50 with strong volume could target ₹1,390.00.
Bearish Scenario: Drop below ₹1,375.00 may lead to further decline toward ₹1,370.00.
Neutral Scenario: Consolidation between ₹1,375.00 – ₹1,385.50; breakout needed for directional move.
📌 Key Factors to Watch
Economic Indicators: Interest rates, inflation, and RBI policy updates.
Sector Performance: Trends in the energy and petrochemical sectors.
Global Cues: Global market trends, US indices, crude oil, and currency movements..90
Day’s Range: ₹1,375.00 – ₹1,385.50
Previous Close: ₹1,377.00
Opening Price (4H): ₹1,376.00
Volume: Approximately 371,445 shares traded