LTFOODS SHORTTrade Rationale
LT Foods is mirroring the broader weakness in the rice exports sector. The stock has broken below its short-term pivot and is facing resistance from the 5-SMA (374.66) and 10-SMA (381.37).
Price Action: Rejection at the 365–367 zone.
Momentum: The MACD is bearish, and the ADX at 28.58 indicates a strengthening downward trend.
Trade Parameters
Level Type,Price Level
Current Price,365.00
Stop Loss (SL),374.90 (Above immediate resistance)
Take Profit (TP),320.70 (Next structural support)
Risk/Reward,1:3.5
⚠️ DISCLAIMER
Educational Use: These setups are for educational purposes only.
Market Risk: Stock trading involves high risk. KRBL and LT Foods are volatile assets with betas above 1.0.
Verification: Perform your own due diligence before entering any trade.
KRBL

KRBL SHORTShort Setup: KRBL Limited (NSE: KRBL)
Market Context
KRBL is currently exhibiting a strong bearish trend on the intraday timeframe. The stock has faced persistent selling pressure, declining approximately 9.5% over the last month and nearly 8% in the past week. It is currently trading well below its major moving averages, including the 50, 100, and 200-day SMAs.
Technical Setup
The provided 15-minute chart indicates a breakdown from recent consolidation levels, targeting long-term support zones.
Pattern: Distribution followed by a breakdown below the 360 psychological level.
Momentum: Technical indicators like the MACD and multiple Moving Averages (5-SMA to 200-SMA) are signaling bearish momentum. The Stoch RSI indicates an oversold condition, which may lead to a minor relief pullback before further decline.
Level Type,Price Level
Current Market Price (CMP),356.00
Entry Range,356.00 – 363.00 (Pullback entry preferred)
Stop Loss (SL), 375.60
Take Profit 1 (TP1),310.00 (Intermediate psychological support)
Take Profit 2 (TP2),288.70 (Primary target/long-term support zone)
Risk/Reward Ratio,~1:1.8 to 1:2.0 (depending on entry)
⚠️ DISCLAIMER
Educational Purpose Only: This analysis is for informational purposes and does not constitute financial advice.
Risk Warning: Trading involves significant risk. KRBL has high volatility (Beta ~1.63).
Due Diligence: Always use your own analysis and risk management strategies before entering a trade.

GRM OVERSEAS SHORT Short Setup: GRM Overseas (GRMOVER )
Trade Overview
Asset: GRM Overseas Ltd (NSE: GRMOVER)
Timeframe: 15-Minute
Position: Short (Sell)
Strategy: Rejection at resistance following a recent distribution phase.
Technical Analysis
The stock has shown significant volatility in early January. After hitting a high near 175.50, it has struggled to maintain upward momentum.
Price Action: The chart shows a failure to sustain levels above 172. The current price is hovering around the 170 mark, which is acting as a pivot point.
Risk/Reward: This setup targets a move back toward the lower support zones established in late December.
Recent Context: The stock recently processed a 2:1 bonus issue (late December 2025), which has increased liquidity but also led to profit-booking at higher levels.
Level Type,Price Level
Entry Range,168.50 – 170.20
Stop Loss (SL),174.80 (Above recent swing high)
Take Profit (TP),146.00 (Targeting major support)
Risk/Reward Ratio,Approx. 1:4.5
Based on the chart provided and the current market data for Tuesday, January 13, 2026, here is a draft for your TradingView Publication.
This trade setup focuses on a Short (Bearish) position for GRMOVER (GRM Overseas Ltd) on the 15-minute timeframe.
Short Setup: GRM Overseas (GRMOVER)
Trade Overview
Asset: GRM Overseas Ltd (NSE: GRMOVER)
Timeframe: 15-Minute
Position: Short (Sell)
Strategy: Rejection at resistance following a recent distribution phase.
Technical Analysis
The stock has shown significant volatility in early January. After hitting a high near 175.50, it has struggled to maintain upward momentum.
Price Action: The chart shows a failure to sustain levels above 172. The current price is hovering around the 170 mark, which is acting as a pivot point.
Risk/Reward: This setup targets a move back toward the lower support zones established in late December.
Recent Context: The stock recently processed a 2:1 bonus issue (late December 2025), which has increased liquidity but also led to profit-booking at higher levels.
Trade Parameters
Level Type Price Level
Entry Range 168.50 – 170.20
Stop Loss (SL) 174.80 (Above recent swing high)
Take Profit (TP) 146.00 (Targeting major support)
Risk/Reward Ratio Approx. 1:4.5
Market Sentiment & Risks
Bearish Trigger: A break below the 165 support level would confirm the downward momentum toward the primary target.
Risk Note: GRM Overseas is currently in a "Strong Trend" phase (ADX ~39). If the broader FMCG sector rallies, the stop loss at 174.81 must be strictly honored to avoid a squeeze back toward the 52-week high of 185.45.
⚠️⚠️⚠️⚠️⚠️⚠️ DISCLAIMER⚠️⚠️⚠️⚠️⚠️⚠️⚠️
Educational Purpose Only: The information, charts, and analysis provided in this post are for educational and informational purposes only. They do not constitute financial, investment, or trading advice.
Risk Warning: Trading stocks, futures, and options involves significant risk of loss and is not suitable for every investor. You should only trade with capital you can afford to lose.
No Guarantees: Past performance is not indicative of future results. There is no guarantee that the setup described will result in a profit or that the price levels mentioned will be reached.
Personal Due Diligence: I am not a SEBI-registered advisor (or your local equivalent). Always perform your own research and consult with a certified financial professional before making any investment decisions.
Independence: The author of this post shall not be held liable for any financial losses or damages incurred as a result of using this information.

KRBL LtdKRBL stock has been moving in a short-term rising channel, showing strong bullish momentum. Volume is significantly higher on up-moves, and the stock is trading well above the EMA, confirming bullish strength
Buy only if the stock sustains above 420 | Target 465 | Exit if stock falls back below 415.

KRBL GOOD TO STUDYNSE:KRBL
Good to keep on the radar
Always respect SL & position sizing
========================
Trade Secrets By Pratik
========================
Disclaimer
NOT SEBI REGISTERED
This is our personal view and this analysis
is only for educational purposes
Please consult your advisor before
investing or trading
You are solely responsible for any decisions you take on the basis of our research.

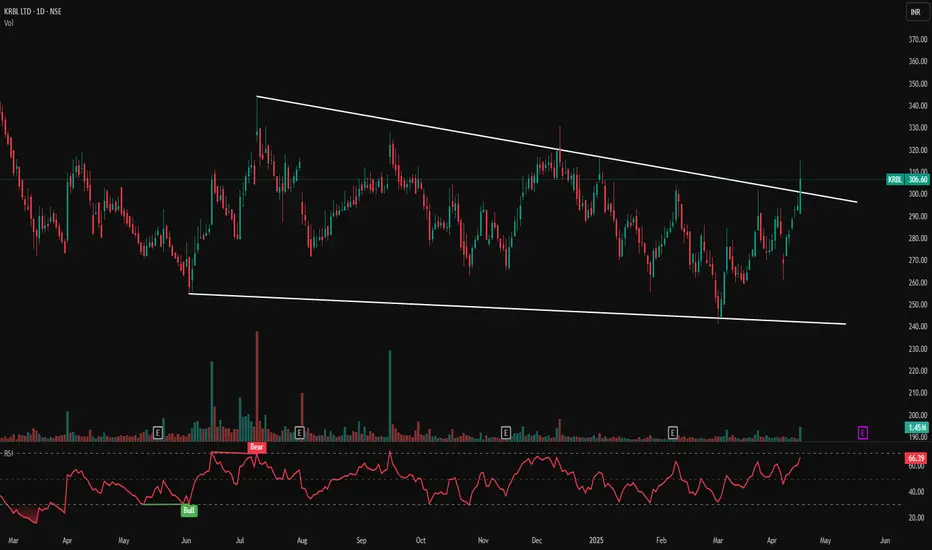
KRBL LTS- Falling Wedge Breakout | Trend Reversal Signal Ahead?KRBL LTD – Falling Wedge Breakout 💥 | Trend Reversal Signal Ahead?
📅 Published on: April 17, 2025
📈 Technical Analysis:
KRBL has shown a bullish breakout from a long-term falling wedge pattern on the daily chart — a classic reversal pattern signalling a potential upward move after prolonged consolidation. The breakout candle is supported by strong volume and a bullish RSI setup.
Pattern: Falling Wedge (Bullish)
Breakout Price: ₹306.60
Previous Resistance Line: Now acting as support
Breakout Volume: 1.45M (above average)
🧭 Key Support & Resistance Levels:
Immediate Support: ₹290
Major Support: ₹275
Immediate Resistance: ₹315
Next Resistance Zone: ₹330 – ₹345
Trendline Resistance (Broken): ₹300 (now support)
🔍 Indicators:
RSI (Relative Strength Index):
Current RSI: 66.39 — bullish, nearing overbought zone, shows strong momentum.
RSI Bullish Crossover observed in April, indicating accumulation before breakout.
🧠 Price Action Observations:
Price respected the wedge formation since March 2024.
A strong bullish candle broke above the upper wedge with conviction.
RSI confirms strength, aligning with price action breakout.
Volume surge supports the breakout's validity.
📌 Strategy (For Educational Purposes):
Entry: ₹305–310 (on retest)
Stop Loss: ₹285 (below wedge support)
Targets:
₹330
₹345
₹360+
📊 Visual Markings & Icons:
White Trendlines: Highlighting falling wedge support and resistance.
Bullish RSI Tags: Marking key bullish RSI crossovers.
Volume Spikes: Notable on breakout day.
Breakout Candle: Large green candle breaching the upper wedge line.
⚠️ Disclaimer:
This analysis is for educational and informational purposes only. Please consult your financial advisor before making any trading decisions.
KRBL: Rising Momentum Amid Price ConsolidationTechnical Analysis of KRBL:
KRBL is currently showcasing significant increase in trading volume, accompanied by a rise in weekly momentum. The price remains constricted within the range of 270 and 330, indicating a phase of consolidation. The stock is likely to experience minor fluctuations before making a potential upward move. Key resistance points, R1, R2, and R3, have been identified and will play a crucial role in determining the stock's future direction.
Potential Risk:
The primary risk to the stock's upward trajectory is the possibility of a broader market correction, particularly influenced by uncertainty in the Index.
Disclaimer:
This analysis is intended for educational purposes and is not a recommendation to buy. It is important to learn how to recognize and understand patterns in stock movements.

KRBL - Showing weakness - At a make or break area!!Price analysis & Overview:
1. Trading near the lower range of the channel.
2. Volumes are good
3. Buyers are not showing strength.
4. Prices are rejecting from EMA.
- Stay tuned for further insights, updates and trade safely!
- If you liked the analysis, don't forget to leave a comment and boost the post. Happy trading!
Disclaimer: This is NOT a buy/sell recommendation. This post is meant for learning purposes only. Please, do your due diligence before investing.
Thanks & Regards,
Anubrata Ray

KRBL 1 MKrbl Monthly Timeframe Uptrend ( PE RATIO :- 11.8 )
Buying gown 300 entry price
KRBL is worlds leading basmati rice producer and has fully integrated operations in every aspect of basmati value chain, right from seed development, contract farming, procurement of paddy, storage, processing, packaging, branding and marketing
Share Huye Ya Insaan Jana To Upar Hi Hai.....

KRBL Good to keep on RadarNSE:KRBL
Its on the verge of new Breakout
Good to keep on the radar
Always respect SL & position sizing
========================
Trade Secrets By Pratik
========================
Disclaimer
NOT SEBI REGISTERED
This is our personal view and this analysis
is only for educational purposes
Please consult your advisor before
investing or trading
You are solely responsible for any decisions
you take on basis of our research.

KRBL: 100% upmove possible➡️promoter holding up
➡️stake held by Reliance
➡️ highest ever sales, PAT and reducing debt
➡️100% upmove possible and a multi-year breakout
Disc: already invested

KRBL | Swing Trade📊 Details
KRBL is worlds leading basmati rice producer and has fully integrated operations in every aspect of basmati value chain, right from seed development, contract farming, procurement of paddy, storage, processing, packaging, branding and marketing.(Source : 202003 Annual Report Page No:181)
Disclaimer: This analysis is solely for educational purposes and does not make me a SEBI registered analyst.
If you found this analysis helpful, I encourage you to like and share it. Your observations and comments are also welcomed below. Your support, likes, follows, and comments motivate me to consistently share valuable insights with you.
🔍 More Analysis & Trade Setups 🔍
For more technical analysis and trade setups, make sure to follow me on TradingView: www.tradingview.com

KRBL Analysis Stock has given BO on all TF chart (M,W & D) with good volume build up, may head to complete round bottom pattern, follow chart for proper support and resistance levels.

This Rice stock might rise soon!KRBL is one of the leading stocks in basmati rice export(holding company of India gate brand)
Recently, Indian government has put a ban on non-basmati rice exports which has led to increase in price of basmati rice in the world.
However, despite of the positive news for the stock, no major price change was observed in chart.
The stock is available at a PE of 12 and has a negligible debt with ROE of around 17%.
Technically, the stock is near a strong round number resistance of 400.
Positional traders can keep this stock in watchlist as the risk associated is low and reward is high in a longer term.
Idea is shared only for educational purposes

krbl- inverted H & S- min 40-50% swing tradingkrbl- inverted H & S- min 40-50% swing trading
.
entry: 380
target:495
stoploss: 340
.
.
.
more probability for bullish..
reload chart for clear view
an hour ago
.
use desktop site.
reset chart size for clear view
.
first use " + " in the chart, for zoom..
next rest chart for better view


KRBL Long Idea BUY on dipsKRBL looks forming a reversal pattern near its resistance turned support levels. Stock was in rectangle since Aug 20 and had breakout in sept 22. Same levels of breakout seen approached recently and a reversal from the point suggest rally may be seen. Stop Loss should always be placed below the recent swing low of resistance cum support levels. Primary Target most likely around 60% of rectangle height and final target at 100% of it. Buy on dips in such case is good idea. Keep watch.

Trendline Breakout in Krbl Limited...Chart is self explanatory.
Disclaimer: This is for demonstration and educational purpose only. This is not buying or selling recommendations. I am not SEBI registered. Please consult your financial advisor before taking any trade.

KRBL for more then 50% GainKRBL TREND BREAKOUT
TG on chart
it is on radar more then 50% gain all things are mention on chart please check

KRBL LimitedKRBL:- Stock has given breakout on monthly chart. keep on radar.....
Hello traders,
As always, simple and neat charts so everyone can understand and not make it too complicated.
rest details mentioned in the chart.
will be posting more such ideas like this. Until that, like share and follow :)
check my other ideas to get to know about all the successful trades based on price action.
Thanks,
Ajay.
keep learning and keep earning.

KRBL Technical Analysis KRBL Technical Analysis :-
KRBL has been in up trending channel since last 3 month yesterday it has reached
bottom of the channel, a perfect time to go long and has Potential Profit of 12%

KRBL Short Term SwingKRBL looking good for short term long setup
everything mentioned in chart
Its an ideal setup as trading on harmonic prz rn
Do your own analysis before buying

Krbl on multi year break #krbl
Stock on 4 year resistance area.
Looks good if breaks out.
Wait for breakout.
#vr
