Predictions and analysis
Details: Asset: Karnataka Bank Limited (KTKBANK) Breakout Level: Sustaining above 245 Potential Target: 285 and beyond Stop Loss: Below breakout level or as per risk tolerance Timeframe: Short to medium-term Rationale: Karnataka Bank Limited (KTKBANK) is approaching a potential breakout level around 245. Sustaining above this level could signal a bullish...
After breaking the previous all time high levels (176-194) it went into another base formation of 15 weeks and 18% range. Volumes are decent. Overall PSU Banking sector is hot and showing strength. Now 210-218 shall act as initial support. Main support will be 176-194 which was previous resistance and now it shall act as a support. Weekly close below these...
📊 DETAILS Sector: Bank - Private Mkt Cap: 8,387 cr Karnataka Bank is engaged in providing a wide range of banking & financial services involving retail, corporate banking and para-banking activities in addition to treasury and foreign exchange business. TTM PE : 6.19 (High PE) Sector PE : 25.76 Beta : 1.83 📚 INSIGHTS Strong Performer Stock...
Market Cap: ₹ 8,469 Cr. Stock P/E: 6.25 ROCE: 5.86 % Stock is trading at 0.93 times its book value Company has delivered good profit growth of 29.4% CAGR over last 5 years Symmetrical Triangle Breakout on Daily Time Frame with Long Signal.
NSE: KTKBANK is closing with a bullish swing reversal candle supported with volumes. Today's volumes and candlestick formation indicates strong demand and stock should move to previous swing highs in the coming days. The stock has been moving along the horizontal support for the past few days which is indicating demand. One can look for a 8% to 11% gain on...
#KTKBANK trading above Resistance of 244 Next Resistance is at 375 Support is at 133 Here are previous charts: Chart is self explanatory. Entry, Resistances and Support are mentioned on the chart. Disclaimer: This is for demonstration and educational purpose only. This is not buying or selling recommendations. I am not SEBI registered. Please...
#KTKBANK trading above Resistance of 164 Next Resistance is at 244 Support is at 126 Here are previous charts: Chart is self explanatory. Entry, Resistances and Support are mentioned on the chart. Disclaimer: This is for demonstration and educational purpose only. This is not buying or selling recommendations. I am not SEBI registered. Please...
BUY - KARNATAKA BANK CMP - Rs. 133 Target - 1: Rs. 165 Target - 2: Rs. 190 Target - 3: Rs. 220 . . Technicals - Cup and Handle Pattern . This is just a view by an expert analyst, please invest at your own risk. . Follow me for more!
KTKBank is trending up, possibly target price to hit 190.00 Still very good setup to go up once it clears the line of resistance. Flag and Pole pattern has already given a breakout followed by two legged correction. Spike phase is still trending on daily chart. SL can be very well placed at the pullback showed at 146.35 or more comfortable one can be at...
Stock Name - The Karnataka Bank Limited Ichimoku Cloud Setup : 1). Today's close is above the Conversion Line 2). Future Kumo is Turning Bullish 3). Chikou span is slanting upwards All these parameters are showing bullishness at Current Market Price and more bullishness AFTER crossing 174 #This is not Buy and Sell recommendation to any one. This is for...
KTK bank Stage analysis - Stage 2 breakout. Entry - 155-162 SL - 144.8 Note : Only for learning, trade at your own risk.
NSE:KTKBANK Karnataka bank Positional pick All levels and analysis are marked on the chart. This is only for educational purposes only. Always trade with stop-loss. I hope you found this helpful. Please like and comment. Keep Learning, Happy Trading!
#KTKBANK is getting ready for breakout. Looks like IHS pattern to me. So Kept in radar. Accumulated a little --> will add main chunk after breakout confirmation only Still need to check relative strength & momentum as it is PSU bank. Bcuz they don't usually move.
KTKBANK:- breakout soon after 14 year, keep on eye..... Hello traders, As always, simple and neat charts so everyone can understand and not make it too complicated. rest details mentioned in the chart. will be posting more such ideas like this. Until that, like share and follow :) check my other ideas to get to know about all the successful trades based on...
Stock Name - The Karnataka Bank Limited Ichimoku Cloud Setup : 1). Today's close is above the Conversion Line 2). Future Kumo is Turning Bullish 3). Chikou span is slanting upwards All these parameters are showing bullishness at Current Market Price and more bullishness AFTER crossing 113 #This is not Buy and Sell recommendation to any one. This is for...
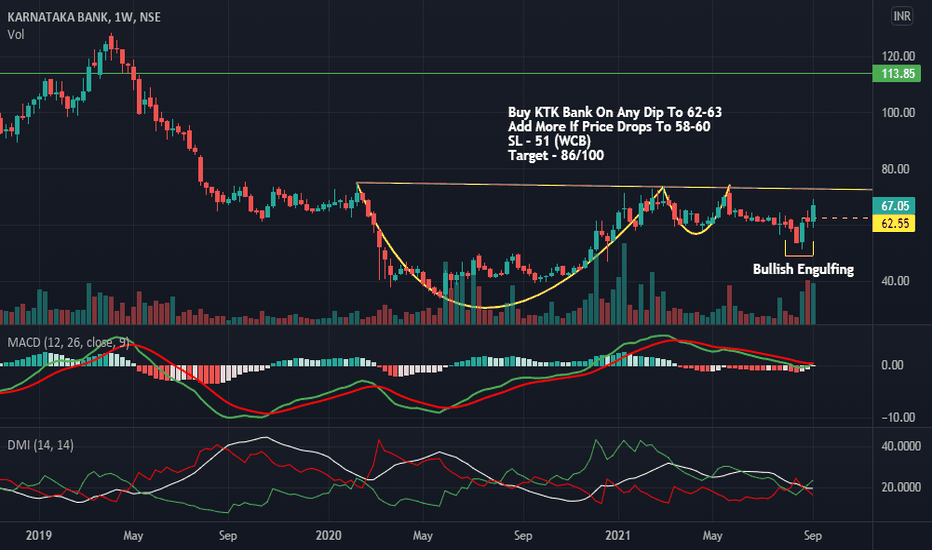
Buy KTK Bank On Any Dip To 62-63 Add More If Price Drops To 58-60 SL - 51 (WCB) Target - 86/100
This is a public swing trade idea and is only for Learning and observational purpose. Please understand your risk and take full responsibility of your actions. I might trail my stoploss after I get an entry but even if my original Stoploss hits, i exit the trade with pre-planned loss (risk). At target, I book usually 75% positions and trail stoploss for rest. ...
Stock Name - The Karnataka Bank Limited Ichimoku Cloud Setup : 1). Today's close is above the Conversion Line 2). Future Kumo is Turning Bullish 3). Chikou span is slanting upwards All these parameters are showing bullishness at CMP and more bullishness AFTER crossing 73. #This is not Buy and Sell recommendation to any one. This is for education purpose and a...


