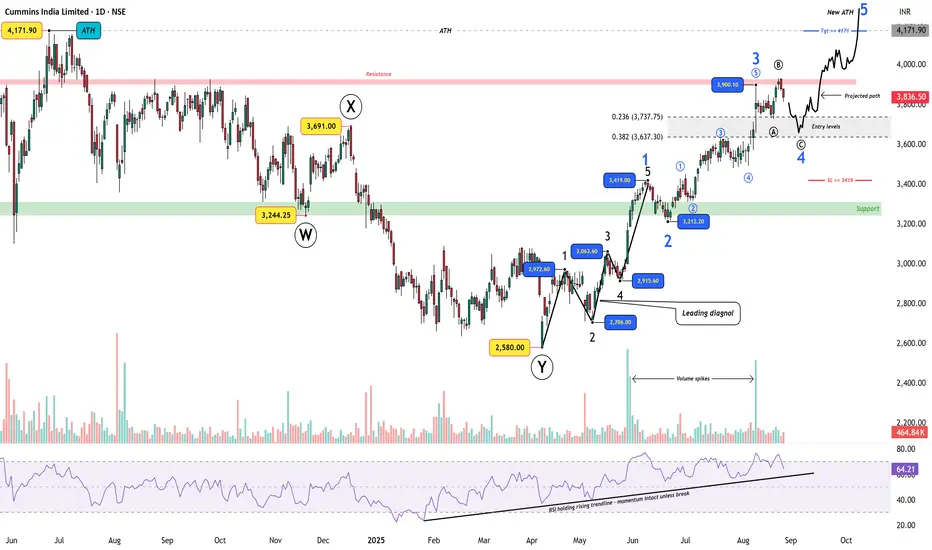
Cummins India – Wave 4 Expanded Flat Before New ATHFrom the 2580 low , Cummins India has likely started a new impulse sequence .
Wave 1 unfolded as a Leading Diagonal , confirmed by messy overlaps and volume spikes.
A sharp Wave 2 retracement was followed by a powerful Wave 3 rally to 3900.
RSI has held a rising trendline throughout, supporting momentum.
Now, price action suggests a Wave 4 Expanded Flat :
Wave A dipped from 3900.
Wave B exceeded the high.
Wave C is projected to retrace into the 3737–3637 Fib zone , offering an entry setup.
Trade Plan:
Entry levels: 3737–3637
Stop loss (SL): Below 3419
Target (Tgt): New ATH at 4171+
RSI remains constructive — momentum intact unless the trendline breaks.
Disclaimer: This analysis is for educational purposes only and does not constitute investment advice. Please do your own research (DYOR) before making any trading decisions.
Leading Diagonal
Trading Psychology & DisciplineIntroduction
In the world of financial markets, traders often focus on technical analysis, fundamental research, algorithms, and news-driven events to make decisions. While these tools are essential, there is one element that is frequently underestimated yet plays a much bigger role in success: trading psychology and discipline.
Trading is not just about numbers, charts, or strategies—it is a game of emotions, mindset, and self-control. Even the most sophisticated strategies fail if the trader cannot control fear, greed, and impulsive behavior. On the other hand, an average trading system can become profitable in the hands of a disciplined and emotionally balanced trader.
This discussion will explore the psychological aspects of trading, the emotional challenges, common behavioral biases, and how discipline can transform a trader’s performance. We’ll also look at techniques and practices to build a resilient trading mindset.
1. The Role of Psychology in Trading
Trading psychology refers to the emotions and mental state that influence how traders make decisions in the market. Unlike professions where skills and experience directly translate into results, trading is unique because psychological factors often override logic.
For example:
A trader may have a solid strategy to exit a position at a 10% profit. But when the time comes, greed makes them hold longer, hoping for more, and the market reverses.
Another trader may see a perfect setup but doesn’t enter the trade because of fear after a previous loss.
This illustrates that psychology can either support or sabotage trading success. Research shows that 80–90% of retail traders lose money consistently—not always because of poor strategies, but due to a lack of discipline and emotional control.
2. Key Emotional Challenges in Trading
Let’s examine the major psychological challenges that traders face.
a) Fear
Fear is the most dominant emotion in trading. It manifests in different ways:
Fear of losing money (not taking a trade).
Fear of missing out (FOMO—jumping into a trade too late).
Fear of being wrong (holding on to losing positions).
Fear often leads to hesitation, early exits, or missed opportunities.
b) Greed
Greed drives traders to:
Overstay in profitable trades.
Over-leverage positions.
Overtrade (taking too many trades in a day).
While the market rewards patience, greed often blinds judgment.
c) Hope
Many traders fall into the trap of hope, especially with losing trades. Instead of cutting losses, they keep hoping the market will reverse in their favor. Hope replaces rational decision-making.
d) Revenge Trading
After a loss, traders sometimes feel the need to recover money immediately. This leads to impulsive trades without proper setups—often resulting in bigger losses.
e) Overconfidence
Success can be as dangerous as failure. After a winning streak, traders may become overconfident, take unnecessary risks, or abandon risk management—leading to devastating drawdowns.
3. Behavioral Biases in Trading
Trading psychology overlaps with behavioral finance, where human biases cloud rational thinking. Some common biases include:
Loss Aversion Bias – The pain of loss is psychologically stronger than the pleasure of gain. Traders avoid booking small losses, leading to bigger ones.
Confirmation Bias – Traders look only for information that supports their trade idea, ignoring opposing signals.
Anchoring Bias – Traders anchor to a certain price level (like the price they bought at) and refuse to sell below it.
Herd Mentality – Following the crowd without analysis, often during market bubbles.
Recency Bias – Giving more weight to recent outcomes rather than long-term performance.
These biases affect judgment and lead to poor decision-making.
4. The Importance of Discipline in Trading
If psychology is the foundation, discipline is the structure that holds a trader’s career together. Discipline in trading means sticking to rules, risk management, and strategies regardless of emotions.
A disciplined trader:
Enters trades only when rules align.
Exits trades at predefined stop-loss or target levels.
Maintains position sizing regardless of emotions.
Accepts losses as part of the business.
Avoids impulsive and revenge trading.
Discipline converts trading from gambling into a professional business.
5. The Mindset of a Successful Trader
Professional traders think differently from amateurs. They focus on process over outcome. Their mindset includes:
Probability Thinking
No trade is guaranteed. Each trade is just one outcome in a series of probabilities. Accepting this reduces emotional pressure.
Detachment from Money
Professionals see money as a tool, not an emotional anchor. They measure success in terms of following their plan, not short-term profits.
Adaptability
Markets change constantly. Disciplined traders adapt rather than stubbornly sticking to failing strategies.
Patience
They wait for high-probability setups rather than forcing trades.
Long-term Focus
Success is measured in months and years, not a single trade.
6. Building Trading Discipline
Discipline is not automatic—it requires conscious practice. Here’s how traders can develop it:
a) Create a Trading Plan
A trading plan defines:
Entry and exit rules.
Position sizing.
Risk-reward ratios.
Markets and timeframes to trade.
Maximum daily/weekly losses.
Without a plan, emotions take over.
b) Use Risk Management
Risk per trade should never exceed 1–2% of capital. Stop-loss orders should be predefined. This ensures survival even during losing streaks.
c) Keep a Trading Journal
A journal helps track:
Why you entered a trade.
Emotions felt during the trade.
What went right/wrong.
Over time, patterns emerge, revealing weaknesses in psychology and strategy.
d) Practice Mindfulness
Mindfulness techniques such as meditation, deep breathing, or visualization help traders stay calm during stressful market conditions.
e) Accept Losses as Normal
Even the best traders lose frequently. What matters is keeping losses small and letting winners run. Accepting losses removes emotional baggage.
f) Avoid Overtrading
Set daily/weekly limits on trades. This prevents emotional exhaustion and impulsive decisions.
7. Practical Techniques to Improve Trading Psychology
Here are actionable steps:
Pre-Market Routine – Spend 10–15 minutes visualizing scenarios, checking news, and calming the mind.
Set Daily Goals – Focus on execution (e.g., “Follow my plan”) rather than monetary goals.
Take Breaks – Step away after a loss or win streak to reset emotionally.
Limit Screen Time – Over-monitoring leads to anxiety. Check setups at predefined times.
Simulation/Backtesting – Helps build confidence in a system before using real money.
Accountability Partner – Sharing trades with another trader builds discipline.
8. Case Studies: Trading Psychology in Action
Case 1: The Fearful Trader
A new trader avoids trades after a big loss. Despite seeing good setups, fear paralyzes action. Over time, opportunities are missed, and frustration builds.
Lesson: Risk management and small position sizing reduce fear.
Case 2: The Greedy Trader
Another trader doubles account quickly during a bull run, but refuses to book profits. Overconfidence leads to leverage, and one market crash wipes out everything.
Lesson: Discipline and humility are essential.
Case 3: The Disciplined Trader
A professional trader takes 40% win rate trades but manages risk with 1:3 reward ratios. Despite losing more trades than winning, account grows steadily.
Lesson: Discipline beats emotions.
9. The Role of Technology and Psychology
Modern trading platforms provide tools like:
Automated trading systems – Reduce emotional interference.
Alerts and stop-loss automation – Enforce discipline.
Analytics dashboards – Help track performance.
But even with technology, psychology remains the deciding factor, since traders often override systems when emotions take over.
10. Long-Term Development of Trading Mindset
Trading psychology is not built overnight. It requires years of consistent practice. Key long-term practices include:
Reading trading psychology books (e.g., Trading in the Zone by Mark Douglas).
Engaging in regular self-reflection.
Accepting that markets are uncertain.
Developing resilience to handle both drawdowns and success.
The goal is to become a trader who is calm in chaos, rational under stress, and disciplined under temptation.
Conclusion
Trading psychology and discipline are the invisible forces behind every successful trader. Strategies and indicators provide the “how,” but psychology answers the “why” and “when.”
Fear, greed, and biases sabotage results.
Discipline enforces consistency and professionalism.
A strong trading mindset focuses on probabilities, risk management, and patience.
Ultimately, trading is not a battle with the market—it is a battle with oneself. Mastering psychology and discipline transforms trading from an emotional rollercoaster into a structured, profitable business.
As the saying goes:
“In trading, your mind is your greatest asset—or your biggest enemy. The choice is yours.”

Trading Master Class With ExpertsReal-Life Applications of Options
Options are not just trading tools; they have practical uses:
Insurance companies use options to hedge portfolios.
Exporters/Importers hedge currency risks using options.
Banks use interest rate options to manage risk.
Investors use protective puts to safeguard their stock portfolios.
Psychology of Options Trading
Trading options requires discipline. Many beginners blow up accounts because:
They buy cheap OTM options hoping for jackpots.
They ignore time decay.
They overtrade due to low cost of entry.
A successful option trader thinks like a risk manager first, profit seeker second.

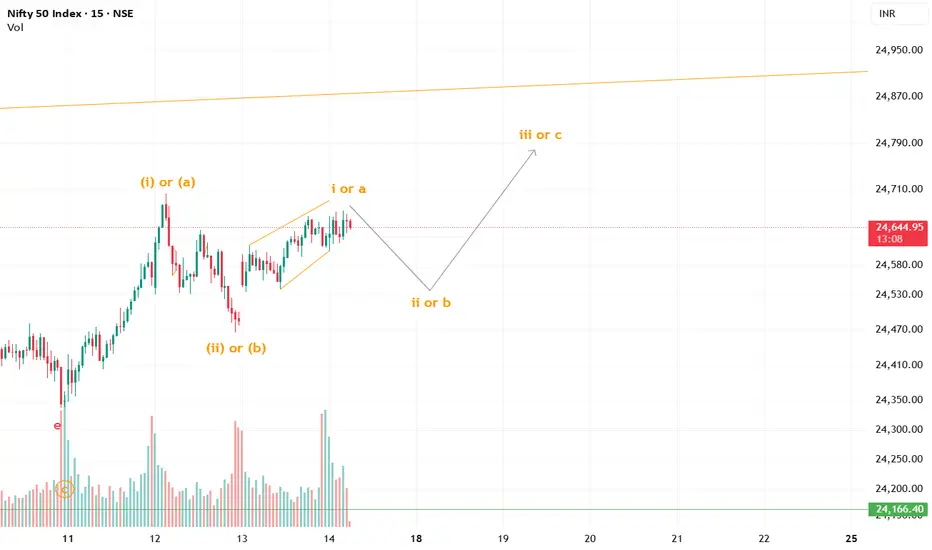
Nifty Elliott Wave Setup Suggests Pullback Before Next AdvanceThe Wave Principle shows Nifty completing a rising wedge in Wave i or a, hinting at a corrective drop to Wave ii or b before launching into Wave iii or c higher.
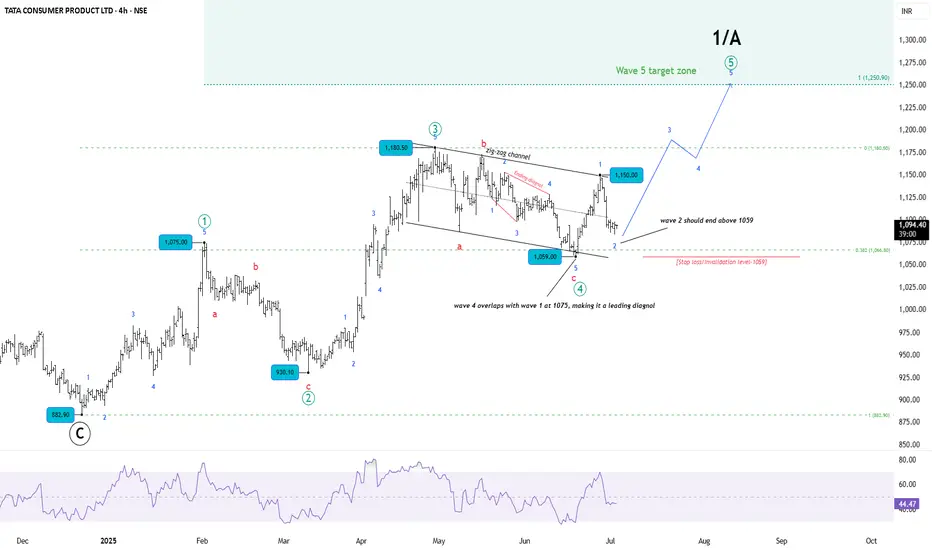
TATA CONSUMER — The Calm Before Wave 5TATA Consumer has completed a textbook corrective structure from its recent high of 1180.50. The entire correction unfolded as an ABC zigzag, neatly contained within a falling channel. Within wave C of this zigzag, price action formed an ending diagonal, with wave 4 overlapping wave 1—confirming the diagonal structure and marking the completion of higher-degree wave 4 at 1059.
This 1059 level also becomes the key invalidation point for the current bullish outlook.
Following this, price broke out impulsively to 1150, forming what appears to be wave 1 of the next leg higher—wave 5. The current pullback is likely wave 2 of 5, and as per Elliott Wave rules, it must remain above 1059 to keep this count valid.
Wave 5 targets are projected using a 100% extension of wave 1 from the end of wave 4, which gives a potential upside zone around 1250.90. This forms the ideal target range if the wave count unfolds as expected. The targets could as well extend to 1.618x of wave 1.
From a higher-degree perspective, since wave 4 overlaps with wave 1 (at 1075), the entire advance is best seen as a leading diagonal. This pattern often appears as the first wave of a new impulse, reinforcing the view that one more leg higher is likely to complete wave 5 and mark the end of wave 1 or A of a larger degree.
RSI had peaked near 70 during subwave 1 of 5 and has now cooled to the 40s, which aligns well with a wave 2 retracement. Earlier, RSI had dipped closer to oversold levels at the Wave 4 low, adding further support to the case for a completed correction.
Conclusion:
We are in prime low-risk, high-reward territory.
Setup is textbook Elliott bullish continuation — tight invalidation and defined structure.
Disclaimer:
This analysis is for educational purposes only and not investment advice. Always do your own research before making trading decisions.
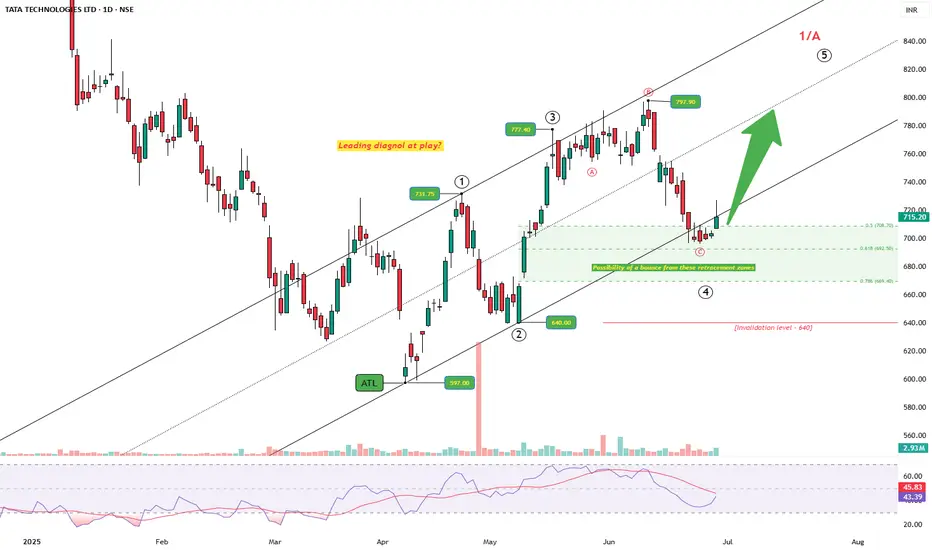
TATA TECH: Messy But Intentional — Diagonal at Work?After tagging the all-time low at 597, price started a steady climb. The structure unfolding looks like a potential leading diagonal, not a typical impulsive sprint. Wave 1 pushes up to 731.75, followed by a sharp drop to 640 — a classic deep Wave 2, but still holding above the origin. From there, Wave 3 stretches to 777.4, slightly longer than Wave 1, keeping things in check.
Then comes the messy drop — choppy, overlapping, three-legged, as Wave 4 of a diagonal. It lands right into the golden retracement zone, finding support between 0.5 and 0.786.
Now the price is bouncing back and is above 715, nudging towards the upper channel. If it sustains, Wave 5 could unfold next, aiming to breach the 797 high. But — and this is crucial — if price falls below 640, this structure breaks down. That would kill the diagonal count and force a rework.
RSI is curling up from oversold, hinting at renewed strength. Price, structure, and momentum — all are beginning to align. Let's see how the price strcuture unfolds in the coming week.
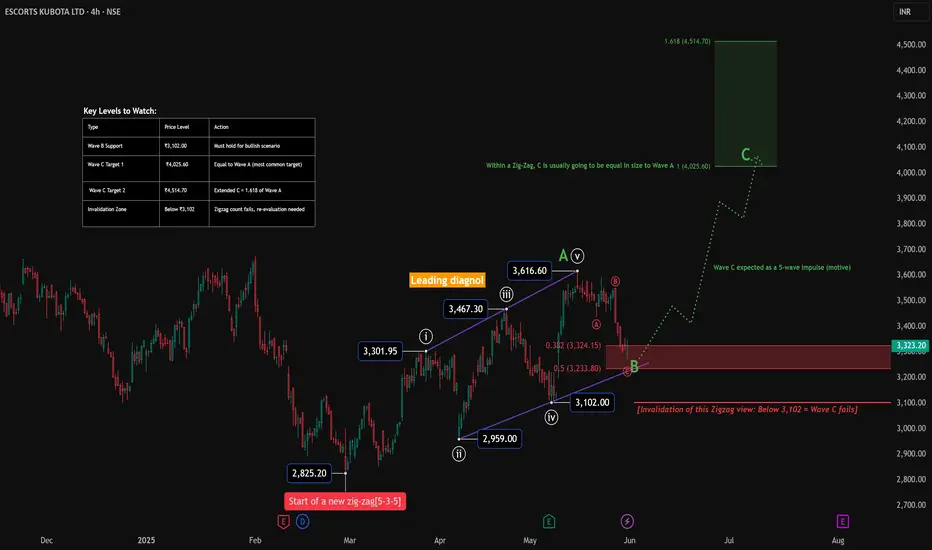
Zigzag in Play- Can Wave C deliver the goods for ESCORTS KUBOTA?ESCORTS KUBOTA – A Zigzag Taking Shape
Structure Summary:
ESCORTS may be unfolding a classic Zigzag correction (5–3–5) from the low at ₹2,825.20. Wave A formed a clean leading diagonal. Wave B is currently developing and is expected to end near the 0.382–0.5 retracement of Wave A.
If this structure holds, we could soon see a powerful Wave C impulse aiming for the 4,000+ zone.
Elliott Wave View:
Wave A : Leading diagonal from ₹2,825.20 to ₹3,616.60
Wave B : Still developing – may complete near ₹3,233.80 (0.5 retracement)
Wave C : Expected to be a 5-wave impulse targeting:
₹4,025.60 (1.0 × Wave A)
₹4,514.70 (1.618 × Wave A)
Key Levels to Watch:
Wave B Support Zone: ₹3,233–₹3,102
Target 1: ₹4,025.60 (equal to Wave A)
Target 2: ₹4,514.70 (1.618 × Wave A)
Invalidation : Below ₹3,102 → Zigzag scenario fails, alternate count required
Note:
Wave C, if it triggers, should develop as a 5-wave impulse. Price action around the retracement zone will decide whether bulls still have control.
Disclaimer:
This is part of the educational WaveTracker series. It is not a trading recommendation.
Always DYOR and manage risk wisely.
Bank Nifty - Is this A Rising Wedge from 47898 As discussed early morning .... 49000 was our key & psychological level ... Index dropped & came close to 48500-48600 zone
Falling From 49000 Level
Support Zone 48500-48600
Makar Sankranti marks the Sun's transition into Capricorn and the beginning of an auspicious period. Historically, equity markets turn optimistic post-Makar Sankranti, driven by cultural sentiment and Budget expectations. Will Budget 2025 keep the trend alive? 🌞
This comes after a 26-day fall in major benchmark indices, which started on 5th Dec 2024.
In the last two days, the index surged from 47,898 to 49,000. However, during the first half of today's session (15th Jan 2025), it fell below 49,000, hitting a low of 48,522 as shown in the snapshots

BankNifty - Did You Miss The Explosive Move from 51000 ? Disclaimer:
This is for informational purposes only and is not a solicitation or offer to buy or sell any securities or products. Consult Your Financial Advisor
As per last idea we proposed that holding 51000 & above BankNifty Index can push upside towards 52050 & Above 52100 - can look for 52900-53100
Happy We achieved 78% of the target & got the maximum points of 1500 points in the Index
Last Idea
What Next ?
Index again forming a similar looking pattern from the highs of 52577 -recent highs & safe traders can look for short term downside moves falling below 52100 towards 51855 - Yesterday's low & 51250 / 51000 respectively.
Regards,
WaveTalks
Abhishek

HDFC Bank / BankNifty - The Giant Cracks & Index Melts 4000 +Disclaimer:
This is for informational purposes only and is not a solicitation or offer to buy or sell any securities or products.
--------------------------------------------------------------------------------------------
Recap from 25th Sep 2024
Giant Crack Alert: BankNifty’s drop from 54,467 on 26th Sep 2024 to 50,194 by 7th Oct 2024 got its hint from the HDFC idea published on 25th Sep. When a giant like HDFC cracks, imagine the shockwaves across the entire index!
HDFC - Will it take U-Turn from 1800 — Indeed It was giant crack from 1788
---------------------------------------------------------------------------------------------
Short Term
Strong Support Zone
50900-51000 - Avoid taking any buy or long positions below 51000 . Safe Traders to Buy if Index crosses above 51356 & holds above. Risky Traders can look for buying opportunities until Index holds above 51000 or drops close to 51000
Minor Resistance
51925 - 52050 is the minor resistance zone so any bounce upside holding 51000 can halt in this zone & crossing above 52100 - It can push towards strong resistance zone 52900-53100
Strong Resistance
52900-53100
Wishing You A Happy & Prosperous Diwali 2024
From WaveTalks
Abhishek

BankNifty ( Elliott Wave) - Will 51700+ Be The Short Term TopDisclaimer:
This is not a solicitation to buy or sell any financial instruments. Please consult your financial advisor.
Explore the latest Bank Nifty analysis with WaveTalks. Will 51700+ be the short-term top? Discover insights and potential market moves as we decode the whispers of the market. Stay informed with WaveTalks - Market Whispers!
Let's Jump In ...
As discussed in the last idea published on 29th August, it was suggested that holding the 50938 / 50939 critical level, Index can make new highs beyond 51404 which is very much possible. The market tested traders' patience on Friday, 30th August, and continued to do so on Monday, 2nd September, and even on 3rd September, with many feeling the urge to give up. However, bulls were fortunate as a last-minute explosive move took BankNifty from 51400 to 51750—a 350-point jump towards the end of the session.
Now, with U.S. markets trading in deep red, with major indices like S&P, Dow, and Nasdaq all down more than 1%, the big question arises: Has the BankNifty pattern we’ve been discussing since last week finally completed? Are we about to fall below 50939, potentially slipping down to the 50300 support level?
Only time will reveal the answers to these questions.

Maruti Suzuki - Will it fly Above 12555 Disclaimer:
This is not a solicitation to buy or sell. Consult your Financial Advisor before trading.
-----------------------------------------------------------------------------------------------
As discussed earlier on 19th Aug ...Above 12555 ...Will Maruti Make An Attempt to Fly & Will it reach the upper trendline & make new highs beyond 13680
Will it Complete One of the Most Important ElliottWave Structure & Its pending Wave 5 on Upside
What Level You Should Avoid Trading ? So Many Questions But Only time Know's the Exact Answer
Catch Me in Next Episode of WaveTalks- Market Whispers! Can You Hear Them? ....

BankNifty -Tower Bottom Unveiled: Bulls Magical SpellWaveTalks - Market Whispers! Can You Hear Them?...
August 13th: The Bulls' Last Stand
As we approached August 13th, 2024, the market was rife with tension. With stops being hit left and right, I made it clear at 12:55 pm in the last post that the bulls weren’t giving up without a fight. It was a crucial moment—one where patience and strategy were key. The market flirted with disaster, yet I advised holding the line, suggesting that the critical level… would be our stronghold.
August 14th: The Calm Before the Storm
The following day was a test of nerves. The market kept everyone guessing, moving in unpredictable waves. But I didn’t waver. I updated my social media followers, pointing out that while the expected gap-up didn’t materialize, it was a blessing in disguise. Why? Because it set the stage for an even bigger opportunity. I highlighted that crossing 49,960 could trigger an upside move for safe traders , while risk-takers should stay alert as some kind of accumulation happening close to 49654.
August 16th: The Magical Spell Unfolds
Post-Independence Day, on August 16th, the market delivered a performance that was nothing short of magical. It was as if the entire week had been leading up to this moment. The day began with a gap-up ( Instead of green big candle it was gap up equivalent to bullish green tower required for Tower bottom patter with accumulation in between), and after briefly retracing to the 49,870s, Bank Nifty launched into a powerful rally, surging past 50,500. This move confirmed the formation of a Tower Bottom pattern—a bullish candlestick formation that signaled the beginning of a new uptrend- is it a new up trend or some relief to bulls, only time knows -what next?
The Tower Bottom: A Bullish Reversal
This Tower Bottom pattern wasn’t just any signal; it was the market’s way of announcing that the accumulation phase at 49,654 had reached its tipping point. With this pattern confirmed, the path to 50,800+ became clearer than ever. The market, as I’ve always said, is a battlefield where only the swift and the strategic survive. Those who heeded the call to cut losses quickly if the key levels broke were well-prepared for this bullish reversal.
The Road Ahead: 50,800+ in Sight
With the Tower Bottom pattern in play, Bank Nifty is now set on a course towards our first target of 50,800+. This move is a testament to the power of technical analysis, patience, and unwavering discipline. The market has shown its hand, and for those who were ready, the rewards are already being reaped.
This was not just a trade—it was a lesson in precision, timing, and understanding the subtle cues of the market. The week may have been truncated, but the gains were anything but small. Keep your eyes on the prize as we approach our next milestone, for the journey is far from over.
Regards
WaveTalks

Nifty Reaches 24,500 Target: Elliott Wave Analysis Disclaimer:
------------------------
Trading in financial markets involves substantial risks. Consult your financial advisor before making decisions. This commentary is not a solicitation to buy or sell.
WaveTalks - Market Whispers: Can you hear them?
----------------------------------------------------------------------------------------------
General Election 2024: Impact on Nifty
The 2024 General Election resulted in a clear victory for the existing NDA government, with Prime Minister Narendra Modi securing a third term. This political stability had a positive impact on the Indian market index, Nifty.
-----------------------------------------------------------------------------------------------
Pre-Exit Poll Movement
Before the election results were declared, we proposed an outlook for Nifty to reach 24,500 as a pre-exit poll objective. This prediction was published on TradingView as "Pre-Exit Poll Outlook - Bulls above 22,400 " on 31st May 2024.
-----------------------------------------------------------------------------------------------
Achievement of Target
Following the election results, Nifty saw a significant rise from the lows of 21,281 on June 4, 2024, and successfully reached our proposed target of 24,500 on July 12, 2024. However, there was a knee-jerk reaction as the index failed to surpass the 400-seat mark announced during the election campaigns, leading to some volatility when the actual results were declared on June 4, 2024.
-----------------------------------------------------------------------------------------------
Unfolding Structure: The Leading Diagonal
Since early March 2024, we have been discussing the potential for an explosive upside based on a leading diagonal pattern, also known as a Rising Wedge in traditional analysis. This Elliott wave pattern typically indicates a bullish trend, especially in the context of the 2024 General Election. We believed in the bullish scenario and termed it the "Leading Diagonal," expecting significant market movement.
-----------------------------------------------------------------------------------------------
Why I Believe in Wave Analysis
As a Wave Analyst, my journey began with a curiosity about the market's patterns and behaviors. Eight years ago, in 2016, I started writing for TradingView and was given an opportunity to look into India Business for the brand during its early expansion years in India. On a personal front, I progressed to learn the nuances of wave analysis and started applying them to publicly traded liquid financial instruments. The results were astounding, providing 90-100% accuracy in the analysis. The science behind wave analysis is robust, but it does come with the limitation of alternate views if the price breaches the cardinal rules. More details on this will be discussed in my upcoming book on wave analysis (no ETA available at the moment).
-----------------------------------------------------------------------------------------------
Pattern Analysis
Rising Wedge:
Often seen as bearish or bullish from a traditional technical analysis point of view, Elliott Wave analysis goes one step further by identifying the pattern's nature as bullish or bearish and can complement the unfolding events.
General Election 2024:
The election acted as a catalyst for the bullish trend.
Patience Rewarded:
Participants who held their positions since October 2023 are now reaping the benefits.
-----------------------------------------------------------------------------------------------
Future Outlook
Key Psychological Level: 24,500
Nifty holding above the 24,500 level is crucial. If the index continues to bounce above this level, we anticipate the bull run to persist.
Target: 27,620
Our next target is 27,620, where the current rising wedge in Wave-1 should travel 162% of the minimum distance if this is to be Wave-3.
-----------------------------------------------------------------------------------------------
Additional Insights
Reliance Long Term:
Nifty Explosive Series Episodes Starting Comex Copper:
These episodes as published on TradingView earlier, hinted at an explosive Nifty to unfold and how Dr. Copper’s move supported the outlook. This should be discussed as a different branch of technical analysis called Intermarket relations in my book, suggesting a strong bullish sentiment.
In conclusion, the political stability from the 2024 General Election has propelled Nifty into a strong bullish trend, with a key psychological level at 24,500 and a future target of 27,620.
-----------------------------------------------------------------------------------------------
Regards From WaveTalks
Abhishek

Banknifty - Leading Diagonal Scenario (Fall 51800 to 51000)As we discussed in the Sunday Video... This is the alternate scenario of waves unfolding & if Index faces resistance in 51800-51900 zone, it can slip & complete the proposed 5th wave of an unfolding leading diagonal downside.
Strictly ------No Sell ---------Above 51800 ---------------------------------------------------
Downside Target - 51000 Approx.
From WaveTalks
Abhishek

Nifty Explosive (Part 3): From 22,000 to 23,000 in Record Time!
Disclaimer:
Trading in financial markets involves substantial risks. Consult your financial advisor before making decisions. This commentary is not a solicitation to buy or sell.
WaveTalks - Market Whispers: Can you hear them?
-----------------------------------------------------------------------------------------------
Nifty Index Outlook - May 24, 2024
Overview
In our last analysis, we emphasized the importance of having both a primary plan (Plan A) and an alternative plan (Plan B). This approach prepares us for achieving similar outcomes through different routes. If Plan A fails, we quickly switch to Plan B. A strong alignment between both plans often predicts significant market movements.
Recent Market Movements
In our last discussion on the Nifty Index in the "Nifty: Explosive Part 2 - Towards 23,000+" series, we predicted a rally if the Nifty crossed the 22,000 mark. Indeed, Nifty surged nearly 1,000 points in just 10 days, closely aligning with our predictions and nearly touching the 23,000 mark.
Last Idea - Nifty : Explosive Part 2 - Towards 23000+
Current Market Outlook
Key Levels to Watch:
- Immediate Resistance: 23,000
If Nifty surpasses the 23,000 mark, it will confirm that the bulls are in charge, echoing the market optimism that began in early 2014, a period that marked a significant turning point after years of struggle.
Future Expectations
Looking ahead, the next crucial juncture is whether Nifty can sustain its momentum above the 23,000 level or if it will face resistance. Surpassing 23,000 would be an extremely powerful signal, indicating readiness for a significant breakthrough before the 2024 General Election results are announced.
Facing resistance below 23000 mark, a pause & bulls come back before election results are out on 4th June 2024.
Conclusion
The Nifty Index's performance has closely aligned with our previous analyses, demonstrating strong potential to surpass the 23,000 level. As the market approaches this critical threshold, our dual-plan strategy continues to guide our expectations and strategic decisions, ensuring we're well-prepared for various market scenarios.
From WaveTalks
Abhishek

Comex Copper = Explosive Nifty to Unfold in 2024 ?Disclaimer:
Trading in financial markets involves substantial risks. Consult your financial advisor before making decisions. This commentary is not a solicitation to buy or sell.
WaveTalks - Market Whispers: Can you hear them?
-----------------------------------------------------------------------------------------------
Copper Outlook
---------------------------
1. Setting the Stage for Explosive Moves:
- Copper is recognized as a barometer of economic growth, and its performance can provide insights into broader market movements.
- In January 2023, I predicted copper would see explosive growth in 2023-2024. This was confirmed in November 2023 when the corrective wave 2 completed in a truncated wedge pattern, providing a strong foundation for significant gains.
Comex Copper in Nov 2023 ( Explosive Wave to Unfold Next?)
---------------------------------------------------------------------------
2. Rising Demand:
- Copper cathode demand reached 598,000 tonnes (81.2% of the previous year's total) by November 2023.
- Imports of copper cathode, scrap, and wire rods soared by 174%, 56%, and 13% year-on-year, respectively.
- This robust demand hints at double-digit growth in FY24. The Indian government's focus on infrastructure, clean energy, and consumer spending is expected to sustain this growth.
3. Production Challenges and Future Solutions:
- India's smelting capacity was halved due to facility closures, turning the nation from a net exporter to a significant importer.
- The upcoming Adani smelter (5 lakh tonnes capacity) and potential reopening of the Sterlite smelter in 2024 could help India reclaim its status as a net copper exporter.
Nifty / BankNifty Outlook
-------------------------------------
1. Explosive Moves Expected:
- The Nifty index started forming a well know rising pattern around the 18,800-19,000 zone in October to November 2023, suggesting a significant move ahead. This famous pattern was rising wedge.
- This pattern was debated on WaveTalks as either an ending or leading diagonal, offering different implications for future market moves.
2. Elliott Wave Analysis Insights:
- Applying Elliott Wave Analysis gave clarity to potential market paths, allowing for strategic decisions at tops and bottoms.
- As patterns unfolded as expected for Copper, the market outlook became increasingly clear for equities as Copper is a barometer of economic growth.
3. Conclusion:
- The Indian equity markets, particularly Nifty and BankNifty, appear set for more explosive moves.
- Time will reveal how far the markets can go, but the whispers of the market suggest significant growth ahead.
Signing off from WaveTalks: Market Whispers! Can you hear them?
From WaveTalks
Abhishek

EURUSD Fall - Classic Equality Count in Play | C = A WaveDisclaimer:
Trading in financial markets involves substantial risks. Consult your financial advisor before making decisions. This commentary is not a solicitation to buy or sell.
WaveTalks - Market Whispers!, can you hear them
13th Jan 2024 - B: Wave completed at the tops of 1.11393
Long Term Outlook
From its low at 0.95358, we're seeing a leading diagonal wave signaling a potential long-term uptrend. As previously discussed, big gains might be ahead. Once short term completes & the base is formed as discussed in short term analysis, EURUSD will move into next sequence of wonder to behold waves which is Wave 3. Let us wait & have patience for magic to unfold.
Short Term Outlook
It's building a base, possibly dipping to 1.02-1.04, a 50-61.8% retracement from the 0.95358 low to the 1.12757 high in July 2023.
Wave C = Wave A falls to 1.03118 falls in the projected zone suggesting a stronger possibility for Wave-C ending in the box zone 1.02 to 1.04 as discussed earlier
From
WaveTalks
(Market Whispers!, Can you hear them)
Abhishek

minor update on previous chart sumitomo chem ....every thing looks alike as previous chart. i just tabled the first wave of the new emerging wave in a detailed manner than the previous chart. a minor update

Nifty 50- Elliot Wave Count SHORT!Attached: Nifty 50 Hourly Chart as of 25th April 2023 EOD
A Leading Diagonal in form of ABCDE in Wave 1/ A and then a Pullback in Wave 2/ B
And Now the 3rd Wave/ C Wave has started
Targets for this Wave Down are anywhere from:
17600 to 17340
Note: Alternatively the Leading Diagonal could also be Wave 4 and 5th Wave is complete and so Wave 2 can Dip down to Previous 4th Wave Low which also comes to approx 17575 as our 1st Target

Nifty move will decided based on the initial move follow nifty can form expanded flat whose important fibo level is mention is the chart
or nifty could form leading diagonal as show in the figure

HCLTECH- Bears in Control!Attached: HCLTECH Daily Price Chart Live Market as of 20th April 2023
Pay attention to the following:
1) Formation of a Double Top/ Distribution Pattern
2) A Leading Diagonal Structure marked as ABCDE , so a 3rd Wave Down can play out
3) The Elliot Wave marking signaling end of (B) Wave and (C) Wave Down pending
IT Sector is the Weakest already and there are clear Headwinds from a Fundamental standpoint for IT Stocks
HCL Technologies has Earnings today so you can expect some Big Move on the Short Side

Leading diagonal wave 3 expected Explained in the chart . Leading diagonal in wave 1 will correct to max 23.6% - shallow correction - but it is a time correction .
