NSE:ZEEL trading @ resistanceNSE:ZEEL
#NSE:ZEEL trading bullish @ resistance, post breakout confirmation may give good momentum.
Potential marked on chart for practice(Not for trading)
Happy LEarning
Learningtrading

EURJPY DropEURJPY currently a very good sell zone let's wait & see hoe market react in this analysis .

cypher harmonic pattern #Learning #StockMarket #StockIdeas The cypher pattern trading strategy teaches traders how to correctly trade and draw the cypher pattern. The cypher harmonic pattern can be used on its own and provide traders a profitable forex trading strategy.
It is not surprising that geometric patterns are used in forex charts. And the cypher harmonic pattern is a very good representation of that. The pattern is part of the harmonic trading patterns and is the most exciting harmonic pattern because it has the highest winning rate.
This is one of the few patterns not identified by Scott Carney. It was discovered by Darren Oglesbee, and though it is technically an advanced pattern formation, it is often linked with and traded together with harmonic patterns. It has particular Fibonacci measurements for every point within its structure.

Marico trend line breakout confirmedMarico weekly, upper trend line broken and retest completed. Stock will now take the purple trend line as support.
#learningcharts

Cipla Swing tradeCipla: Positional and Swing pick!!!
Method: Top-down approach
The uptrend on the monthly time frame,
Upside channel breakout on weekly time,
Symmetrical triangle pattern on the daily time frame
Enter if price closes above triangle pattern confirmed by good volume
Remember the rule: Trade what's happening...not what you think is gonna happen
Risk management:
CMP= 957
Enter at 970
Stop loss at 945
Target -1025 / 1050
Risk only 2% of your capital
Risk: reward = 1:2.2
Psychology
Note= Trade with probabilistic mindset no matter how much analysis you do there is always 50-50% chance
Our main objective is to '' Cut your losses short and let your profits run.''
Remember to be profitable you don’t have to be right every time,
you just have to be right big and wrong small.

CUP & HANDLE PATTERN?CUP AND HANDLE ON INFY AT 15 MIN CHART. BULLISH PATTERN. PLEASE HELP WITH ANY FEEDBACK OR SUGGESTION.
THIS IS NOT A TRADING ADVICE. I'M STILL LEARNING

Ascending Triangle Chart Pattern (Continuation Pattern)An ascending triangle is a chart pattern used in technical analysis. It is created by price moves that allow for a horizontal line to be drawn along the swing highs, and a rising trendline to be drawn along the swing lows. The two lines form a triangle. Traders often watch for breakouts from triangle patterns. The breakout can occur to the upside or downside. Ascending triangles are often called continuation patterns since the price will typically breakout in the same direction as the trend that was in place just prior to the triangle forming.
Important Points to look at -
The trendlines of a triangle need to run along at least two swing highs and two swing lows.
Ascending triangles are considered a continuation pattern, as the price will typically breakout of the triangle in the price direction prevailing before the triangle. Although, this won't always occur. A breakout in any direction is noteworthy.
Increasing volume helps to confirm the breakout, as it shows rising interest as the price moves out of the pattern.
A minimum of two swing highs and two swing lows are required to form the ascending triangle's trendlines. But, a greater number of trendline touches tends to produce more reliable trading results. Since the trendlines are converging on one another, if the price continues to move within a triangle for multiple swings the price action becomes more coiled, likely leading to a stronger eventual breakout.
A triangle is a type of consolidation, and therefore volume tends to contract during an ascending triangle. As mentioned, traders look for volume to increase on a breakout, as this helps confirm the price is likely to keep heading in the breakout direction. If the price breaks out on low volume, that is a warning sign that the breakout lacks strength. This could mean the price will move back into the pattern. This is called a false breakout.
$ = Liquidity

Using The Fibonacci Retracement and Extension levels I've explained how can can use Fibonacci levels in trading using example of NSE:TATA STEEL
. Firstly know your trading perspective, and choose your chart time frames accordingly
. Now use higher time frame chart and draw FIBONACCI RETRACEMENT TOOL from bottom to top(in Uptrend)
and top to bottom (in downtrend) for current trend.
. Mark the levels using horizontal line, near stock is trading currently
. Use smaller timeframe to get retracement levels in uptrend or in downtrend, and now make Fibonacci extension levels from top to bottom(in uptrend)
and bottom to top(in downtrend) for current swing
. Mark all the important levels, these will work as support and resistance
. Now, using RSI,MACD,EMA sets you can trade your position for these levels
HAPPY LEARNING AND START INVESTING

CTSI ConsolidatingCTSI consolidating and looks good to go up if market conditions remain stable. Volume seems to show increase in buying pressure .
Share ur thoughts!

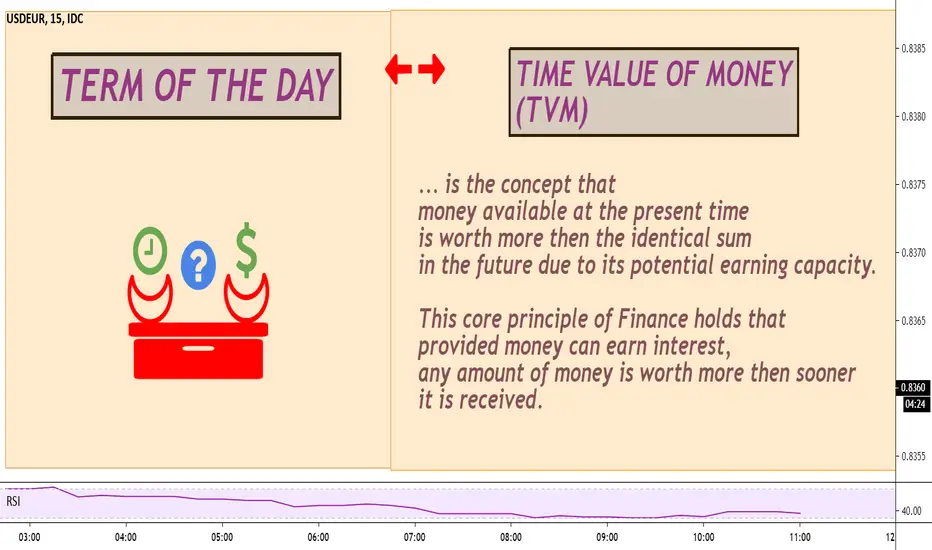
✨TERM OF THE DAY✨ = TIME VALUE OF MONEY (VIEW SHARED AS READ)... is the concept that
money available at the present time
is worth more then the identical sum
in the future due to its potential earning capacity.
This core principle of Finance holds that
provided money can earn interest,
any amount of money is worth more then sooner
it is received.
disclaimer - shared what i read, learnt, applying
#RISEnSHINETOGETHER-SHARE WHAT U READ TO UNDERSTAND MORE DEEPLY Part 1 – Methodology Plan
This is the framework of your trading plan. Without thoroughly making these decisions, your plan may not be fluid.
Part 2 – Your Money Management Plan
Money management is the most important part of the plan. This is where you should understand how “risk of ruin” relates to your trading.
When calculating your risk of ruin, any number above zero is too high. That means you will eventually blow up your account in a matter of days, weeks, or months.
Part 3 – Trading Psychology
Psychology is the journalism section. Journaling is a mental support system, gives way to ground yourself and your thoughts. It helps to place you in a mindful state to clear clutter, bring clarity and problem solve.
Part 4 – Using the best tools for trading success
Lastly, which tools will you be going to use in order to facilitate your trades?
PLEASE LIKE, SHARE, LEARN
EDUCATE OUR OWNSELF AND OUR FELLOW MATES
#RISENSHINETOGETHER

8th June 2020 - INDUSINDBK - Intraday pick for riding the bullWhassup people?
Nifty moved from 9600 - 10280 in 5 sessions .i.e a total of 680 points captured by the index.
The global market sentiment stayed bullish. US markets remained so bullish that even the bankrupt companies are rallying !
Enough of the news, Let's now come to the analysis at hand -
Why watch IndusIndBK for bullish move on 8th Jun?
From the news - NASDAQ touched its lifetime high, I am anticipating a correlated move in the Indian market on 8th June 2020. With the bullish view in mind - INDUSINDBK is a good pick for Intraday buy
From price action perspective - The stock showed a bullish pattern ( ascending triangle on the 15 min TF )
From Eliott waves analysis - - The primary wave is bullish in nature with two of the motive waves (wave 1 & 3) and both corrective wave (wave 2 & 4) already over for the stock prices. Wave 4 was an impulsive correction following the rule of alternating corrections. The stock is at present in 5th wave.
The 5th wave is exhausted which is why it is forming the triangle pattern.
As per the rule, The maximum height of the exhausted 5th wave is the height of wave 3 which stands at 448 rs.
How to trade?
We will plan the trading strategy using MAEE (market structure, Area of value, Entry trigger and Exit trigger) formula
Another jargon?!! Just bear with me for a minute - Its a useful jargon and you will know why as you will read further
Based on my experience, the probability of the move to likely happen is 75% ( why? only the exhausted 5th wave is something of a concern here which is tackled by the overall positive sentiment of the global and local market)
Market Structure - The trend is up as the market has been bullish in the last few days, Price above 200 MA and ATR is decreasing. (Analyzing market structure ensures you are giving respect to the market conditions)
Area of value - The areas of value are at 427 rs which is acting as the current resistance and potential support after the breakout. To further, minimize the risk we will buy the breakout above another area of value at 430 rs and keep the target at the third area of value at 443 rs which will be our target . The last area of value is 448 rs which is the height of wave 3 and our extended target (Analyzing area of value helps you to eliminate risks of false breakouts, find the suitable price to enter and exit)
Entry trigger - Enter at 430 rs with bullish candle formation with high volume acting as the trigger. If you missed the first move then wait for a pullback near the area of value and look for other entry triggers to enter the trade. (Entry trigger helps you time your entry in the market and only from the areas of value where the success probability is high. It helps you control lossess incurred by the fear of missing out )
Exit trigger - Exit the market with a bearish pattern near the area of values of 443 rs and 448 rs. After the first target of 443 rs is hit you can trail your stop loss cost to cost and hitting stoploss with be exit trigger. (Exit trigger helps you know when to exit the trade and minimizes exits on market noise which is market temporarily moving against our analysis and often scaring us to exit the trade early)
That's all guys.
Show your support if you liked this detailed analysis and my trade setup.
Please like and follow for learning more such trading approaches through reading my posts here.
Comment with what do you think.
1 like = 1000 Encouragements
Ankit

ICICI Bank NSE:ICICIBANK
(Note : These charts are only for practice purposes. I am a beginner to trading and my posts are not recommendations.I'm still learning.)

Learning Post : Can we Say it's a Flag Breakout?How can we set the target if Flag Patter is building? More Details on Flag would be appreciated from the Experts and Seniors. Thanks.
