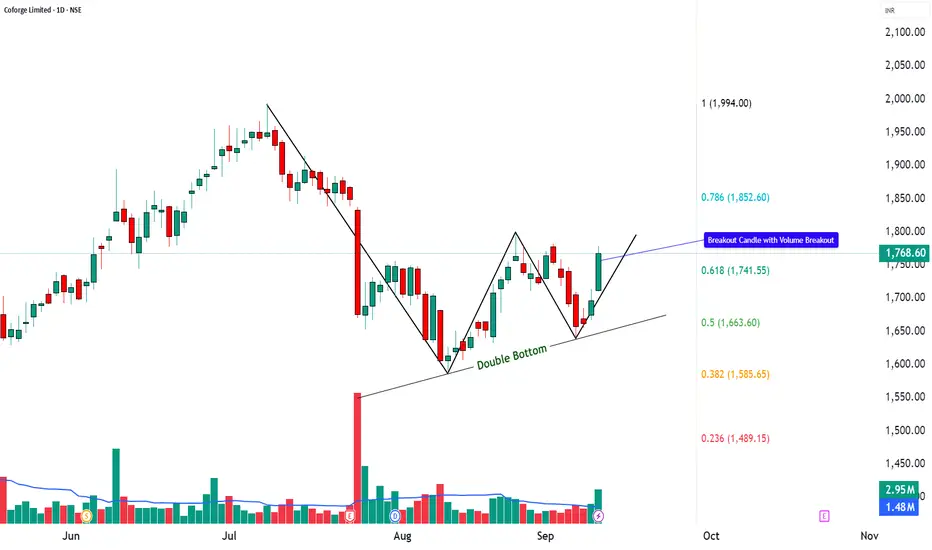
Coforge | Double Bottom Reversal with RSI + MACD Breakout📌 Coforge Ltd. – Closing Price: ₹1,768.60
📊 Technical Indicators Explained
Coforge is showing strong technical signals. A Double Bottom pattern 📉➡️📈 suggests a possible bullish reversal, while a strong bullish candle 🔥 confirms momentum. The RSI breakout ⚡, MACD crossover 📊, and volume surge 🚀 all indicate growing trader participation. With supports holding firm and resistances nearby, the stock is entering a decisive zone.
________________________________________
📈 Bullish Case – Why the stock could go up
Double Bottom signals potential trend reversal.
Strong bullish candle with volume validates buying interest.
RSI breakout + MACD crossover = bullish confirmation.
Fibonacci retracement levels open upside zones towards ₹1,852 – ₹1,994+.
📉 Bearish Case – Potential downside risks
If price fails to sustain above ₹1,726, weakness may return.
Broader market corrections could weigh on momentum.
A breakdown below ₹1,657 would weaken the bullish outlook.
⚡ Momentum Case – Short-term Trading Edge
Strong bullish candle + RSI breakout = near-term strength.
Sustaining above ₹1,780–₹1,800 could push towards higher Fibonacci levels.
Heavy volume indicates short-term traders are active.
📊 Support & Resistance Levels
Support Zones: ₹1,657 | ₹1,683.67 | ₹1,726.13
Resistance Zones: ₹1,794.93 | ₹1,821.27 | ₹1,863.73
📅 Short-term vs. Long-term Perspective
Short-term: Stock may test resistance levels between ₹1,795 – ₹1,860 if momentum sustains.
Long-term: Formation of a double bottom indicates potential for a structural trend reversal if higher levels hold.
✅ Conclusion: Coforge is showing a technical reversal pattern with strong momentum signals.
👉 The stock is at a key breakout zone — short-term traders may track resistances closely, while long-term investors can monitor the double bottom for confirmation of sustained trend change.
⚠️ Disclaimer – Please Read Carefully
The information shared here is meant purely for learning and awareness. It is not a buy or sell recommendation and should not be taken as investment advice. I am not a SEBI-registered investment advisor, and all views expressed are based on personal study, chart patterns, and publicly available market data.
Trading — whether in stocks or options — carries risk. Markets can move unexpectedly, and losses can sometimes exceed the money you have invested. Past performance or past setups do not guarantee future results.
If you are a beginner, treat this as a guide to understand how the market works — practice on paper trades before risking real money. If you are experienced, always assess your own risk, position sizing, and strategy suitability before entering trades.
Consult a SEBI-registered financial advisor before making any real trading decision. By engaging with this content, you acknowledge full responsibility for your trades and investments.
💬 Found this useful?
🔼 Give this post a Boost to help more traders discover clean, structured learning.
✍️ Drop your thoughts, questions, or setups in the comments — let’s grow together!
🔁 Share with fellow traders and beginners to spread awareness.
👉 “If you liked this breakdown, follow for more clean, structured setups with discipline at the core.”
🚀 Stay Calm. Stay Clean. Trade With Patience.
Trade Smart | Learn Zones | Be Self-Reliant 📊
Learntotrade
Tata Elxsi | Volume Breakout with Key Supports & Resistances📌 Tata Elxsi Ltd. – Closing Price: ₹5,843.50
📊 Technical Indicators Explained
Tata Elxsi is showing strong technical signals. A 20-day volume breakout 🚀 suggests big participation from traders, while a Bullish Marubozu candle 🔥 confirms strong buying momentum. The stock is clearly building momentum 💹, with possible target zones 🎯 based on Fibonacci levels. A short-term setup 📈 is visible as momentum indicators turn positive. The RSI breakout ⚡ shows renewed strength, and both SuperTrend and VWAP 🟢 are aligned on the bullish side, further adding confidence to the current breakout.
________________________________________
📈 Bullish Case – Why the stock could go up
Strong Bullish Marubozu Candle indicates momentum revival.
Breakout supported by high volumes – sign of institutional interest.
RSI & VWAP trending positive, confirming strength.
Fibonacci levels indicate potential upside zones towards ₹6,300 – ₹7,250+.
📉 Bearish Case – Potential downside risks
Any failure to sustain above ₹5,770 could trigger profit booking.
Broader market weakness or sector sentiment may weigh.
A break below ₹5,500 would weaken the bullish structure.
⚡ Momentum Case – Short-term Trading Edge
20-Day Volume Breakout highlights strong trader participation.
RSI breakout + SuperTrend signal indicate momentum strength.
Sustaining above ₹5,900–₹6,000 may lead to further positive movement towards higher levels.
📊 Support & Resistance Levels
Resistance Zones: ₹5,939 | ₹6,034.5 | ₹6,209
Support Zones: ₹5,399 | ₹5,494.5 | ₹5,669
📅 Short-term vs. Long-term Perspective
Short-term: Key resistance zones to watch are around ₹6,200 – ₹6,735, while support lies near ₹5,500.
Long-term: The stock remains in a structural uptrend. Any dip towards ₹5,200–₹5,400 may act as accumulation zones for investors with a longer horizon.
✅ Conclusion: Tata Elxsi has shown a strong breakout backed by volume & momentum.
👉 The stock is at an important juncture — while short-term traders may track key momentum levels, long-term investors can view dips as opportunities within the broader uptrend.
⚠️ Disclaimer – Please Read Carefully
The information shared here is meant purely for learning and awareness. It is not a buy or sell recommendation and should not be taken as investment advice. I am not a SEBI-registered investment advisor, and all views expressed are based on personal study, chart patterns, and publicly available market data.
Trading — whether in stocks or options — carries risk. Markets can move unexpectedly, and losses can sometimes exceed the money you have invested. Past performance or past setups do not guarantee future results.
If you are a beginner, treat this as a guide to understand how the market works — practice on paper trades before risking real money. If you are experienced, always assess your own risk, position sizing, and strategy suitability before entering trades.
Consult a SEBI-registered financial advisor before making any real trading decision. By engaging with this content, you acknowledge full responsibility for your trades and investments.
💬 Found this useful?
🔼 Give this post a Boost to help more traders discover clean, structured learning.
✍️ Drop your thoughts, questions, or setups in the comments — let’s grow together!
🔁 Share with fellow traders and beginners to spread awareness.
👉 “If you liked this breakdown, follow for more clean, structured setups with discipline at the core.”
🚀 Stay Calm. Stay Clean. Trade With Patience.
Trade Smart | Learn Zones | Be Self-Reliant 📊

Price Action & Market StructurePart 1: Understanding Price Action
What is Price Action?
Price action refers to the movement of price plotted over time, without relying heavily on indicators. It studies the open, high, low, and close of candles or bars, combined with patterns, to forecast future movements.
Traders use price action to:
Identify market sentiment (bullish or bearish).
Spot areas of support and resistance.
Recognize chart patterns like triangles, flags, or head & shoulders.
Time entries and exits without clutter.
Core Elements of Price Action
Candlesticks – Each candlestick tells a story of supply and demand in a given time frame.
Bullish candles show dominance of buyers.
Bearish candles reflect sellers in control.
Long wicks indicate rejection of certain price levels.
Price Swings – Highs and lows are critical. They reveal whether the market is making higher highs/lows (uptrend) or lower highs/lows (downtrend).
Support & Resistance – Price action revolves around zones where price repeatedly reacts.
Support: a floor where buyers step in.
Resistance: a ceiling where sellers dominate.
Trendlines & Channels – Connecting swing highs or lows provides insight into the prevailing direction and potential breakout points.
Chart Patterns – Price action often forms recognizable patterns:
Continuation patterns: flags, pennants, triangles.
Reversal patterns: double top/bottom, head & shoulders, rounding bottom.
Part 2: Understanding Market Structure
What is Market Structure?
Market structure refers to the framework of how price moves through trends and consolidations. It is the “map” of the market, showing whether buyers or sellers are in control and how momentum shifts.
The structure can be broken into three main types:
Uptrend (bullish structure) – Higher highs (HH) and higher lows (HL).
Downtrend (bearish structure) – Lower highs (LH) and lower lows (LL).
Sideways (range-bound) – Price oscillates between support and resistance without clear trend.
Why Market Structure Matters
It provides context before placing trades.
Prevents trading against the dominant flow.
Helps identify when trends are about to reverse.
Acts as the backbone of supply and demand zones.
Anatomy of Market Structure
Impulse and Correction – Markets move in waves.
Impulse: strong directional move (trending leg).
Correction: smaller pullback before continuation or reversal.
Break of Structure (BOS) – A key event where price breaks past previous highs/lows, signaling trend continuation or reversal.
Market Phases
Accumulation: Institutions build positions quietly (range).
Markup: Trend begins (sharp price rally).
Distribution: Positions are offloaded (range or topping pattern).
Markdown: Price declines as sellers dominate.
Part 3: Price Action & Market Structure Combined
When combined, price action and market structure become a powerful toolkit:
Identify Market Structure – Determine if market is trending up, down, or sideways.
Use Price Action Signals – Look for candlestick rejections, patterns, or false breakouts at key structure points.
Validate with Support/Resistance or Supply/Demand Zones – Enter trades where price reacts strongly.
Set Risk Management – Place stops beyond structure zones (swing highs/lows).
For example:
In an uptrend, wait for price to pull back to a support level, then look for bullish candlestick patterns (hammer, engulfing) to confirm entry.
In a downtrend, wait for a retracement to resistance, then look for bearish rejection candles.
Part 4: Key Price Action Patterns within Market Structure
Pin Bar (Hammer / Shooting Star)
Signals rejection of price levels.
Works best at structure zones (support/resistance).
Engulfing Candle
A strong reversal signal when a large candle completely engulfs the previous one.
Inside Bar
Market consolidation before a breakout.
Double Top / Double Bottom
Classic reversal structures.
Head & Shoulders
Bearish reversal pattern at market tops.
Breakout & Retest
Price breaks structure and retests before continuation.
Part 5: Advanced Concepts
Supply & Demand Zones
Institutions leave “footprints” in the form of supply (where heavy selling originates) and demand zones (where aggressive buying starts). Identifying these zones within structure gives high-probability trade setups.
Liquidity Hunts (Stop Hunts)
Markets often move to trigger retail stop-losses before continuing in the intended direction. Recognizing liquidity pools near swing highs/lows is critical.
Order Flow & Market Manipulation
Big players manipulate price briefly before pushing it in the desired direction. Price action analysis allows traders to see these traps.
Part 6: Practical Trading Approach
Step 1: Multi-Timeframe Analysis
Start with higher timeframe (daily/weekly) to identify major structure.
Drop down to lower timeframes (1H/15M) for entries.
Step 2: Mark Structure & Zones
Draw key swing highs/lows.
Identify supply/demand or support/resistance.
Step 3: Wait for Price Action Confirmation
Look for rejection wicks, engulfing patterns, or BOS signals.
Step 4: Execute with Risk Management
Risk only 1–2% per trade.
Place stop beyond invalidation level (swing high/low).
Step 5: Trade Management
Scale out partial profits at key levels.
Trail stop-loss in trending markets.
Part 7: Psychology Behind Price Action & Structure
Trading without indicators forces traders to “see the market naked.” This can be intimidating but also liberating. Success depends on:
Patience: waiting for structure alignment and confirmation.
Discipline: not chasing every move.
Confidence: trusting the simplicity of price action.
Part 8: Case Studies
Example 1: Uptrend Continuation
Market forms HH & HL.
Pullback to demand zone.
Bullish engulfing candle appears.
Long entry → ride trend until new resistance forms.
Example 2: Trend Reversal
Market breaks below previous HL (BOS).
Retest as new resistance.
Shooting star candle appears.
Short entry → ride markdown phase.
Part 9: Common Mistakes in Price Action & Market Structure
Trading without higher timeframe context.
Misidentifying ranges as trends.
Entering trades without confirmation.
Overcomplicating with too many trendlines.
Ignoring risk management.
Part 10: Conclusion
Price action and market structure together form the backbone of professional trading. Instead of relying on lagging indicators, traders learn to read the “story” of price and align with institutional moves.
Key takeaways:
Price action reveals real-time market psychology.
Market structure provides the framework for trends and reversals.
Combining them gives a high-probability edge.
Success depends on patience, discipline, and risk control.
In essence, trading with price action and market structure is about aligning yourself with the natural rhythm of the market. The more you practice, the clearer the story of price becomes, and the greater your confidence in executing profitable trades.

Psychology of Trading1. Introduction: Why Psychology Matters in Trading
Trading is not just about buying low and selling high. It is about making decisions under uncertainty, managing risk, and dealing with constant emotional swings. Unlike traditional jobs where performance is based on effort and skills, trading has an unpredictable outcome in the short term.
You can make a perfect trade setup and still lose money.
You can make a terrible decision and accidentally profit.
This uncertainty creates emotional pressure, leading traders to make irrational decisions. For example:
Selling too early out of fear.
Holding on to losing trades hoping for a reversal.
Over-trading after a big win or loss.
Without strong psychological control, traders often repeat these mistakes. That is why understanding and mastering trading psychology is the real secret to consistent success.
2. Core Emotions in Trading
Emotions are natural, but when unmanaged, they distort judgment. Let’s break down the four main emotions every trader faces:
(a) Fear
Fear is the most common emotion in trading. It shows up in two forms:
Fear of Losing Money – leading to hesitation, missed opportunities, or premature exits.
Fear of Missing Out (FOMO) – jumping into trades too late because others are making money.
Example: A trader sees a stock rallying rapidly and buys at the top out of FOMO. When the price corrects, fear of loss makes them sell at the bottom – a classic cycle.
(b) Greed
Greed pushes traders to take excessive risks, over-leverage, or hold winning positions too long. Instead of following a plan, they chase “unlimited” profits.
Example: A trader who plans for 5% profit refuses to book at target, hoping for 10%. The market reverses, and the profit turns into a loss.
(c) Hope
Hope is dangerous in trading. While hope is positive in life, in markets it blinds traders from reality. Hope makes people hold on to losing trades, ignoring stop-losses, and believing “it will come back.”
Example: A trader buys a stock at ₹500, it falls to ₹450, then ₹400. Instead of cutting losses, the trader “hopes” for recovery and keeps averaging down, often leading to bigger losses.
(d) Regret
Regret comes after missed opportunities or wrong trades. Regret often leads to revenge trading, where traders try to quickly recover losses, usually resulting in even bigger losses.
3. Cognitive Biases in Trading
Apart from emotions, psychology is also influenced by cognitive biases – mental shortcuts that distort rational thinking.
Overconfidence Bias – Believing your strategy is always right after a few wins, leading to careless trading.
Confirmation Bias – Only looking for information that supports your view, ignoring opposite signals.
Loss Aversion – The pain of losing ₹1000 is stronger than the joy of gaining ₹1000. This makes traders hold losers and sell winners too soon.
Anchoring Bias – Relying too heavily on the first price seen, e.g., thinking “I bought at ₹600, so it must go back to ₹600.”
Herd Mentality – Following the crowd without analysis, especially during hype rallies or crashes.
These biases prevent traders from making objective decisions.
4. Mindset of a Successful Trader
Successful traders think differently from beginners. Their mindset is built on discipline, patience, and acceptance of uncertainty. Key elements include:
Process Over Outcome: Focusing on following rules, not immediate profit.
Acceptance of Losses: Treating losses as part of the business, not as personal failure.
Probabilistic Thinking: Understanding that no trade is 100% certain; trading is about probabilities.
Long-Term Focus: Avoiding the need for daily wins, instead building consistent performance over months/years.
Emotional Detachment: Viewing money as “trading capital,” not personal wealth.
5. The Role of Discipline
Discipline is the backbone of trading psychology. Without discipline, even the best strategies fail. Discipline involves:
Following a Trading Plan – entry, exit, stop-loss, risk-reward.
Position Sizing – never risking more than 1-2% of capital on a single trade.
Consistency – sticking to strategy instead of changing methods after every loss.
Patience – waiting for the right setup instead of forcing trades.
Most traders fail not because of bad strategies but because they lack the discipline to follow their strategies.
6. Psychological Challenges in Different Trading Styles
(a) Day Trading
Constant pressure, quick decisions.
High temptation to over-trade.
Emotional exhaustion.
(b) Swing Trading
Requires patience to hold trades for days/weeks.
Fear of overnight risks (gaps, news).
Temptation to check charts every hour.
(c) Long-Term Investing
Emotional difficulty in holding through corrections.
Pressure from news and market noise.
Fear of missing short-term opportunities.
Each style demands a different level of emotional control.
7. Developing Emotional Intelligence for Trading
Emotional Intelligence (EQ) is the ability to understand and manage your emotions. Traders with high EQ can:
Recognize when fear/greed is influencing them.
Pause before reacting emotionally.
Maintain objectivity under stress.
Ways to improve EQ in trading:
Journaling – Writing down emotions and mistakes after each trade.
Mindfulness & Meditation – Helps calm the mind and reduce impulsive decisions.
Detachment from Money – Viewing trades as probabilities, not personal wins/losses.
Visualization – Mentally preparing for both winning and losing scenarios.
8. Risk Management & Psychology
Risk management is not just technical – it is psychological. A trader who risks too much per trade is more likely to panic.
Risk per trade: Max 1–2% of capital.
Use stop-loss orders to remove emotional decision-making.
Diversify to avoid stress from a single bad trade.
When risk is controlled, emotions naturally reduce.
9. Common Psychological Mistakes Traders Make
Overtrading – Trading too often due to excitement or frustration.
Ignoring Stop-Losses – Driven by hope and denial.
Chasing the Market – Entering late due to FOMO.
Revenge Trading – Trying to recover losses aggressively.
Lack of Patience – Jumping in before confirmation.
Ego Trading – Refusing to accept mistakes, trying to “prove the market wrong.”
10. Building Psychological Strength
Practical steps to master trading psychology:
Create a Trading Plan – Define entry, exit, stop-loss, risk-reward.
Keep a Trading Journal – Record reasons, outcomes, and emotions of each trade.
Use Small Position Sizes – Reduce stress by lowering risk.
Practice Visualization – Prepare for losses before they happen.
Regular Breaks – Step away from screens to avoid emotional burnout.
Focus on Process, Not Profit – Judge yourself by discipline, not daily P&L.
Accept Imperfection – No trader wins all trades; consistency matters more than perfection.
Final Thoughts
The psychology of trading is the bridge between knowledge and execution. Thousands of traders know strategies, but only a few succeed because they master their emotions.
To succeed in trading:
Build discipline like a soldier.
Accept uncertainty like a scientist.
Control emotions like a monk.
In short: Trading is less about predicting markets and more about controlling yourself.

Part 4 Learn Institutional Trading Risks of Options Trading
Options can be powerful but come with risks:
Time Decay (Theta): Options lose value as expiry nears.
High Volatility: Premiums can fluctuate wildly.
Leverage Trap: While leverage amplifies profits, it also magnifies losses.
Unlimited Risk (for Sellers): If you sell options, your risk can be theoretically unlimited.
Complex Strategies: Advanced option strategies require deep knowledge.
How Options Work in Practice
Let’s take a step-by-step breakdown using a Nifty Call Option Example:
Nifty Spot: 20,000
You buy a Call Option with Strike = 20,000, Premium = 150, Expiry = 1 month.
Scenario A: Nifty goes to 20,500
Option intrinsic value = 500 (20,500 - 20,000)
Profit = 500 - 150 = 350 per unit × Lot size (say 50) = ₹17,500 profit.
Scenario B: Nifty falls to 19,800
Option expires worthless.
Loss = Premium × Lot size = ₹150 × 50 = ₹7,500 loss.
This shows both the leverage and limited risk nature of options.

Part 6 Learn Institutional Trading Factors Affecting Option Prices
Option premiums are influenced by multiple factors:
Underlying Price: Moves directly impact intrinsic value.
Time to Expiry: Longer duration = higher premium (more time value).
Volatility: Higher volatility = higher premium (more uncertainty).
Interest Rates & Dividends: Minor factors but can influence pricing.
The famous Black-Scholes Model is often used to calculate theoretical option prices.
Basic Option Strategies for Beginners
Here are some simple strategies you can start with:
1. Buying Calls
Use when you expect the stock/index to rise.
Risk: Premium loss.
Reward: Unlimited upside.
2. Buying Puts
Use when you expect the stock/index to fall.
Risk: Premium loss.
Reward: Significant downside profits.
3. Covered Call
Own a stock + Sell a call option on it.
Generates income but caps upside.
4. Protective Put
Buy stock + Buy a put option.
Acts like insurance for your stock portfolio.
5. Straddle (Advanced Beginner)
Buy a call and put with the same strike and expiry.
Profits from big moves in either direction.
Risk: Both premiums lost if market stays flat.

Part 1 Support and ResistanceStrategies in Option Trading
This is where options become art + science. Traders combine Calls and Puts into strategies.
1. Single-Leg Strategies
Long Call – Bullish.
Long Put – Bearish.
Short Call – Bearish, unlimited risk.
Short Put – Bullish, high risk.
2. Multi-Leg Strategies
Covered Call – Hold stock, sell call. Income + limited upside.
Protective Put – Hold stock, buy put. Insurance strategy.
Straddle – Buy Call + Put (ATM). Bet on high volatility.
Strangle – Buy OTM Call + Put. Cheaper than straddle.
Iron Condor – Sell OTM call & put, buy further OTM options. Profits if market stays range-bound.
Butterfly Spread – Limited risk, limited reward, ideal for low-volatility expectations.
Golden Rules for Option Traders
Always define risk before entering a trade.
Never sell naked options without deep experience.
Focus on probabilities, not predictions.
Respect volatility—it can make or break your trade.
Keep learning—options are a lifelong journey.

PCR Trading StrategiesWhy Trade Options?
Options exist because they allow flexibility and creativity in financial markets. Some common uses:
1. Leverage
Small premium controls large exposure.
2. Hedging
Portfolio managers buy Puts to insure against downside.
3. Income Generation
Writing covered calls generates steady premium income.
4. Speculation
Options let traders profit from not just direction, but also time and volatility.
Option Trading Strategies for Different Market Conditions
Bullish Market: Long Calls, Bull Call Spreads.
Bearish Market: Long Puts, Bear Put Spreads.
Sideways Market: Iron Condors, Butterflies.
Volatile Market: Straddles, Strangles.

Support & Resistance Levels for Today’s Market1. Introduction: Why Support & Resistance Matter
In trading, one of the most powerful and time-tested concepts is support and resistance (S&R). Whether you are a beginner exploring intraday charts or a seasoned trader looking at weekly setups, S&R levels act like the invisible walls of the market.
Support is a price zone where buyers step in, halting a decline.
Resistance is a zone where sellers emerge, stopping an advance.
These levels reflect the psychology of crowds, institutional behavior, and liquidity zones. Without them, trading would feel like driving without brakes or signals.
Every day, traders mark fresh S&R levels based on the previous day’s highs, lows, closes, option data, and market structure. That’s why they’re so critical in today’s market outlook.
2. The Psychology Behind Support & Resistance
To understand why these levels work, we need to dig into trader psychology:
Support Zones: Imagine a stock falling from ₹200 to ₹180. Many buyers who missed at ₹200 now feel ₹180 is a “cheap” price, so they step in. Short-sellers also book profits. This creates buying demand → market stabilizes.
Resistance Zones: Suppose the same stock climbs back from ₹180 to ₹200. Traders who bought late at ₹200 earlier may exit to break even. Short-sellers also re-enter. Selling pressure builds → market stalls.
Thus, S&R levels form from collective trader memory. The more times a level is tested, the stronger it becomes.
3. How to Identify Support & Resistance Levels for Today
For daily trading, traders usually rely on:
(a) Previous Day High & Low
Yesterday’s high often acts as resistance.
Yesterday’s low often acts as support.
Example: If Nifty made a high of 24,200 yesterday, that zone may cap today’s rallies.
(b) Opening Price & First 15-Minute Range
The opening levels define intraday sentiment.
A breakout above the first 15-min high = bullish bias.
A breakdown below the first 15-min low = bearish bias.
(c) Moving Averages
20 EMA (Exponential Moving Average) is a strong intraday S/R level.
50 & 200 EMAs act as swing-level S/R.
(d) Pivot Points
Calculated from (High + Low + Close) / 3.
Traders use them to mark Support (S1, S2, S3) and Resistance (R1, R2, R3) levels.
(e) Volume Profile Zones
High Volume Nodes (HVN) = strong support/resistance.
Low Volume Nodes (LVN) = possible breakout/breakdown areas.
(f) Option Chain Data (OI)
In index trading (Nifty, Bank Nifty), strike prices with highest Call OI = resistance.
Strike prices with highest Put OI = support.
4. Types of Support & Resistance
(a) Horizontal Levels
Flat lines connecting multiple swing highs or lows. Most commonly used.
(b) Trendline Support/Resistance
Drawn diagonally across rising lows (support) or falling highs (resistance).
(c) Fibonacci Levels
Retracement levels (38.2%, 50%, 61.8%) often act as S&R.
(d) Dynamic Levels
Moving averages, VWAP, Bollinger bands that shift daily.
(e) Psychological Levels
Round numbers like Nifty 24,000 or Bank Nifty 50,000 act as magnets for price.
5. Why Support & Resistance Work Better in Today’s Market
Today’s markets (2025) are highly algorithm-driven, but even algo models respect liquidity zones → which are essentially S&R levels.
Retail traders watch them → self-fulfilling prophecy.
Institutions place big buy/sell orders near S&R → liquidity builds.
Option writers defend key strikes → market reacts.
So, S&R remains relevant even in the era of algo trading.
6. Trading Strategies Using Support & Resistance
Let’s break down practical intraday and swing strategies:
Strategy 1: Bounce from Support
Wait for price to test support (yesterday’s low, pivot S1, etc.).
Look for bullish candlestick pattern (hammer, engulfing).
Enter long trade → Stop loss below support → Target = resistance.
Strategy 2: Reversal at Resistance
Price approaches strong resistance.
Look for bearish rejection (shooting star, Doji).
Enter short trade → Stop loss above resistance → Target = support.
Strategy 3: Breakout of Resistance
Resistance is tested multiple times.
Strong volume breakout = momentum trade.
Example: Nifty crossing 24,200 with OI shift confirms breakout.
Strategy 4: Breakdown of Support
If support breaks with volume, fresh shorts open.
Example: Bank Nifty falling below 50,000 with heavy Put unwinding.
Strategy 5: Range Trading
If market is sideways, trade between support & resistance.
Buy near support → Sell near resistance.
7. Support & Resistance in Different Timeframes
1-Min / 5-Min Charts → For scalpers, short-term S&R.
15-Min / 1-Hour Charts → Best for intraday.
Daily Charts → Strong S&R for swing & positional trades.
Weekly Charts → Long-term zones watched by institutions.
For today’s market, intraday traders focus mainly on 15-min & hourly charts.
8. Common Mistakes Traders Make
Blindly Buying at Support / Selling at Resistance
Always confirm with volume & candlestick pattern.
Ignoring Breakouts & Breakdowns
Many traders keep waiting for a bounce but miss the trend.
Using Only One Tool
Combine pivots, moving averages, and OI for better accuracy.
Forgetting Stop Loss
S&R levels can break – never trade without a plan.
9. Case Study: Support & Resistance in Nifty (Example)
Suppose Nifty closed yesterday at 24,050 with a high of 24,200 and low of 23,950.
Support Zones for Today:
23,950 (yesterday’s low)
23,900 (Put OI support)
23,850 (pivot S1)
Resistance Zones for Today:
24,200 (yesterday’s high)
24,250 (Call OI buildup)
24,300 (pivot R1)
Trading Plan:
If Nifty sustains above 24,200 with volume → Buy for 24,300.
If Nifty falls below 23,950 → Short for 23,850.
This is exactly how professionals set up today’s market trade plan.
10. Advanced Insights: Volume Profile + Options Data
A modern trader should combine:
Volume Profile → Where most trading occurred yesterday.
Options OI Shifts → Which strikes are defended/attacked today.
Price Action Confirmation → Candlestick rejections, breakouts.
This 3-way approach increases accuracy.
Conclusion: Why Support & Resistance Will Never Die
Markets evolve – from floor trading to electronic, from manual to algo. But one thing remains timeless: human behavior. Fear, greed, profit-taking, and FOMO all play out at support and resistance levels.
For today’s market, S&R acts as your trading compass.
They guide your entries and exits.
They highlight where risk is lowest and reward is highest.
They help you trade with discipline instead of emotion.
Whether you are an intraday trader, a swing trader, or an investor, mastering support and resistance is like mastering the grammar of market language. Without it, you can’t construct profitable trades.

Jindal Steel Breakout Study | Momentum, Volume & Key Levels📊 STWP Stock Analysis – JINDAL STEEL (3rd Sept 2025)
Price Action:
Jindal Steel surged to a CMP of ₹1028.35, marking an impressive +5.46% gain on the day. The stock is currently riding on strong momentum with a clear bullish crossover trend, signaling further upside potential. However, traders must remain cautious as the risk level is high, fueled by sharp price swings. What adds conviction to the move is the heavy volume participation, showing strong market interest and active participation by investors.
Volume & Participation
Jindal Steel witnessed a massive trading volume of 45.2 lakh shares today, almost 2x its 20-SMA average of 19.9 lakh shares (Volx: 1.98x ). This sharp surge in participation clearly highlights the presence of strong hands in action, adding weight to the bullish move and reinforcing market conviction.
Indicator Check
The indicators are painting a mixed yet insightful picture for Jindal Steel. The RSI at 61.1 shows strong momentum, while the CCI at 109 confirms a bullish bias. However, the MACD at -1.07 signals a slight bearish crossover, which needs monitoring. Meanwhile, the Stochastic at 98 suggests the stock is overbought, hinting at possible short-term profit booking. Importantly, prices remain above all key EMAs, reinforcing the broader bullish structure.
Key levels
Resistance: 1048/1067/1105
Support: 991/953/934
📰 Latest News Snapshot — JINDALSTEL
Jindal Steel & Power is making headlines on multiple fronts. In its Q1 FY26 results (Aug 12, 2025), the company delivered a strong turnaround with net profit at ₹1,494 crore, aided by a 32% QoQ jump in EBITDA and healthier margins at 24.4%, though revenues softened to about ₹12,294 crore. On the operational side, JSPL commissioned its first continuous galvanising line (CGL-1) at Angul, Odisha, enhancing its ability to supply value-added coated steel for automobiles, appliances, infrastructure, and construction — a big step in product diversification. Meanwhile, the market responded positively as the stock surged 4–5% on heavy volumes on September 3, 2025, also factoring in its recent ₹2/share final dividend declaration.
🧭 Sentiment Outlook & Investment Perspective
Jindal Steel & Power is showing a moderately positive outlook, backed by a strong turnaround in profitability with margins and EBITDA improving, while its new galvanising line at Angul adds valuable capacity in coated steel for autos, appliances, and infrastructure — a move that strengthens its long-term product mix and earnings potential. The recent surge in trading volumes and price action highlights strong market participation, which can attract further momentum buying in the near term. However, risks remain in the form of softer revenues, exposure to the cyclical swings of steel prices and exports, and the possibility of short-term corrections after sharp rallies. In the short term, volatility may stay elevated as the stock digests its recent gains, but in the long term, the focus on higher-margin products and disciplined capacity expansion positions the company constructively for sustainable growth — making it a stock to watch with cautious optimism.
🚀 Bullish Momentum
The stock is also riding on strong technical momentum, with a Bullish Marubozu candle and an Open = Low setup, both pointing to firm buying support. A Bollinger Band breakout following a BB squeeze indicates the potential for sharp price expansion. Adding to the momentum, an RSI breakout, combined with a powerful bullish candle structure, confirms the strength of the move. The setup even aligns with a possible Buy Today, Sell Tomorrow (BTST) opportunity, making the near-term trend look decisively bullish.
📊 STWP Trade Analysis – JINDAL STEEL
JINDAL STEEL is showing strong momentum supported by volume. I will consider my entry near ₹1030 as part of a breakout setup. If the stock dips closer to ₹1015, I will look at that as a more conservative entry with tighter risk, which suits my swing trading approach.
For me, the pullback level around ₹954.25 is an important support zone where buyers might re-enter, while the invalidation level near ₹910 would signal that my bullish view has failed. On the upside, I will be watching ₹1117 and ₹1205 as possible target zones if momentum continues. 🚀
⚠️ Disclaimer – Please Read Carefully
The information shared here is meant purely for learning and awareness. It is not a buy or sell recommendation and should not be taken as investment advice. I am not a SEBI-registered investment advisor, and all views expressed are based on personal study, chart patterns, and publicly available market data.
Trading — whether in stocks or options — carries risk. Markets can move unexpectedly, and losses can sometimes exceed the money you have invested. Past performance or past setups do not guarantee future results.
If you are a beginner, treat this as a guide to understand how the market works — practice on paper trades before risking real money. If you are experienced, always assess your own risk, position sizing, and strategy suitability before entering trades.
Consult a SEBI-registered financial advisor before making any real trading decision. By engaging with this content, you acknowledge full responsibility for your trades and investments.
💬 Found this useful?
🔼 Give this post a Boost to help more traders discover clean, structured learning.
✍️ Drop your thoughts, questions, or setups in the comments — let’s grow together!
🔁 Share with fellow traders and beginners to spread awareness.
👉 “If you liked this breakdown, follow for more clean, structured setups with discipline at the core.”
🚀 Stay Calm. Stay Clean. Trade With Patience.
Trade Smart | Learn Zones | Be Self-Reliant 📊

Part 4 Institutional Trading Intermediate Strategies
(a) Bull Call Spread
Buy a call at lower strike and sell a call at higher strike.
Reduces cost but caps profit.
Good for moderately bullish markets.
(b) Bear Put Spread
Buy a put at higher strike, sell a put at lower strike.
Used in moderately bearish markets.
(c) Straddle
Buy one call and one put at the same strike and expiry.
Profits if stock makes a big move in either direction.
Expensive, requires high volatility.
(d) Strangle
Buy OTM call + OTM put.
Cheaper than straddle but needs a larger price move.
(e) Iron Condor
Combination of bull put spread + bear call spread.
Profits when price stays in a range.
Great for low-volatility environments.

AI Trading Psychology1. The Role of Psychology in Traditional Trading
Before AI, trading was primarily a human-driven endeavor. Every market move reflected the collective emotions of thousands of participants. Understanding traditional trading psychology provides the foundation for how AI modifies it.
Key Psychological Factors in Human Trading
Fear and Greed: Fear leads to panic selling; greed fuels bubbles. Together, they explain much of market volatility.
Loss Aversion: Traders hate losing money more than they enjoy making money. This leads to holding losing trades too long and selling winners too early.
Overconfidence: Many traders believe their analysis is superior, leading to risky positions and underestimating market uncertainty.
Herd Behavior: People often follow the crowd, especially in uncertain conditions, which creates manias and crashes.
Confirmation Bias: Traders seek information that supports their views and ignore contradictory evidence.
Example
During the 2008 financial crisis, fear spread faster than rational analysis. Even fundamentally strong stocks were sold off because investor psychology turned negative. Similarly, the Dot-com bubble of 2000 was fueled more by collective greed and hype than by realistic fundamentals.
In short, psychology is central to markets. AI trading challenges this dynamic by removing emotional decision-making from the execution layer.
2. How AI Transforms Trading Psychology
AI changes trading psychology in two major ways:
On the trader’s side, by reducing the emotional burden of decision-making.
On the market’s side, by reshaping collective behavior through algorithmic dominance.
AI’s Strengths in Overcoming Human Weaknesses
No emotions: AI doesn’t panic, doesn’t get greedy, and doesn’t second-guess itself.
Data-driven: It relies on massive datasets instead of gut feelings.
Consistency: It sticks to strategy rules without deviation.
Speed: It reacts in milliseconds, often before human traders even notice market changes.
Example
High-frequency trading (HFT) firms use algorithms that can execute thousands of trades per second. Their strategies rely on speed and mathematics, not human intuition. The psychological edge comes from removing human hesitation and inconsistency.
The Psychological Shift
For traders, using AI means learning to trust algorithms over instinct. This is not easy, because humans are naturally emotional and skeptical of machines making high-stakes financial decisions. The new psychological challenge is not just controlling one’s emotions but balancing trust and oversight in AI systems.
3. Human-AI Interaction: Trust, Fear, and Overreliance
One of the most important psychological dimensions of AI trading is human trust in technology. Traders must decide how much autonomy to give AI.
Trust Issues
Overtrust: Believing AI is infallible, leading to blind reliance.
Undertrust: Constantly interfering with AI decisions, which undermines performance.
Fear of the Unknown
Many traders feel anxious about “black-box AI” models like deep learning, where even developers cannot fully explain why the system makes certain decisions. This lack of transparency creates psychological unease.
Overreliance
Some traders outsource their entire decision-making process to AI. While this removes emotional interference, it also creates dependency. If the system fails or encounters unseen market conditions, the trader may be ill-prepared to respond.
Example
The 2010 Flash Crash showed the danger of overreliance. Algorithms created a cascade of selling that temporarily erased nearly $1 trillion in market value within minutes. Human oversight was slow to react because many traders trusted the machines too much.
This highlights a paradox: AI reduces human psychological flaws but introduces new psychological risks related to trust, dependence, and control.
4. Cognitive Biases in AI Trading
Although AI itself is not emotional, the humans designing and using AI systems bring their own biases into the process.
Designer Bias
AI reflects the assumptions, goals, and limitations of its creators.
For example, if a model is trained only on bullish market data, it may perform poorly in bear markets.
User Bias
Traders may interpret AI outputs selectively, aligning them with pre-existing beliefs (confirmation bias).
Some traders only follow AI signals when they match their own intuition, which defeats the purpose.
Automation Bias
Humans tend to favor automated suggestions over their own judgment, even when the machine is wrong. In trading, this can lead to dangerous blind spots.
Anchoring Bias
If an AI system provides a target price, traders may anchor to that number instead of re-evaluating based on new data.
In essence, AI does not eliminate psychological biases; it shifts them from direct decision-making to the way humans interact with AI systems.
5. Emotional Detachment vs. Emotional Influence
AI offers emotional detachment in execution. A machine doesn’t panic-sell during volatility. But human emotions still play a role in how AI systems are used.
Benefits of Emotional Detachment
Prevents irrational trades during panic.
Maintains discipline in following strategies.
Reduces stress and fatigue from constant monitoring.
The Emotional Influence Remains
Traders still feel anxiety when giving up control.
Profit or loss generated by AI still triggers emotional reactions.
Traders may override AI decisions impulsively, especially after losses.
Example
A retail trader using an AI-based trading bot may panic when seeing consecutive losses and shut it down prematurely, even if the system is statistically sound in the long run. Here, psychology undermines the benefit of AI’s discipline.
6. AI’s Psychological Impact on Market Participants
AI does not only affect individual traders—it changes the psychology of entire markets.
Increased Efficiency but Reduced Transparency
Markets with high algorithmic participation move faster and more efficiently. However, the lack of transparency in AI strategies creates uncertainty, which increases anxiety among traditional traders.
Psychological Divide
Professional traders with AI tools feel empowered, confident, and competitive.
Retail traders without access often feel disadvantaged and fearful of being exploited by machines.
Market Sentiment Acceleration
AI can amplify psychological extremes:
Positive sentiment spreads faster due to automated buying.
Negative sentiment cascades into rapid sell-offs.
This leads to shorter cycles of fear and greed, creating more volatile but efficient markets.
7. Ethical and Behavioral Implications
AI trading psychology extends into ethics and behavior.
Ethical Questions
Should traders use AI to exploit behavioral weaknesses of retail investors?
Is it ethical for algorithms to manipulate order books or engage in predatory strategies?
Behavioral Shifts
Younger traders may grow up trusting AI more than human intuition.
Traditional investors may resist, clinging to human-driven analysis.
This divide reflects not just technological adoption but also psychological adaptation to a new era of finance.
8. The Future of AI Trading Psychology
Looking ahead, AI trading psychology will continue to evolve.
Human-AI Symbiosis
The best outcomes will likely come from a hybrid approach:
AI handles execution and data analysis.
Humans provide judgment, ethical oversight, and adaptability.
Enhanced Transparency
To build trust, future AI systems may integrate explainable AI (XAI), allowing traders to understand the reasoning behind decisions. This will reduce anxiety and increase confidence.
Education and Adaptation
As traders become more familiar with AI, the psychological barriers of fear and mistrust will decline. Training in both technology and behavioral finance will be essential.
Market Psychology Evolution
Over time, collective market psychology may shift. Instead of being dominated by fear and greed of individuals, markets may increasingly reflect the programmed logic and optimization goals of algorithms. However, since humans still control AI design, psychology will never fully disappear—it will just manifest differently.
Conclusion
AI trading psychology is a fascinating blend of traditional behavioral finance and modern technological adaptation. While AI removes human emotions from execution, it introduces new psychological dynamics: trust, fear, overreliance, and ethical dilemmas.
The key insight is that psychology doesn’t vanish with AI—it transforms. Traders must now master not only their own emotions but also their relationship with algorithms. At the same time, AI reshapes the collective psychology of markets, accelerating cycles of fear and greed while creating new layers of uncertainty.
In the future, the traders who succeed will not be those who fight against AI, but those who learn to integrate human intuition with machine intelligence, balancing emotional wisdom with computational power.

Trading Master Class With ExpertsWhat are Options? (Basics)
An Option is a financial contract between two parties:
Buyer (Holder): Pays a premium for the right (not obligation) to buy/sell.
Seller (Writer): Receives the premium and has an obligation to honor the contract.
There are two basic types:
Call Option (CE) – Right to buy.
Put Option (PE) – Right to sell.
Example:
Suppose Infosys stock is trading at ₹1500. You buy a Call Option with a strike price of ₹1550 expiring in 1 month. If Infosys goes above ₹1550, you can exercise your right to buy at ₹1550 (cheaper than market). If it doesn’t, you just lose the small premium you paid.
This flexibility is the beauty of options.
Key Terms in Options Trading
Before diving deeper, let’s understand some key terms:
Strike Price: The fixed price at which you can buy/sell the asset.
Premium: The price paid to buy the option.
Expiry Date: The date on which the option contract expires.
Lot Size: Options are traded in lots (e.g., 25 shares per lot for Nifty options).
In-the-Money (ITM): When exercising the option is profitable.
Out-of-the-Money (OTM): When exercising would cause a loss.
At-the-Money (ATM): When the strike price = current market price.
Option Buyer: Pays premium, has limited risk but unlimited profit potential.
Option Seller (Writer): Receives premium, has limited profit but unlimited risk.
Types of Options – Calls and Puts
Call Option (CE)
Buyer has the right to buy.
Profits when the price goes up.
Put Option (PE)
Buyer has the right to sell.
Profits when the price goes down.
Example with Reliance stock (₹2500):
Call Option @ 2600: Profitable if Reliance goes above ₹2600.
Put Option @ 2400: Profitable if Reliance goes below ₹2400.

M&M | How to Trade a Bullish Engulfing in a Rising Channel🚘 M&M | How to Trade a Bullish Engulfing in a Rising Channel
📊 Stock: Mahindra & Mahindra Ltd (M&M)
⏳ Timeframe: Daily
📈 Chart Pattern: Rising Channel
🕯 Candlestick Pattern: Bullish Engulfing
________________________________________
🔹 Pattern Overview
M&M is currently trading within a Rising Channel, a structure that often reflects sustained bullish momentum. On the latest daily chart, a Bullish Engulfing candlestick has been formed, signaling renewed buying interest after a brief phase of consolidation.
________________________________________
The setup looks stronger with a Bullish Marubozu and an Open = Low candle, showing aggressive demand from the open. Price is holding well above VWAP, confirming bullish bias. A BB Squeeze Off signals volatility expansion ahead, while the recent false breakdown indicates sellers got trapped and buyers are back in control.
________________________________________
🔹 Key Levels to Watch
Resistance Zones: 3335 – 3374 – 3445
Support Zones: 3224 – 3152 – 3113
________________________________________
🔹 Technical Indicators Snapshot
RSI is at 52, sitting in the neutral zone but leaving room for upside momentum if buying picks up. The MACD shows a bearish crossover, which is an early caution signal to watch. CCI at -14 indicates neutral sentiment with no strong bias, while Stochastic at 55 is mid-range, suggesting neither overbought nor oversold conditions at the moment.
________________________________________
🔹 Candle Analysis
Candle 1 (Yesterday): High 3280 | Low 3187
Candle 2 (Today): High 3302.10 | Low 3191.10
👉 The today’s candle engulfed the previous session’s body, confirming the Bullish Engulfing pattern.
________________________________________
🔹 Trading View (Educational Insight Only)
A Bullish Engulfing inside a Rising Channel generally indicates continuation of the prevailing uptrend. If price manages to probably sustain above the 3335–3374 zone, it may signal strength for further upside. On the other hand, if the stock probably slips below the 3224–3152 support zone, it could lead to short-term profit booking.
________________________________________
📌 “All price levels mentioned are as observed at the time of writing and may change with market movements. Readers are advised to track live prices before making any trading or investment decision.”
⚠️ Disclaimer – Please Read Carefully
The information shared here is meant purely for learning and awareness. It is not a buy or sell recommendation and should not be taken as investment advice. I am not a SEBI-registered investment advisor, and all views expressed are based on personal study, chart patterns, and publicly available market data.
Trading — whether in stocks or options — carries risk. Markets can move unexpectedly, and losses can sometimes exceed the money you have invested. Past performance or past setups do not guarantee future results.
If you are a beginner, treat this as a guide to understand how the market works — practice on paper trades before risking real money. If you are experienced, always assess your own risk, position sizing, and strategy suitability before entering trades.
Consult a SEBI-registered financial advisor before making any real trading decision. By engaging with this content, you acknowledge full responsibility for your trades and investments.
💬 Found this useful?
🔼 Give this post a Boost to help more traders discover clean, structured learning.
✍️ Drop your thoughts, questions, or setups in the comments — let’s grow together!
🔁 Share with fellow traders and beginners to spread awareness.
👉 “If you liked this breakdown, follow for more clean, structured setups with discipline at the core.”
🚀 Stay Calm. Stay Clean. Trade With Patience.
Trade Smart | Learn Zones | Be Self-Reliant 📊
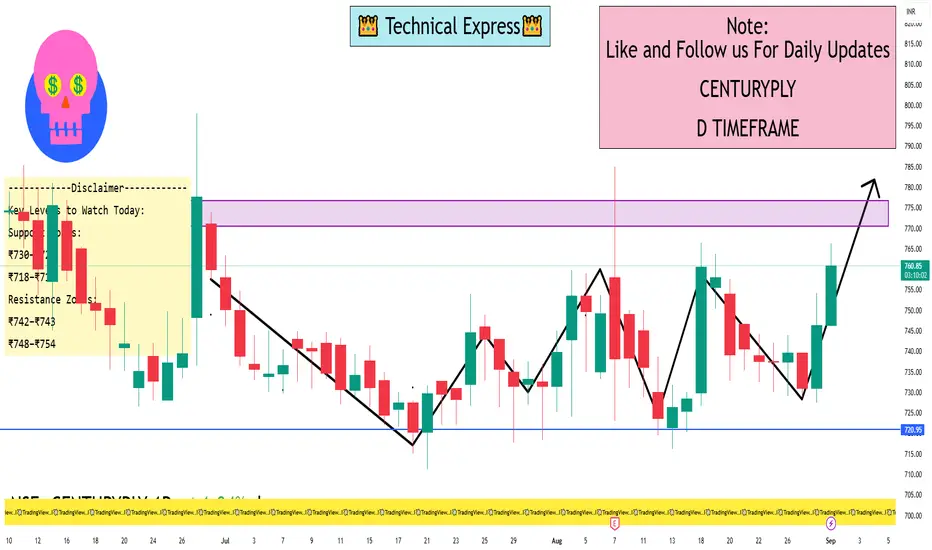
CENTURYPLY 1 Day ViewPrice Levels:
The stock was trading around ₹734.60, slightly down from the previous close of ₹735.60 (–0.14%)
Another snapshot shows ₹736.25 (with a range of ₹731.65 to ₹743.05)
These minor differences reflect changes across different timestamps and data sources—typical for live market quotes.
Daily Technical Indicators:
TradingView indicates a “Strong Sell” for moving averages and an overall “Sell” signal today on a 1-day timeframe
Investing.com mirrors this, also showing a “Strong Sell” on daily technicals
Investing.com India (Investing India) recently noted that on the daily frame, moving averages present a “Strong Buy” outlook (10 Buy vs. 2 Sell signals), but overall the daily technical status is Neutral—Oscillators and indicators were mixed
Moneycontrol's daily technical rating is again Neutral with classic pivot levels suggesting:
Resistance (Classic pivot):
R1: ₹742.90
R2: ₹748.45
R3: ₹754.90
Support:
S1: ₹730.90
S2: ₹724.45
S3: ₹718.90
Key Levels to Watch Today:
Support Zones:
₹730–₹724 (key range where buyers may emerge)
₹718–₹719 (lower buffer if weakness continues)
Resistance Zones:
₹742–₹743 (initial cap, also R1 pivot)
₹748–₹754 (secondary resistance levels)
These include pivot points and typical price-level touchpoints for intraday traders
Demat & Trading AccountsIntroduction
If you want to invest in the stock market or hold securities in India, two terms you will always come across are Demat Account and Trading Account. These two accounts are like the backbone of modern investing. Without them, buying and selling shares in today’s electronic stock market would be nearly impossible.
Earlier, shares were held in physical form (paper certificates). If you wanted to buy or sell, you had to physically deliver these certificates to the buyer or to the exchange. This process was time-consuming, risky (due to frauds, fake certificates, theft, or loss), and created unnecessary delays. To solve this, India adopted the system of dematerialization (demat) in the 1990s.
Today, all trades in the stock market happen online using these two accounts:
Demat Account → for holding securities electronically.
Trading Account → for buying and selling them through the stock exchange.
This write-up will explore both accounts in detail, explain their importance, features, working, types, and practical role in the Indian stock market.
1. Understanding the Basics
1.1 What is a Demat Account?
A Demat Account (short for Dematerialized Account) is an account that holds your shares, bonds, mutual funds, ETFs, and other securities in electronic format.
Think of it like a bank account, but instead of holding money, it holds your financial securities. When you buy shares, they get credited to your Demat Account. When you sell, they get debited.
Example: If you buy 100 shares of Infosys, instead of getting paper certificates, these 100 shares are electronically stored in your Demat Account.
In India, Demat Accounts are maintained by Depositories:
NSDL (National Securities Depository Limited)
CDSL (Central Depository Services Limited)
These depositories hold securities, while intermediaries called Depository Participants (DPs) (like banks, brokers, or financial institutions) give investors access to open and manage accounts.
1.2 What is a Trading Account?
A Trading Account is an account that allows you to place buy or sell orders in the stock market.
You cannot directly go to NSE or BSE to buy stocks. You need a broker who provides you with a Trading Account.
Through this account, you send orders (like “Buy 10 shares of TCS at ₹3500”) which get executed on the stock exchange.
In simple words:
Trading Account = Interface between you and the stock exchange.
Demat Account = Storage for your securities.
1.3 How Demat & Trading Accounts Work Together
Both accounts are interconnected. Here’s the flow of a transaction:
You place a buy order via your Trading Account.
Money gets debited from your Bank Account.
Shares are transferred into your Demat Account.
Similarly, when you sell shares:
You place a sell order in the Trading Account.
Shares get debited from your Demat Account.
Money gets credited into your Bank Account.
Thus, three accounts are linked:
Bank Account (funds)
Trading Account (market transactions)
Demat Account (holdings)
2. History & Evolution in India
2.1 Before Demat Accounts
Shares were issued in physical form.
Transfer of ownership required endorsement and physical delivery.
Problems: Fake certificates, theft, delays in settlement, bad deliveries.
2.2 Introduction of Demat System
1996: India introduced Dematerialization under SEBI regulation.
First electronic trade took place with NSDL as the main depository.
Later, CDSL was established.
Today, more than 99% of trades in India happen in electronic form.
3. Features of Demat Account
Paperless Holding – No physical certificates, only electronic form.
Multiple Securities – Can hold shares, bonds, ETFs, government securities, mutual funds, etc.
Easy Transfer – Quick transfer of shares during buying/selling.
Safety – Reduces risk of theft, forgery, and loss.
Nomination Facility – You can nominate someone to inherit your securities.
Corporate Benefits – Dividends, bonuses, stock splits, and rights issues are automatically credited.
Accessibility – Can be accessed via online platforms, mobile apps, or brokers.
4. Features of Trading Account
Market Access – Enables buying/selling on NSE, BSE, MCX, etc.
Multiple Segments – Can trade in equity, derivatives (F&O), commodities, and currencies.
Order Types – Market order, limit order, stop-loss order, etc.
Leverage/Margin Trading – Allows intraday and margin trading.
Technology Driven – Mobile apps, algo-trading, advanced charts.
Real-Time Updates – Live prices, executed trades, P&L statements.
5. Types of Demat Accounts
Regular Demat Account – For Indian residents to hold securities.
Repatriable Demat Account – For NRIs, linked with NRE bank account.
Non-Repatriable Demat Account – For NRIs, linked with NRO bank account.
Basic Services Demat Account (BSDA) – For small investors, with low charges.
Corporate Demat Account – For companies and institutions.
6. Types of Trading Accounts
Equity Trading Account – For stocks and equity derivatives.
Commodity Trading Account – For commodities (gold, oil, agricultural products).
Currency Trading Account – For forex trading.
Derivatives Trading Account – For futures and options.
Discount Brokerage Account – For low-cost trading, minimal services.
Full-Service Brokerage Account – With advisory, research, and premium services.
7. Process of Opening Accounts
7.1 Opening a Demat Account
Steps:
Choose a Depository Participant (DP) (bank, broker, NBFC).
Fill application form (KYC).
Submit documents (Aadhar, PAN, photo, bank proof).
Sign agreement with DP.
Get your Demat Account Number (DP ID + Client ID).
7.2 Opening a Trading Account
Steps:
Choose a broker (full-service or discount).
Fill KYC & account opening form.
Link Bank Account and Demat Account.
Get Login ID & Password for online trading.
8. Charges & Costs
Demat Account Charges
Account Opening Fee (some brokers offer free).
Annual Maintenance Charges (AMC).
Transaction Charges (per debit).
Custodian Fee (rare now).
Trading Account Charges
Brokerage Fee (flat fee or percentage).
Transaction Charges (exchange fee).
Securities Transaction Tax (STT).
SEBI Turnover Fees.
GST & Stamp Duty.
9. Advantages of Demat & Trading Accounts
Convenience – Buy/sell in seconds from anywhere.
Safety – No risk of fake/lost certificates.
Transparency – Easy tracking of holdings & trades.
Liquidity – Quick conversion of investments into cash.
Integration – Bank, trading, and demat are linked.
Corporate Benefits – Automatic credit of dividends/bonus.
Access to Multiple Markets – Equity, commodity, currency, derivatives.
10. Risks & Limitations
Technical Failures – System downtime can block trades.
Fraud Risks – If login/password is misused.
Charges – Brokerage and maintenance fees can reduce profits.
Overtrading – Easy access may tempt frequent trading, leading to losses.
Cybersecurity Threats – Hacking of accounts.
11. Role of Demat & Trading Accounts in Indian Stock Market
Helped India move from paper-based to electronic system.
Improved market efficiency and liquidity.
Attracted more retail investors with easy digital access.
Essential for IPOs (Initial Public Offerings) – shares are credited only in Demat form.
Integrated with apps & online platforms (Zerodha, Upstox, Angel One, ICICI Direct, HDFC Securities, etc.).
12. Practical Example
Suppose you want to invest in Reliance Industries:
You log in to your Trading Account and place a buy order for 50 shares.
Money is deducted from your Bank Account.
After settlement (T+1 day), 50 shares appear in your Demat Account.
Later, when Reliance declares a dividend, the amount is directly credited to your Bank Account.
If Reliance issues bonus shares, they are automatically credited to your Demat Account.
This shows the smooth link between all three accounts.
13. Future of Demat & Trading Accounts in India
More digital integration with UPI, AI-based advisory, and robo-trading.
Growth in retail participation due to mobile apps.
Expansion of commodity and global investing options.
Reduced charges with increasing competition among brokers.
Enhanced cybersecurity measures for safer trading.
Conclusion
Demat and Trading Accounts have revolutionized the Indian stock market. They replaced the old paper-based system, making investing faster, safer, and more efficient.
A Demat Account stores your securities.
A Trading Account lets you buy/sell them on exchanges.
Together, they act as the gateway for every investor to participate in the financial markets.
Whether you are a beginner or an experienced trader, understanding these two accounts is the first step toward wealth creation through the stock market.
Basic Trading Orders1. Introduction to Trading Orders
A trading order is an instruction to a broker or an exchange to buy or sell a financial instrument. The order specifies certain conditions like quantity, price, and execution rules. Depending on the type of order, execution may happen immediately, in the future, or only when certain conditions are met.
Trading orders can be as simple as:
“Buy 100 shares of Infosys at ₹1,600”
or as complex as:
“Buy 500 shares of Reliance if the price drops below ₹2,400, but only if it happens today, and sell them automatically if it rises above ₹2,480.”
Thus, trading orders bridge the gap between an investor’s intent and the actual execution of trades in the market.
2. Why Trading Orders Matter
Precision in Execution: Orders allow traders to execute trades at desired prices, avoiding unwanted slippage.
Risk Management: Stop-loss and conditional orders prevent excessive losses.
Automation: Orders enable traders to act even when they are not actively monitoring markets.
Strategy Implementation: Different order types help in executing strategies like scalping, swing trading, or hedging.
Psychological Discipline: By pre-defining entries and exits, traders reduce emotional decision-making.
3. Classification of Trading Orders
Trading orders can broadly be classified into:
Market Orders
Limit Orders
Stop Orders (Stop-Loss Orders)
Stop-Limit Orders
Day Orders & Good-Till-Cancelled (GTC) Orders
Immediate-or-Cancel (IOC) Orders
Fill-or-Kill (FOK) Orders
Other Advanced Variations (Trailing Stop, Bracket Orders, OCO, etc.)
We’ll focus mainly on the basic trading orders, while also touching upon variations.
4. Market Order
Definition
A market order is the simplest type of order: an instruction to buy or sell immediately at the best available current market price.
Mechanism
When a trader places a market buy order, it matches with the lowest available sell (ask) price.
When placing a market sell order, it matches with the highest available buy (bid) price.
Execution is guaranteed, but the exact price may vary slightly due to market volatility.
Example
If Infosys stock is quoted at ₹1,600 (bid ₹1,599, ask ₹1,601):
A market buy order executes at ₹1,601.
A market sell order executes at ₹1,599.
Advantages
Immediate execution.
Simple and beginner-friendly.
Ensures participation in fast-moving markets.
Disadvantages
No control over price.
Slippage risk during volatile periods.
5. Limit Order
Definition
A limit order specifies the maximum price you are willing to pay when buying or the minimum price you are willing to accept when selling. Execution happens only if the market reaches that price.
Mechanism
Buy Limit Order: Executes at the specified price or lower.
Sell Limit Order: Executes at the specified price or higher.
Example
If Reliance is trading at ₹2,450:
Buy Limit at ₹2,400 → Order executes only if price falls to ₹2,400 or below.
Sell Limit at ₹2,500 → Order executes only if price rises to ₹2,500 or above.
Advantages
Full control over execution price.
Useful for buying at dips and selling at rallies.
Disadvantages
No guarantee of execution (price may never reach the limit).
Risk of missing opportunities in fast markets.
6. Stop Order (Stop-Loss Order)
Definition
A stop order is triggered only when the market reaches a specified stop price. It then converts into a market order.
Types
Buy Stop: Placed above market price to enter a trade once momentum confirms.
Sell Stop (Stop-Loss): Placed below market price to limit potential losses.
Example
Infosys trading at ₹1,600:
Buy Stop at ₹1,650 → Buy only if price breaks above ₹1,650.
Sell Stop at ₹1,550 → Sell if price drops below ₹1,550 (to limit loss).
Advantages
Essential for risk management.
Automates exits and entries.
Disadvantages
May trigger due to short-term volatility (“stop hunting”).
Executes at next available market price, which may differ.
7. Stop-Limit Order
Definition
A stop-limit order combines stop and limit orders. When the stop price is reached, the order becomes a limit order rather than a market order.
Mechanism
Offers more control by ensuring execution only within a specified price range.
But risks non-execution if the market skips through the limit level.
Example
Infosys at ₹1,600:
Stop ₹1,550, Limit ₹1,545 → If price falls to ₹1,550, a sell limit order at ₹1,545 is placed.
Advantages
Protection from large slippage.
Allows precise strategy.
Disadvantages
May not execute if market gaps below limit price.
8. Day Orders vs GTC Orders
Day Order
Valid only for the trading day.
If not executed by market close, it expires.
Good Till Cancelled (GTC)
Remains active until executed or manually cancelled.
Useful for long-term strategies.
9. IOC and FOK Orders
Immediate-or-Cancel (IOC)
Executes all or part of the order immediately.
Cancels any unexecuted portion.
Fill-or-Kill (FOK)
Executes the entire order immediately.
If not possible, cancels completely.
10. Practical Examples of Basic Trading Orders
Intraday Trader: Uses market orders for quick scalping.
Swing Trader: Places limit orders to buy dips and sell rallies.
Long-Term Investor: Uses GTC limit orders to accumulate at attractive levels.
Risk-Conscious Trader: Relies on stop-loss orders to protect capital.
Conclusion
Basic trading orders are the foundation of market participation. They empower traders to:
Control price and timing.
Manage risks effectively.
Automate trades to reduce emotional errors.
While market, limit, stop, and stop-limit orders form the backbone of trading, advanced variations like GTC, IOC, FOK, and bracket orders enhance flexibility. A trader’s success depends not just on strategy but on the proper use of these orders to execute that strategy in real markets.
In essence, understanding trading orders is like learning the grammar of a language. Without mastering them, one cannot communicate effectively with the markets.

Role of Brokers and Sub-Brokers in IndiaIntroduction
The Indian financial market is one of the largest and fastest-growing markets in the world, supported by a strong regulatory framework, technological adoption, and rising investor participation. Stock exchanges like the Bombay Stock Exchange (BSE) and the National Stock Exchange (NSE) are at the center of this growth, facilitating billions of trades every day. But ordinary investors cannot directly access these exchanges—there is an important intermediary system that bridges the gap between the investor and the stock market.
This intermediary system consists of stock brokers and sub-brokers, who play a pivotal role in connecting individuals and institutions to the securities market. Their functions go beyond simply buying and selling shares—they are responsible for advisory services, compliance, risk management, investor education, and ensuring fair trade execution.
In this article, we will explore in detail the role of brokers and sub-brokers in India, their regulatory framework, services, business models, challenges, and the evolving dynamics of brokerage in a digital-first economy.
Chapter 1: Understanding Brokers in India
1.1 Who is a Broker?
A stock broker is a market intermediary who is authorized to trade in securities on behalf of investors. Brokers are registered members of recognized stock exchanges like BSE, NSE, MCX, etc., and they execute buy/sell orders for clients in return for a commission or brokerage fee.
A broker can be:
Full-service broker: Offers a wide range of services including investment advice, research, portfolio management, and wealth management. Examples: ICICI Direct, Kotak Securities, HDFC Securities.
Discount broker: Focuses on low-cost trading with minimal services, leveraging technology to reduce costs. Examples: Zerodha, Upstox, Angel One, Groww.
1.2 Role of Brokers in the Indian Capital Market
The broker’s role is not limited to just order execution. Their responsibilities include:
Order Execution: Placing buy/sell orders for clients at the best possible prices.
Advisory Services: Guiding investors on market trends, stock recommendations, and investment strategies.
Research & Analysis: Providing technical, fundamental, and sectoral research reports.
Compliance & KYC: Ensuring client KYC, anti-money laundering (AML) checks, and regulatory compliance.
Risk Management: Monitoring margin requirements, exposure limits, and preventing defaults.
Investor Education: Conducting webinars, training, and knowledge sessions for retail investors.
Chapter 2: Understanding Sub-Brokers in India
2.1 Who is a Sub-Broker?
A sub-broker is an agent or franchisee who works under a registered broker to provide access to clients. Unlike brokers, sub-brokers are not direct members of the stock exchange. They act as local representatives of big brokerage houses, extending their services to smaller towns and cities.
For example: A small-town investor in Uttar Pradesh may trade via a sub-broker of ICICI Direct or Angel One, instead of directly connecting with the central brokerage.
2.2 Functions of Sub-Brokers
Client Acquisition: Bringing in new investors from local regions.
Client Servicing: Assisting clients with account opening, trade execution, and documentation.
Relationship Management: Maintaining trust and long-term relations with investors.
Education: Guiding first-time investors about markets and trading platforms.
Revenue Sharing: Earning a portion of brokerage generated by clients they onboard.
2.3 Sub-Broker vs Authorized Person (AP)
Earlier, SEBI recognized “sub-brokers” as intermediaries. However, since 2018, the concept of sub-brokers has been merged with the category of Authorized Persons (APs).
A sub-broker license is no longer issued.
New intermediaries now register as Authorized Persons under brokers, making the system simpler and more transparent.
Chapter 3: Regulatory Framework Governing Brokers and Sub-Brokers
3.1 SEBI Regulations
The Securities and Exchange Board of India (SEBI) regulates all brokers and sub-brokers in India. Key responsibilities include:
Registration of brokers and APs.
Setting capital adequacy requirements.
Ensuring fair practices and investor protection.
Monitoring brokerage charges.
Enforcing compliance, penalties, and suspensions when required.
3.2 Stock Exchanges’ Role
Exchanges like NSE and BSE maintain:
Membership eligibility criteria.
Trading and risk management systems.
Grievance redressal mechanisms for clients.
3.3 Compliance Requirements for Brokers
Net Worth Requirements: Minimum net worth for full-service and discount brokers.
Deposits: Security deposits with stock exchanges.
KYC Norms: Adherence to KYC and AML regulations.
Audit Reports: Submission of financial and compliance audits.
Chapter 4: Services Offered by Brokers and Sub-Brokers
4.1 Trading Facilities
Equity delivery & intraday trading.
Futures & options (F&O) derivatives trading.
Commodity trading (MCX, NCDEX).
Currency derivatives.
4.2 Investment Services
Mutual funds distribution.
IPO investments.
Bonds, debentures, and government securities.
Portfolio management services (PMS).
4.3 Research & Advisory
Technical charts, indicators, and patterns.
Fundamental analysis of companies.
Sectoral & macroeconomic research.
Personalized advisory for HNIs (High Net Worth Individuals).
4.4 Technology & Platforms
Modern brokers offer:
Mobile trading apps.
Algo-trading and APIs.
AI-based portfolio analysis.
Robo-advisory services.
Chapter 5: Business Models of Brokers and Sub-Brokers
5.1 Brokerage Fee Models
Percentage-based brokerage: Charged as % of transaction value (common in full-service brokers).
Flat-fee brokerage: Fixed fee per trade (popular with discount brokers like Zerodha, Groww).
5.2 Revenue Sharing Model with Sub-Brokers/APs
Sub-brokers earn a percentage (30–60%) of the brokerage generated by their clients.
Larger franchisees with bigger client bases get better revenue-sharing ratios.
5.3 Value-Added Services
Insurance distribution.
Wealth management.
Research subscriptions.
Chapter 6: Importance of Brokers and Sub-Brokers in India
Market Access: Enable lakhs of investors to trade without being direct members of exchanges.
Financial Inclusion: Expand capital market reach to tier-2 and tier-3 cities.
Liquidity Creation: More participants = higher market liquidity.
Investor Education: Teach first-time traders about risks and opportunities.
Compliance & Safety: Safeguard investors through regulated trading systems.
Chapter 7: Challenges Faced by Brokers and Sub-Brokers
Competition from Discount Brokers: Traditional brokers face pricing pressure.
Regulatory Burden: Constant compliance requirements increase costs.
Technological Upgradation: Need to invest heavily in digital platforms.
Client Defaults & Fraud: Risk of misuse of margin or client funds.
Thin Margins: Reduced brokerage rates have lowered profitability.
Chapter 8: Future of Brokers and Sub-Brokers in India
Shift to Technology: AI, machine learning, and algo-trading adoption.
Rise of Discount Brokers: Market share shifting to low-cost platforms like Zerodha & Groww.
Hybrid Model: Combination of advisory + low-cost execution.
Financial Inclusion: Deeper penetration in rural India through APs and digital platforms.
Global Integration: Indian brokers offering access to global equities, ETFs, and commodities.
Conclusion
Brokers and sub-brokers (or Authorized Persons) form the backbone of India’s stock market ecosystem. They democratize access to markets, educate investors, provide liquidity, and ensure regulatory compliance. Over the decades, their role has evolved from traditional floor-based trading to digital-first platforms, with a growing emphasis on low-cost execution, technology, and advisory services.
While discount brokers are reshaping the competitive landscape, full-service brokers and sub-brokers remain vital for personalized services, financial literacy, and expanding market reach. The future will likely see a convergence of technology, advisory, and financial inclusion, making brokers and sub-brokers even more crucial in India’s journey toward becoming a global financial powerhouse.

Part 2 Trading Master ClassPsychology of Options Trading
Discipline and patience are crucial. Many beginners lose money because they:
Over-leverage.
Ignore volatility.
Fail to manage positions.
Professional traders rely on data-driven strategies, not emotions.
Conclusion
Options trading strategies are powerful tools that allow traders to tailor risk and reward according to their outlook. From simple long calls and puts to complex spreads and condors, each strategy has its place in the trader’s toolkit. The key is to understand market conditions, implied volatility, and risk tolerance.
In essence, options trading is like a chess game in the financial markets—requiring foresight, planning, and strategic execution. Traders who master options can generate income, hedge portfolios, and take advantage of unique opportunities that stocks alone cannot offer.
Why Use Options?
Options provide traders with:
Leverage: Control a large position with a smaller investment.
Flexibility: Create strategies for any market scenario.
Risk Management: Hedge against adverse price movements.
Income Generation: Sell options to collect premium.

Part 1 Trading Master ClassReal-World Applications of Options
Hedging
Institutions hedge portfolios using index options. For example, buying Nifty puts to protect against market crash.
Income Generation
Funds sell covered calls or iron condors to earn steady income.
Event-Based Trading
Earnings announcements, policy changes, and global events cause volatility—ideal for straddles or strangles.
Speculation with Leverage
Traders use calls/puts for leveraged bets on short-term moves.
Pros and Cons of Options Trading
Pros
Flexibility in strategy.
Limited risk (for buyers).
High leverage.
Ability to profit in all market conditions.
Cons
Complexity.
Time decay erodes value of options.
Volatility risk.
Unlimited risk (for sellers).

COLPAL | Double Bottom Retest + Volume Breakout🚀 COLPAL | Double Bottom Retest + Volume Breakout
📌 Pattern Setup:
🔹 Double Bottom retest spotted
🔹 Bullish Engulfing candle at support
🔹 Breakout candle with strong volume surge
📊 Technical Snapshot:
RSI: 58 → Healthy momentum
MACD: Bullish crossover
CCI: 107 → Strong positive bias
Stochastic: 89 → Overbought but strong
Volume: 1.22M vs 626k avg → ⚡ Breakout confirmed
🛠 Levels to Watch:
🔼 Long Entry: Above 2357.9
🔽 Stoploss: Below 2243
🎯 Targets: 2472 | 2587
📉 Pullback Buy Zone: 2291–2273
❌ Invalidation: Below 2207
⚡ Resistance Levels: 2382 | 2424 | 2490
⚡ Support Levels: 2274 | 2208 | 2167
🎯 Fibonacci Zones: 2378 → 2449 → 2519 → 2619 → 2747
💡 View:
COLPAL is breaking out from a Double Bottom Retest with strong volume & bullish signals. Sustaining above 2358 could open the gates towards 2472 – 2587 in the short term.
👉 Bias: Bullish till 2207 holds.
⚠️ Disclaimer – Please Read Carefully
The information shared here is meant purely for learning and awareness. It is not a buy or sell recommendation and should not be taken as investment advice. I am not a SEBI-registered investment advisor, and all views expressed are based on personal study, chart patterns, and publicly available market data.
Trading — whether in stocks or options — carries risk. Markets can move unexpectedly, and losses can sometimes exceed the money you have invested. Past performance or past setups do not guarantee future results.
If you are a beginner, treat this as a guide to understand how the market works — practice on paper trades before risking real money. If you are experienced, always assess your own risk, position sizing, and strategy suitability before entering trades.
Consult a SEBI-registered financial advisor before making any real trading decision. By engaging with this content, you acknowledge full responsibility for your trades and investments.
💬 Found this useful?
🔼 Give this post a Boost to help more traders discover clean, structured learning.
✍️ Drop your thoughts, questions, or setups in the comments — let’s grow together!
🔁 Share with fellow traders and beginners to spread awareness.
👉 “If you liked this breakdown, follow for more clean, structured setups with discipline at the core.”
🚀 Stay Calm. Stay Clean. Trade With Patience.
Trade Smart | Learn Zones | Be Self-Reliant 📊
Laxmi Organic Industries Ltd. 1 Day View1-Day Technical Overview & Key Levels
Daily Technical Indicators (Investing.com – Aug 28, 2025)
Overall sentiment: Neutral on the daily timeframe
Indicators:
RSI(14): ~32.74 — signals Sell (approaching oversold)
MACD: –2.49 — Sell
Stochastic: ~35.07 — Sell
Many indicators lean bearish, though the summary remains neutral
Moving Averages (Investing.com – Aug 28, 2025)
Mixed signals:
Sell from MA5, MA10, MA20, MA50.
Buy from MA100, MA200.
Overall: 4 buy vs 8 sell signals from various MAs
Pivot Points & Intraday Levels (Investing.com – Aug 28, 2025)
Classic Pivot:
Support: S1 = ₹207.57, S2 = ₹207.24, S3 = ₹206.83
Pivot: ₹207.98
Resistance: R1 = ₹208.31, R2 = ₹208.72, R3 = ₹209.05
Fibonacci Pivot:
Similar zone: S1 ≈ ₹210.54, Pivot ≈ ₹207.98, R1 ≈ ₹216.99
Suggested Next Steps
Watch price action around ₹205–210 for reversal setups (bullish engulfing, RSI bounce).
A sustained break above ₹213–215 could open the way toward ₹220+.
Conversely, failure to hold ₹205–208 might trigger deeper correction toward ₹200 or below.
Consider combining daily with intraday (hourly/15-minute) to capture momentum early.

TITAN – Cup & Handle Breakout Retest📊 TITAN – Technical & Fundamental Educational Snapshot
Ticker: NSE: TITAN | Sector: Consumer – Lifestyle & Jewellery
CMP: ₹3,637.70
Rating: ⭐⭐⭐⭐ (Bullish Setup – For Educational Purposes Only)
Pattern Observed: ☕📈 Cup & Handle Breakout Retest
📊 Technical Observations
Titan Company Ltd. (CMP: ₹3,637.7) is presently exhibiting a Cup & Handle formation, with the price recently retesting the handle zone around ₹3,550–₹3,600 and showing signs of strength supported by healthy volumes. On the technical front, important resistance levels are noted around ₹3,675, ₹3,712, and ₹3,773, while support levels lie near ₹3,576, ₹3,515, and ₹3,477. Key indicators currently reflect positive momentum, with RSI around 65, MACD showing bullish signals on multiple timeframes, and CCI at 92, while the Stochastic indicator is in the higher zone (88–94), suggesting overbought but trending conditions. Volumes stood at ~989K, higher than the 20-day average of ~740K, indicating increased participation. Price action is also holding above VWAP, with Bollinger Band dynamics hinting at the possibility of trend continuation.
📰 Fundamental & News Flow
In its Q1 FY26 results, Titan Company Ltd. reported around 11% year-on-year revenue growth, primarily supported by sustained jewellery demand, although margins were modestly affected due to gold price volatility. The company continues to witness healthy traction in its Tanishq jewellery and Titan Eye+ businesses, alongside a recovery trend in watches and wearables. Titan has also been pursuing aggressive retail expansion, and the upcoming festive season is expected to support consumer demand further. From a structural perspective, the company is often highlighted for its premium brand positioning, robust balance sheet, and long-term jewellery demand drivers, which are considered key strengths in its sector.
📊 STWP Trade Analysis (Educational Purpose Only):
The recent price action indicates a Bullish Engulfing pattern followed by a Bullish Piercing formation, which are generally studied as signs of positive sentiment when supported by volumes. After the retest, a reference level around ₹3,726.50 may be noted, while the Bullish Piercing structure also highlights an observation zone near ₹3,650.90, with further upward reference levels around ₹3,752 and ₹3,854, and a protective support reference near ₹3,549. From a Fibonacci retracement perspective, a pullback level is visible near ₹3,566, with an invalidation reference around ₹3,516.