Part 6 Institutional Trading The Greeks: The Math Behind Options
Advanced traders use Greeks to understand risks.
Delta → Sensitivity of option price to stock price movement.
Gamma → Rate of change of Delta.
Theta → Time decay (how much option loses daily).
Vega → Sensitivity to volatility.
Rho → Sensitivity to interest rates.
Example:
A Call with Delta = 0.6 → If stock rises ₹10, option rises ₹6.
Theta = –5 → Option loses ₹5 daily as time passes.
Options vs Futures
Both are derivatives, but with a key difference:
Futures → Obligation to buy/sell at a price.
Options → Right, not obligation.
Example:
Futures are like booking a hotel room—you must pay whether you stay or not.
Options are like paying for a movie ticket—if you don’t watch, you lose only ticket price.
Learntotrade

Divergence SecretsOptions vs Futures
Futures = Obligation to buy/sell at fixed price.
Options = Right but not obligation.
Options require smaller margin (if buying).
Real-Life Example of Hedging
Suppose you own TCS shares worth ₹10 lakhs. You fear the market may fall in the next month.
👉 Solution: Buy a Put Option.
Strike: Slightly below current market price.
Cost: Small premium.
If market falls → Loss in shares covered by profit in Put.
If market rises → You lose premium but enjoy profit in shares.
This is like insurance.
Psychology of Options Trading
Options require quick decision-making. Traders often get trapped in:
Over-leverage → Buying too many lots.
Greed → Holding positions too long.
Fear → Exiting too early.
Successful option traders follow discipline, risk management, and proper strategy.

Financial Markets1. Introduction
Financial markets are the backbone of modern economies, serving as platforms where individuals, companies, and governments can raise capital, trade financial instruments, and manage risks. They facilitate the flow of funds from surplus units (those with excess capital) to deficit units (those in need of funds), enabling economic growth and development.
At their core, financial markets serve three primary functions:
Price Discovery – determining the price of financial assets through supply and demand.
Liquidity Provision – enabling participants to buy and sell assets easily.
Risk Management – allowing participants to hedge against uncertainties like interest rate changes, inflation, or currency fluctuations.
2. Types of Financial Markets
Financial markets are broadly classified into several categories based on the nature of the assets traded and the maturity of the instruments.
2.1 Capital Markets
Capital markets are where long-term securities, such as stocks and bonds, are bought and sold. They are crucial for channeling savings into productive investments. Capital markets are further divided into:
2.1.1 Stock Markets
The stock market is where equity shares of companies are issued and traded. Equity represents ownership in a company, and investors earn returns through dividends and capital appreciation. Stock markets can be divided into:
Primary Market: Where companies issue new shares through Initial Public Offerings (IPOs) or Follow-on Public Offers (FPOs). It allows companies to raise long-term capital directly from investors.
Secondary Market: Where existing shares are traded among investors. This includes major exchanges like the New York Stock Exchange (NYSE), NASDAQ, and Bombay Stock Exchange (BSE).
Key functions of stock markets:
Facilitating capital formation.
Providing liquidity for investors.
Helping in price discovery and valuation of companies.
2.1.2 Bond Markets
Bond markets, or debt markets, involve the issuance and trading of debt securities such as government bonds, corporate bonds, and municipal bonds. Bonds allow governments and corporations to borrow funds from the public with a promise to repay principal and interest. Types of bonds include:
Government Bonds – low-risk, used to fund national projects.
Corporate Bonds – medium to high-risk, issued by companies for expansion.
Municipal Bonds – issued by local governments to fund infrastructure projects.
2.2 Money Markets
Money markets deal with short-term borrowing and lending, typically with maturities of less than one year. They are essential for managing liquidity and short-term funding needs. Common instruments in money markets include:
Treasury Bills (T-Bills) – short-term government securities.
Commercial Paper (CP) – unsecured, short-term debt issued by corporations.
Certificates of Deposit (CDs) – issued by banks for fixed short-term deposits.
Repurchase Agreements (Repos) – short-term borrowing secured against securities.
Money markets are highly liquid and considered low-risk. They play a crucial role in interest rate determination and monetary policy implementation.
2.3 Derivatives Markets
Derivatives are financial instruments whose value depends on an underlying asset, such as stocks, bonds, currencies, commodities, or indices. They are primarily used for hedging risk, speculation, and arbitrage. Common derivatives include:
Futures Contracts – agreements to buy or sell an asset at a predetermined price on a future date.
Options Contracts – giving the right, but not the obligation, to buy or sell an asset.
Swaps – contracts to exchange cash flows, such as interest rate or currency swaps.
Forwards – customized contracts to buy or sell an asset at a future date.
Derivatives markets help stabilize prices, manage risk, and improve market efficiency.
2.4 Foreign Exchange (Forex) Markets
The forex market is the global marketplace for trading currencies. It determines exchange rates and facilitates international trade and investment. Key participants include central banks, commercial banks, hedge funds, multinational corporations, and retail traders. The forex market is the largest financial market in the world, with daily trading exceeding $6 trillion.
Functions:
Facilitates international trade and investment.
Helps hedge against currency risks.
Influences inflation and interest rates globally.
2.5 Commodity Markets
Commodity markets trade physical goods like gold, silver, oil, agricultural products, and industrial metals. They can be classified into:
Spot Markets – trading commodities for immediate delivery.
Futures Markets – trading contracts for future delivery, helping producers and consumers hedge against price fluctuations.
Commodity markets are essential for price discovery, risk management, and economic planning.
3. Functions of Financial Markets
Financial markets perform several key functions that sustain economic growth:
Mobilization of Savings – They convert individual savings into productive investments.
Resource Allocation – Financial markets ensure efficient allocation of funds to projects with the highest potential returns.
Price Discovery – Markets determine prices based on supply and demand.
Liquidity Provision – Investors can convert securities into cash quickly.
Risk Management – Derivatives and insurance instruments help mitigate financial risks.
Reduction in Transaction Costs – Centralized markets reduce costs of buying and selling securities.
Economic Indicator – Financial market trends often signal economic conditions, growth, or recessions.
4. Participants in Financial Markets
Various participants operate in financial markets, each with distinct roles and objectives.
4.1 Individual Investors
Individuals invest in stocks, bonds, mutual funds, and ETFs for wealth creation, retirement planning, and income generation.
4.2 Institutional Investors
Large organizations, such as mutual funds, pension funds, insurance companies, and hedge funds, participate with significant capital, influencing market movements.
4.3 Corporations
Corporations raise capital by issuing equity or debt and may also hedge risks using derivatives.
4.4 Governments
Governments issue bonds to finance deficits, regulate financial markets, and implement monetary policies.
4.5 Intermediaries
Banks, brokers, and investment advisors facilitate transactions, provide liquidity, and offer investment guidance.
5. Instruments Traded in Financial Markets
Financial markets involve a wide variety of instruments:
Equities (Stocks) – ownership in companies.
Debt Instruments (Bonds, Debentures, CPs) – borrowing contracts.
Derivatives (Futures, Options, Swaps) – risk management instruments.
Foreign Exchange (Currency pairs) – global currency trading.
Commodities (Gold, Oil, Wheat, etc.) – physical or derivative-based trade.
Mutual Funds & ETFs – pooled investment vehicles.
Cryptocurrencies (Bitcoin, Ethereum, etc.) – emerging digital assets.
6. Regulatory Framework
Financial markets are heavily regulated to maintain transparency, fairness, and investor protection. Regulatory bodies include:
Securities and Exchange Board of India (SEBI) – regulates Indian securities markets.
U.S. Securities and Exchange Commission (SEC) – oversees American securities markets.
Commodity Futures Trading Commission (CFTC) – regulates derivatives and commodity trading.
Central Banks – control money supply, interest rates, and banking regulations.
Regulation ensures stability, reduces fraud, and maintains investor confidence.
7. Technology and Financial Markets
Technological advancements have transformed financial markets:
Algorithmic Trading – automated trading using mathematical models.
High-Frequency Trading (HFT) – executing large volumes of trades in milliseconds.
Blockchain and Cryptocurrencies – decentralized, secure trading platforms.
Robo-Advisors – AI-based investment advisory services.
Mobile Trading Apps – enabling retail investors to trade seamlessly.
Technology improves efficiency, reduces costs, and increases accessibility.
8. Challenges in Financial Markets
Despite their benefits, financial markets face several challenges:
Market Volatility – prices can fluctuate due to economic, political, or global events.
Fraud and Manipulation – insider trading and market rigging remain risks.
Liquidity Risks – lack of buyers or sellers can affect market stability.
Regulatory Gaps – outdated regulations may fail to address new instruments.
Global Interconnectivity – crises in one market can affect others globally.
9. Recent Trends
Modern financial markets are evolving rapidly:
ESG Investing – focus on environmentally and socially responsible investments.
Digital Assets – growth of cryptocurrencies and tokenized securities.
Sustainable Finance – promoting green bonds and renewable energy projects.
Globalization of Markets – increased cross-border investments.
Financial Inclusion – mobile and digital platforms enabling wider participation.
10. Conclusion
Financial markets are the lifeblood of the global economy. They channel funds efficiently, provide investment opportunities, allow risk management, and drive economic growth. With technological advancements, regulatory oversight, and innovative instruments, financial markets continue to evolve, shaping the modern financial landscape.
Understanding these markets is crucial for investors, policymakers, and corporations to make informed decisions and navigate the complexities of the financial world.

Part 1 Candlestick PatternPractical Examples
Example 1: Bullish Trade
Buy 1 call of Stock A at ₹100 strike, premium ₹5.
Stock rises to ₹120.
Profit = (120 – 100) – 5 = ₹15 per share.
Example 2: Bearish Trade
Buy 1 put of Stock B at ₹150 strike, premium ₹8.
Stock falls to ₹130.
Profit = (150 – 130) – 8 = ₹12 per share.
Example 3: Covered Call
Own Stock C at ₹200.
Sell call at ₹220, premium ₹5.
Stock rises to ₹230.
Profit = (220 – 200) + 5 = ₹25 (missed extra ₹10).
Protection against small drops due to premium received.
Advantages of Options
Limited risk for buyers
Leverage potential
Flexibility in strategy
Hedging capabilities
Profit from multiple market directions

Trading Master Class With ExpertsRisk and Reward in Options
Options provide defined risk for buyers and potential risk for sellers:
Buyers: Maximum loss = premium paid, profit = theoretically unlimited for calls, limited for puts.
Sellers (writers): Maximum profit = premium received, risk = potentially unlimited for uncovered calls, high for puts.
Example:
Selling a call without owning the stock (naked call) can lead to unlimited losses if the stock skyrockets.
Buying a put limits risk but can still profit from sharp downward moves.
Hedging with Options
Options are a powerful tool for hedging investments:
Protective Put: Buying a put on a stock you own protects against a decline.
Collar Strategy: Buy a put and sell a call to limit both upside and downside risk.
Portfolio Insurance: Large investors use index options to protect portfolios during market volatility.

Part 1 Ride The Big Moves Options trading is one of the most versatile tools in financial markets, allowing traders and investors to hedge risk, generate income, and speculate on price movements. While options can seem complex at first, understanding their structure, types, and strategies can make them an invaluable part of your trading toolkit.
What Are Options?
An option is a financial contract that gives the holder the right, but not the obligation, to buy or sell an underlying asset (like stocks, indices, or commodities) at a predetermined price within a specific period. Unlike futures or stocks, options provide flexibility and limited risk.
There are two main types of options:
Call Option: Gives the buyer the right to buy the underlying asset at a predetermined price (strike price) before or on the expiration date.
Put Option: Gives the buyer the right to sell the underlying asset at the strike price before or on expiration.
Key terms to understand:
Underlying Asset: The stock, index, commodity, or currency on which the option is based.
Strike Price: The price at which the option can be exercised.
Premium: The price paid to buy the option.
Expiration Date: The date on which the option expires.
In-the-Money (ITM): Options with intrinsic value (profitable if exercised now).
Out-of-the-Money (OTM): Options without intrinsic value (currently unprofitable).
At-the-Money (ATM): Option strike price equals the underlying asset price.

Hindustan Unilever lTd 1 Hour ViewHindustan Unilever Ltd. (HINDUNILVR):
According to Investing.com, the stock is currently trading at ₹2,652.90, showing a gain of about 0.81% from the previous close
Moneycontrol reports a similar price range: previous close at ₹2,631.60, with an intraday range between ₹2,624.60 and ₹2,659.70
Economic Times confirms today’s trading around ₹2,652.70, reflecting an approximate 0.81% uptick
Hourly Moving Average Trend
The TopStockResearch "TSR Strength Indicator" shows neutral sentiment on the hourly moving averages:
Current price: ~₹2,629.90 (with daily range ~₹2,619–₹2,658)
Signal: Neutral
Strength: Stock is more bullish than about 82.7% of peers
To view the exact 1-hour level—such as the opening, high, low, or current price over the last hour—you’ll need a real-time intraday chart. Platforms like NSE India’s official site, TradingView, or Investing.com’s interactive chart are perfect for this. You can set the chart timeframe to 1-hour and hover over the latest bar to see the precise price levels.

Options Trading Basics1. Introduction: What Are Options?
When you hear the word “options” in trading, it might sound complicated. But the truth is, options are just financial contracts that give you a choice.
The word “option” itself means a choice or possibility. In the stock market, options give you the right (but not the obligation) to buy or sell an asset (like stocks, index, or commodity) at a fixed price within a specific time.
If you buy an option, you’re buying the right to do something in the market.
If you sell (write) an option, you’re giving someone else that right.
Think of it like booking a movie ticket online. You pay ₹200 to book a seat (premium). If you go to the movie, great. If you skip it, you lose the ₹200 booking fee. That’s how options work—you pay for the right, but you don’t have to use it.
2. Why Do People Trade Options?
Options are popular because they offer flexibility and leverage. Traders and investors use options for three main reasons:
Speculation (to make profits) – Betting on stock prices moving up or down.
Hedging (to protect investments) – Like insurance for your portfolio.
Income generation – Selling options to earn premiums regularly.
Example:
Suppose you think Reliance stock (currently ₹2,500) will rise to ₹2,700. Instead of buying 100 shares (₹2,50,000 required), you can buy a call option by paying just ₹5,000 premium. If Reliance rises, your profit can be huge compared to the small amount invested.
That’s why options are powerful. But with power comes risk, so you need to understand the basics deeply.
3. Key Terms in Options Trading
Before diving deeper, let’s learn the basic vocabulary:
Underlying Asset: The stock or index on which the option is based (like Reliance, TCS, or Nifty50).
Strike Price: The fixed price at which you can buy/sell the asset using the option.
Expiry Date: The last date until the option is valid.
Premium: The price you pay to buy an option.
Lot Size: Options are traded in fixed quantities called lots (e.g., Nifty option lot size = 50 units).
In-the-Money (ITM): When exercising the option is profitable.
Out-of-the-Money (OTM): When exercising the option gives no benefit.
At-the-Money (ATM): When the strike price is the same as the market price.
Keep these terms in mind—we’ll use them often.
4. Two Types of Options: Call & Put
There are only two types of options you need to remember:
a) Call Option (Right to Buy)
A call option gives the buyer the right (not obligation) to buy a stock at a fixed strike price.
You buy a call when you expect the stock price will go up.
Example:
Reliance is at ₹2,500.
You buy a Reliance Call option with strike price ₹2,600 by paying ₹50 premium.
If Reliance goes to ₹2,700, your option is profitable.
If Reliance stays below ₹2,600, you lose only the premium (₹50).
b) Put Option (Right to Sell)
A put option gives the buyer the right (not obligation) to sell a stock at a fixed strike price.
You buy a put when you expect the stock price will go down.
Example:
Infosys is at ₹1,400.
You buy a Put option with strike price ₹1,380 for ₹20 premium.
If Infosys falls to ₹1,350, your put option is profitable.
If Infosys goes above ₹1,380, you lose only the premium.
5. Who Are the Players in Options Trading?
There are two sides in every option contract:
Option Buyer – Pays premium, gets the right (call = buy, put = sell).
Limited risk (only the premium).
Unlimited profit potential.
Option Seller (Writer) – Receives premium, gives the right.
Limited profit (only the premium).
Unlimited risk potential.
This is like insurance:
Buyer = person buying insurance (pays premium).
Seller = insurance company (earns premium but takes big risk).
6. How Options Work in Real Life (Simple Example)
Let’s simplify with a real-life analogy.
Imagine you want to buy a flat worth ₹50 lakhs, but you’re not sure. So, you sign an agreement with the owner:
You pay ₹2 lakhs today as an advance (premium).
The agreement says: Within 6 months, you can buy the flat at ₹50 lakhs (strike price).
If flat prices rise to ₹60 lakhs, you can still buy it for ₹50 lakhs—huge profit!
If flat prices drop to ₹45 lakhs, you won’t buy. You just lose the ₹2 lakhs advance.
That’s exactly how options trading works.
7. How to Read an Option Quote
Let’s say you see this on NSE:
Nifty 18,000 CE @ ₹120, Expiry 30-August
Breaking it down:
Nifty = Underlying asset
18,000 = Strike price
CE = Call Option
₹120 = Premium (price of the option)
30-August = Expiry date
So, if you buy this option, you are paying ₹120 × 50 (lot size) = ₹6,000 to get the right to buy Nifty at 18,000 before expiry.
8. How Option Prices Are Decided
Option premiums are influenced by:
Intrinsic Value – The real value (how much profit if exercised now).
Time Value – Extra premium for the time left until expiry.
Volatility – If stock moves a lot, option premiums become expensive.
Interest rates & demand-supply – Minor factors.
9. Payoff Scenarios: Buyer vs Seller
Call Option Buyer
Profit if price rises above strike + premium.
Loss limited to premium.
Call Option Seller
Profit limited to premium received.
Loss unlimited if price rises sharply.
Put Option Buyer
Profit if price falls below strike - premium.
Loss limited to premium.
Put Option Seller
Profit limited to premium received.
Loss unlimited if price crashes.
10. Options vs Futures vs Stocks
Stocks: Buy & hold actual shares.
Futures: Agreement to buy/sell at fixed price in future (obligation).
Options: Right, but not obligation, to buy/sell.
That “no obligation” part makes options unique.
11. Strategies in Options Trading (Basics)
You don’t always have to just buy or sell a single option. Traders use strategies by combining call & put options.
Some basic strategies:
Buying Calls – When you expect big upward movement.
Buying Puts – When you expect big downward movement.
Covered Call – Holding stock + selling call to earn income.
Protective Put – Holding stock + buying put as insurance.
Straddle – Buy call + put at same strike (expecting big movement either side).
Iron Condor – Complex strategy to earn steady premium in range-bound market.
12. Advantages of Options Trading
Leverage – Small capital, big exposure.
Limited Risk for Buyers – Risk only the premium.
Flexibility – Can profit in up, down, or sideways markets.
Hedging Tool – Protects portfolio.
Income Generation – Selling options brings regular premium income.
Conclusion
Options trading is like a double-edged sword. Used wisely, it can give you high returns, protection, and steady income. Used recklessly, it can lead to massive losses.
So, learn the basics, understand risk, and start step by step. Once you master it, options become one of the most powerful tools in the financial market.
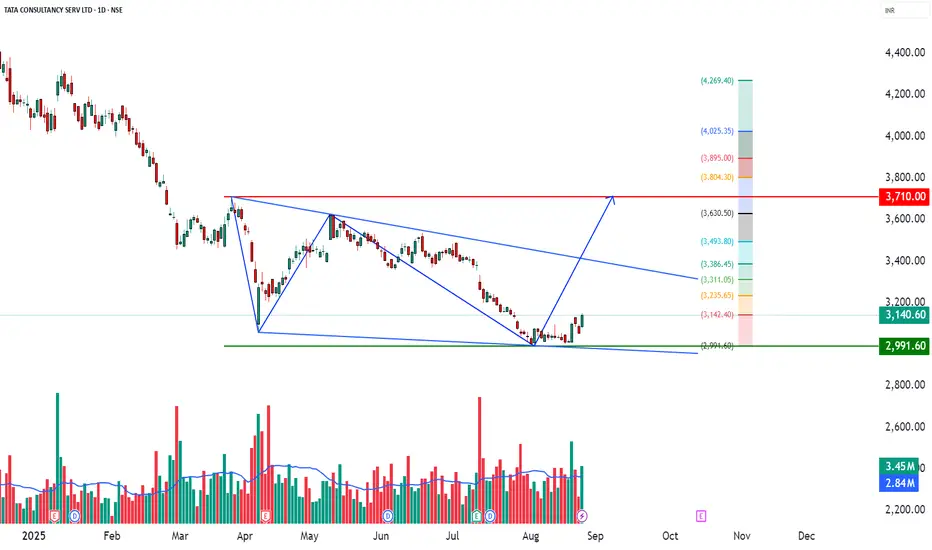
TCS – upport Bounce with Volume Confirmation📊 TCS – Technical & Educational Snapshot
Ticker: NSE:TCS | Sector: 💻 IT Services
CMP: ₹3,140.60 ▲ (+2.84% | 26 Aug 2025)
Learning Bias (for study purpose): ⭐⭐⭐ (Cautiously Bullish)
Pattern Observed: 📈 Support Bounce with Volume Confirmation
📰 Sentiment Analysis
👉 Overall Sentiment: Moderately Positive ✅
Bullish Drivers:
• Bounce from strong support near ₹3,000 with bullish candle & above-avg volume
• RSI breakout + Bollinger Band expansion → fresh buying interest
• Publicly available analyst reports indicate average estimates around ₹3,725; strong bullish case highlighted up to ₹4,610
• IT sector optimism for H2 FY26 earnings recovery
Risks (Bearish Case):
• Broader trend still marked Downtrend ⚠️
• Stochastic at 92 → overbought in short-term
• Employee layoffs & union protests (~12K–30K) may dampen sentiment
• Failure to hold ₹3,047 (support) could trigger deeper correction
Short-term Outlook: Upside momentum possible towards ₹3,160–3,200, but resistance supply zone must be watched.
Long-term Outlook: Positive — strong fundamentals, debt-free balance sheet, consistent dividends, and sector recovery cues.
📊 Technical Snapshot
TCS has formed a support bounce near the ₹3,000 bottom range, supported by a strong bullish candle and above-average volume.
Indicators: MACD bullish on daily/weekly, neutral-to-bearish on monthly.
RSI ~54 → healthy momentum without being overheated.
Trend direction still tagged as Downtrend, hence positional caution is advised.
📊 Volume Check
🔹 Current Volume: 3.45M
🔹 20 SMA Volume: 2.84M ✅
💥 Above-average participation → validates breakout reliability.
💡 Interpretation: Stronger demand from institutions/traders supporting price action.
💡 Learnings
Support bounces near psychological zones (₹3,000 in this case) often attract buying interest.
When combined with RSI breakouts, Bollinger Band expansion, and volume confirmation, the setup becomes more reliable.
However, overbought stochastic warns of possible near-term pullbacks — hence, stop-loss discipline is key.
📌 Key Levels
Resistance: 3,169 | 3,198 | 3,244
Support: 3,094 | 3,048 | 3,019
Fibonacci Reference Levels: 2,991 | 3,142 | 3,235 | 3,311 | 3,386 | 3,494 | 3,631
🎯 STWP Learning Reference
• Observed bounce zone: ~₹3,152
• Key support level: ~₹3,047
• Upside reference zones (if momentum continues): 3,200 | 3,244 | 3,310
• Pullback watch zone: 3,048–3,095
• Invalidation reference: Below 2,991 → momentum weakens
⚠️ Disclaimer – Please Read Carefully
This post is shared only for educational and informational purposes. It is not investment advice or a recommendation to buy/sell any security. I am not a SEBI-registered investment advisor. Please do your own research or consult a SEBI-registered advisor before making trading or investment decisions.
Trading and investing involve risk. Past performance or past setups do not guarantee future results. Always use stop-loss, proper position sizing, and risk management.
💬 Found this useful?
🔼 Boost this post to help more traders discover clean setups.
✍️ Share your thoughts, setups, or questions in the comments — let’s learn together.
🔁 Repost to spread awareness among traders & beginners.
✅ Follow simpletradewithpatience for clean charts, price action insights & beginner-friendly setups.
🚀 Stay Calm. Stay Clean. Trade With Patience.
Trade Smart | Learn Zones | Be Self-Reliant 📊
Part 2 Trading Master Class With ExpertsOptions in Indian Markets
In India, options are traded on NSE and BSE, primarily on:
Index Options: Nifty, Bank Nifty (most liquid).
Stock Options: Reliance, TCS, Infosys, etc.
Weekly Expiry: Every Thursday (Nifty/Bank Nifty).
Lot Sizes: Fixed by exchanges (e.g., Nifty = 50 units).
Practical Example – Nifty Options Trade
Scenario:
Nifty at 20,000.
You expect big movement after RBI policy.
Strategy: Buy straddle (20,000 call + 20,000 put).
Cost = ₹200 (call) + ₹180 (put) = ₹380 × 50 = ₹19,000.
If Nifty moves to 20,800 → Call worth ₹800, Put worthless. Profit = ₹21,000.
If Nifty stays at 20,000 → Both expire worthless. Loss = ₹19,000.

Part 1 Trading Master Class With ExpertsIntermediate Option Strategies
Straddle – Buy Call + Buy Put (same strike/expiry). Best for high volatility.
Strangle – Buy OTM Call + Buy OTM Put. Cheaper than straddle.
Bull Call Spread – Buy lower strike call + Sell higher strike call.
Bear Put Spread – Buy higher strike put + Sell lower strike put.
Advanced Option Strategies
Iron Condor – Sell OTM call + OTM put, hedge with farther strikes. Good for sideways market.
Butterfly Spread – Combination of multiple calls/puts to profit from low volatility.
Calendar Spread – Buy long-term option, sell short-term option (same strike).
Ratio Spread – Sell multiple options against fewer long options.
Hedging with Options
Options aren’t just for speculation; they’re powerful hedging tools.
Portfolio Hedge: If you own a basket of stocks, buying index puts protects against a market crash.
Currency Hedge: Importers/exporters use currency options to lock exchange rates.
Commodity Hedge: Farmers hedge crops using options to lock minimum prices.

Part 1 Support and ResistanceCall and Put Options in Action
Call Option Example
Reliance is trading at ₹2500.
You buy a 1-month call option with strike price ₹2550, premium ₹50, lot size 505.
If Reliance rises to ₹2700 → Profit = (2700 - 2550 - 50) × 505 = ₹50,500.
If Reliance falls below 2550 → You lose only the premium (₹25,250).
Put Option Example
Nifty is at 20,000.
You buy a 1-month put option, strike 19,800, premium 100, lot size 50.
If Nifty falls to 19,200 → Profit = (19,800 - 19,200 - 100) × 50 = ₹25,000.
If Nifty rises above 19,800 → You lose premium (₹5,000).
Participants in Options Trading
Option Buyer – Pays premium, has limited risk and unlimited profit potential.
Option Seller (Writer) – Receives premium, has limited profit and potentially unlimited risk.
Example:
Buyer of call: Unlimited upside, limited loss (premium).
Seller of call: Limited profit (premium), unlimited loss if stock rises.

Divergence SecretsOption Greeks – The Science Behind Pricing
Options pricing is influenced by multiple factors. These sensitivities are known as the Greeks:
Delta – Measures how much option price changes with stock price.
Gamma – Rate of change of Delta.
Theta – Time decay (options lose value daily).
Vega – Sensitivity to volatility.
Rho – Sensitivity to interest rates.
Example: A call option with Delta = 0.6 means for every ₹10 rise in stock, option premium increases by ₹6.
Basic Option Strategies (Beginner Level)
Buying Calls – Bullish bet.
Buying Puts – Bearish bet.
Covered Call – Hold stock + sell call for extra income.
Protective Put – Own stock + buy put for downside insurance.

Futures Trading ExplainedIntroduction
Futures trading is one of the most powerful financial instruments in the world of investing and trading. Unlike traditional stock buying where you own a piece of a company, futures are derivative contracts that allow you to speculate on the price movement of commodities, currencies, indices, and financial assets without owning them directly.
The futures market plays a crucial role in global finance by providing price discovery, risk management (hedging), and speculative opportunities. From farmers locking in prices for crops to institutional traders speculating on crude oil, futures are everywhere in the financial ecosystem.
In this guide, we’ll explore futures trading in detail, covering everything from the basics to advanced strategies, with real-world examples.
1. What are Futures?
A futures contract is a legally binding agreement to buy or sell an underlying asset at a predetermined price at a specific time in the future.
Key points:
Underlying asset: The thing being traded (wheat, crude oil, gold, stock index, currency, etc.).
Standardized contract: The size, quality, and delivery date are pre-defined by the exchange.
Leverage: Traders can control large positions with small capital (margin).
Cash-settled or physical delivery: Some futures end with cash settlement, others with delivery of the actual asset.
For example:
A wheat farmer agrees to sell 1000 bushels of wheat at $7 per bushel for delivery in 3 months. The buyer agrees to purchase it. Regardless of where the price goes, both are bound to the contract terms.
2. History and Evolution of Futures
Futures are not new – they date back centuries.
Japan (1700s): The Dojima Rice Exchange in Osaka is considered the birthplace of futures. Rice merchants used contracts to stabilize income.
Chicago Board of Trade (1848): Modern futures trading started in the U.S. with grain contracts.
20th Century: Expansion into metals, livestock, and energy.
Late 20th to 21st Century: Financial futures (currencies, indices, interest rates) became dominant.
Today, futures are traded worldwide on major exchanges like CME (Chicago Mercantile Exchange), ICE (Intercontinental Exchange), and NSE (National Stock Exchange of India).
3. Futures vs. Other Instruments
To understand futures better, let’s compare them with other markets:
Futures vs. Stocks
Stocks = Ownership of a company.
Futures = Contract to trade an asset, no ownership.
Stocks are unleveraged by default; futures use leverage.
Futures vs. Options
Options = Right but not obligation.
Futures = Obligation for both buyer and seller.
Options limit risk (premium paid); futures have unlimited risk.
Futures vs. Forwards
Forwards = Customized, private contracts (OTC).
Futures = Standardized, exchange-traded, regulated.
4. How Futures Trading Works
Let’s break down the mechanics:
a) Contract Specifications
Every futures contract specifies:
Underlying asset (Gold, Nifty index, Crude oil, etc.)
Contract size (e.g., 100 barrels of oil)
Expiration date (e.g., March 2025 contract)
Tick size (minimum price movement)
Settlement type (cash/physical)
b) Margin and Leverage
Traders don’t pay full value; they post margin (a percentage, usually 5–15%).
Example: 1 crude oil futures contract = 100 barrels. If price = $80, contract value = $8,000. Margin required may be $800. You control $8,000 with just $800.
c) Mark-to-Market (MTM)
Futures are settled daily. Profits and losses are adjusted every day.
If your trade is in profit, money is credited; if in loss, debited.
d) Long and Short Positions
Long = Buy (expecting price rise).
Short = Sell (expecting price fall).
Unlike stocks, short selling in futures is easy because contracts don’t require ownership of the asset.
5. Participants in Futures Market
The market brings together different players:
Hedgers – Reduce risk.
Example: A farmer sells wheat futures to lock in price; an airline buys crude oil futures to hedge fuel cost.
Speculators – Profit from price movements.
Traders, investors, hedge funds.
They provide liquidity but assume higher risk.
Arbitrageurs – Exploit price differences.
Example: Buy in spot market and sell futures if mispricing exists.
6. Types of Futures Contracts
Futures are available across asset classes:
a) Commodity Futures
Agricultural: Wheat, corn, soybeans, coffee.
Energy: Crude oil, natural gas.
Metals: Gold, silver, copper.
b) Financial Futures
Index futures (Nifty, S&P 500).
Currency futures (USD/INR, EUR/USD).
Interest rate futures (10-year bond yields).
c) Other Emerging Futures
Volatility index futures (VIX).
Crypto futures (Bitcoin, Ethereum).
7. Futures Trading Strategies
Futures are flexible and allow many trading approaches:
a) Directional Trading
Going long if expecting price rise.
Going short if expecting price fall.
b) Hedging
Farmers hedge crop prices.
Exporters/importers hedge currency fluctuations.
Investors hedge stock portfolios with index futures.
c) Spread Trading
Buy one contract, sell another.
Example: Buy December crude oil futures, sell March crude oil futures (calendar spread).
d) Arbitrage
Exploiting mispricing between spot and futures.
Example: If Gold futures are overpriced compared to spot, arbitrageurs sell futures and buy spot.
e) Advanced Strategies
Pairs trading: Trade correlated futures.
Hedged positions: Combining futures with options.
8. Advantages of Futures Trading
High Leverage: Amplifies potential returns.
Liquidity: Major futures markets have deep liquidity.
Transparency: Regulated by exchanges.
Flexibility: Can trade both rising and falling markets.
Hedging tool: Reduces risk exposure.
9. Risks in Futures Trading
While powerful, futures are risky:
Leverage risk: Losses are amplified just like profits.
Volatility risk: Futures can swing widely.
Margin calls: If losses exceed margin, traders must add funds.
Liquidity risk: Some contracts may have low volume.
Unlimited losses: Unlike options, risk is not capped.
Example: If you short crude oil at $80 and it rises to $120, your losses are massive.
10. Practical Example of Futures Trade
Imagine you believe gold prices will rise.
Gold futures contract size: 100 grams.
Current price: ₹60,000 per 10 grams → Contract value = ₹600,000.
Margin requirement: 10% = ₹60,000.
You buy one contract at ₹60,000.
If gold rises to ₹61,000 → Profit = ₹1,000 × 10 = ₹10,000.
If gold falls to ₹59,000 → Loss = ₹10,000.
A small move in price leads to large gains or losses due to leverage.
Conclusion
Futures trading is a double-edged sword – a tool of immense power for hedging and speculation, but equally capable of wiping out capital if misused. Traders must understand contract mechanics, manage leverage wisely, and apply strict risk management.
For professionals and disciplined traders, futures offer unparalleled opportunities. For careless traders, they can be disastrous.
The bottom line:
Learn the basics thoroughly.
Start small with proper risk controls.
Treat futures trading as a skill to master, not a gamble.
If used smartly, futures trading can become a gateway to financial growth and protection against market uncertainty.
Part 3 Learn Institutional TradingOption Greeks – The Science Behind Pricing
Options pricing is influenced by multiple factors. These sensitivities are known as the Greeks:
Delta – Measures how much option price changes with stock price.
Gamma – Rate of change of Delta.
Theta – Time decay (options lose value daily).
Vega – Sensitivity to volatility.
Rho – Sensitivity to interest rates.
Example: A call option with Delta = 0.6 means for every ₹10 rise in stock, option premium increases by ₹6.
Basic Option Strategies (Beginner Level)
Buying Calls – Bullish bet.
Buying Puts – Bearish bet.
Covered Call – Hold stock + sell call for extra income.
Protective Put – Own stock + buy put for downside insurance.

Part 2 Ride The Big Moves Why Trade Options? (Advantages)
Leverage: Small capital controls big positions.
Hedging: Protect stock portfolio from losses.
Flexibility: Profit in bullish, bearish, or sideways markets.
Income: Selling options generates consistent premiums.
Risk Control: Losses can be predefined by structuring trades.
Risks of Options Trading
Time Decay (Theta): Options lose value as expiration approaches.
Liquidity Risk: Not all options are actively traded.
Complexity: Strategies can be difficult for beginners.
Unlimited Risk (for sellers): Selling naked calls can wipe out capital.
Over-leverage: Small margin requirements may encourage oversized positions.

Global Events & Market ImpactIntroduction
Financial markets are like living organisms—sensitive, reactive, and constantly adapting to external influences. While company fundamentals, earnings, and investor psychology play a large role in stock price movements, global events often serve as the real catalysts for dramatic market swings.
A political decision in Washington, a sudden military conflict in the Middle East, a central bank announcement in Europe, or even a natural disaster in Asia can ripple across global financial markets within minutes. In today’s hyper-connected economy, where capital flows across borders instantly and news spreads in real time, no country or investor is fully insulated from worldwide developments.
This article explores in detail how different global events—ranging from geopolitical tensions, pandemics, and trade wars to central bank policies, technological revolutions, and climate change—affect financial markets. We’ll also study both short-term volatility and long-term structural shifts that such events trigger.
1. The Nature of Market Sensitivity to Global Events
Markets are essentially forward-looking. They do not simply react to present conditions but rather try to price in future risks and opportunities. This is why even rumors of a war, speculation about interest rate changes, or forecasts of a hurricane can cause markets to swing before the actual event occurs.
Three key characteristics define market responses to global events:
Speed – In the era of high-frequency trading and global media, reactions can happen within seconds.
Magnitude – The scale of reaction depends on how “systemic” the event is (for example, the 2008 financial crisis vs. a localized earthquake).
Duration – Some events cause short-term panic but markets recover quickly; others reshape the global economy for decades.
2. Categories of Global Events Affecting Markets
Global events can be broadly classified into several categories, each with distinct market impacts:
Geopolitical Events – wars, terrorism, political instability, sanctions, and diplomatic conflicts.
Economic Policies & Central Bank Decisions – interest rate changes, fiscal stimulus, tax reforms.
Global Trade & Supply Chain Disruptions – tariffs, trade wars, port blockages, shipping crises.
Natural Disasters & Climate Change – hurricanes, floods, wildfires, long-term climate risks.
Health Crises & Pandemics – global spread of diseases like COVID-19, SARS, Ebola.
Technological Disruptions – breakthroughs in AI, energy, and digital finance.
Commodity Shocks – sudden movements in oil, gold, or food prices.
Financial Crises & Systemic Shocks – banking collapses, currency devaluations, debt crises.
Let’s examine each in detail.
3. Geopolitical Events
Wars and Conflicts
Wars often cause energy and commodity prices to spike, especially when they involve major producers.
Example: The Russia-Ukraine war (2022) sent oil, gas, and wheat prices soaring, creating inflationary pressures worldwide.
Defense stocks usually rally, while riskier assets like emerging markets decline.
Political Instability
Elections, regime changes, and coups often create uncertainty.
Example: Brexit (2016) caused volatility in the pound sterling, reshaped European equity flows, and influenced global trade policy.
Terrorism
Major attacks (e.g., 9/11) often trigger immediate sell-offs in equity markets, with a flight to safe-haven assets like gold and US Treasury bonds.
4. Economic Policies & Central Banks
Interest Rate Decisions
Central banks like the US Federal Reserve, European Central Bank (ECB), and RBI (India) are powerful drivers of markets.
When rates rise, borrowing becomes expensive, which usually depresses stock markets but strengthens the currency.
Conversely, rate cuts often boost equities but weaken currencies.
Quantitative Easing (QE)
During crises (2008, COVID-19), central banks injected liquidity into markets, which drove asset prices upward.
Fiscal Stimulus & Taxation
Government spending plans, subsidies, or corporate tax cuts influence corporate earnings expectations and therefore stock valuations.
5. Global Trade & Supply Chains
Trade Wars
Example: The US-China trade war (2018–2019) disrupted global technology and manufacturing supply chains, causing volatility in stock markets and commodity markets.
Supply Chain Disruptions
COVID lockdowns in China created shortages in semiconductors and other goods, which impacted global auto and electronics industries.
Shipping & Logistics
Events like the Suez Canal blockage (2021) caused billions in losses and exposed how dependent markets are on smooth global logistics.
6. Natural Disasters & Climate Change
Natural Disasters
Hurricanes, tsunamis, or earthquakes often create localized stock market declines.
Example: The 2011 Japan earthquake & Fukushima nuclear disaster had global impacts on energy and auto supply chains.
Climate Change
Increasingly, investors are pricing climate risk into valuations.
Companies in fossil fuel industries face long-term risks, while renewable energy firms attract capital.
ESG (Environmental, Social, Governance) investing has emerged as a global trend.
7. Health Crises & Pandemics
COVID-19 (2020–2022)
One of the most impactful global events in modern history.
Stock markets initially crashed in March 2020 but rebounded sharply due to massive fiscal and monetary support.
Certain sectors like airlines, hotels, and oil were devastated, while tech and healthcare boomed.
Past Examples
SARS (2003) hit Asian markets temporarily.
Ebola (2014) affected African economies but had limited global effect compared to COVID.
8. Technological Disruptions
Innovations Driving Markets
The dot-com bubble (1999–2000) showed how technology hype can inflate markets.
More recently, AI and EV (Electric Vehicles) have created massive rallies in companies like Nvidia and Tesla.
Risks from Technology
Cyberattacks on financial institutions or major corporations can cause sudden market dips.
Example: Ransomware attacks or hacking of exchanges.
9. Commodity Shocks
Oil Price Volatility
Oil remains one of the most geopolitically sensitive commodities.
Example: The 1973 oil crisis caused stagflation globally.
In 2020, oil futures briefly turned negative due to demand collapse.
Gold as a Safe Haven
During uncertainty, gold prices usually rise.
Investors view it as a hedge against inflation, currency depreciation, and geopolitical risks.
Food Commodities
Droughts or export bans (e.g., India restricting rice exports) can push global food inflation higher.
10. Financial Crises & Systemic Shocks
Global Financial Crisis (2008)
Triggered by the collapse of Lehman Brothers, this event led to the worst global recession since the Great Depression.
Stock markets fell over 50%, but also created long-term changes in regulation and central bank behavior.
Asian Financial Crisis (1997)
Currency devaluations in Thailand, Indonesia, and South Korea triggered capital flight and market crashes.
European Debt Crisis (2010–2012)
Greece’s sovereign debt problems shook confidence in the Eurozone and created long-term structural reforms.
Conclusion
Global events are unavoidable in financial markets. While some are unpredictable “black swan” shocks, others evolve slowly, giving investors time to adjust. Understanding how markets react to wars, pandemics, central bank decisions, and technological disruptions can help investors navigate uncertainty more effectively.
In the short term, markets may appear chaotic. But history shows that crises often accelerate long-term transformations in economies and industries. The winners are those who maintain discipline, manage risk, and adapt strategies as global dynamics shift.

Types of Financial MarketsIntroduction
Finance is the backbone of any economy, and at the center of this financial ecosystem lie the financial markets. These markets serve as platforms where buyers and sellers engage in the exchange of financial instruments such as stocks, bonds, currencies, derivatives, and commodities. They enable efficient capital allocation, liquidity creation, and wealth distribution in an economy.
Understanding financial markets is crucial for investors, traders, policy makers, and even the general public because these markets influence everything from government policies to personal investment decisions.
Broadly, financial markets can be categorized into several types based on the instruments traded, the maturity of securities, the nature of participants, and the purpose they serve.
In this article, we will explore:
The functions of financial markets
Major types of financial markets
Examples and their relevance in the real economy
Advantages and challenges of each type
How they interconnect to form the global financial system
Functions of Financial Markets
Before diving into the types, let’s understand why financial markets exist and what purpose they serve:
Capital Formation: They channel funds from savers (households, institutions) to borrowers (businesses, governments).
Liquidity: They provide an avenue to convert financial instruments into cash quickly.
Price Discovery: Markets determine the fair value of financial instruments through demand and supply forces.
Risk Management: Through derivatives and insurance-like instruments, investors can hedge against risks.
Efficient Allocation of Resources: Funds flow toward businesses and projects with the most promising prospects.
Economic Growth: They support industrial expansion, innovation, and employment by financing new ventures.
Broad Classification of Financial Markets
Financial markets can be broadly divided into two categories:
Money Market – Deals with short-term funds (less than one year).
Capital Market – Deals with long-term funds (more than one year).
From here, multiple subcategories exist, including stock markets, bond markets, forex markets, derivatives markets, and commodity markets.
1. Money Market
The money market is where short-term borrowing and lending take place, usually for periods of less than one year. It is essential for maintaining liquidity in the financial system.
Instruments in the Money Market
Treasury Bills (T-Bills): Issued by the government to raise short-term funds. They are risk-free and highly liquid.
Commercial Papers (CPs): Short-term unsecured promissory notes issued by corporations.
Certificates of Deposit (CDs): Issued by banks, offering fixed returns over short maturities.
Repurchase Agreements (Repos): Short-term loans where securities are sold with an agreement to repurchase later.
Call Money Market: Interbank lending for very short durations (even overnight).
Importance
Provides liquidity to banks and institutions.
Helps governments manage short-term funding needs.
Facilitates monetary policy operations by central banks.
2. Capital Market
The capital market deals with medium to long-term financing. It is divided into primary markets (new securities issued) and secondary markets (trading of existing securities).
A. Primary Market
Companies issue Initial Public Offerings (IPOs) to raise funds.
Governments issue bonds for infrastructure or development projects.
Investors provide funds directly to businesses.
B. Secondary Market
Existing securities (stocks, bonds) are traded among investors.
Provides liquidity and exit opportunities for investors.
Examples: NSE, BSE, NYSE, NASDAQ, LSE.
Functions
Mobilizes savings into investments.
Provides companies with access to long-term funding.
Encourages corporate growth and expansion.
3. Stock Market (Equity Market)
The stock market is perhaps the most well-known type of financial market. It deals with the buying and selling of company shares.
Types
Primary Stock Market: Where companies issue new shares (IPOs, FPOs).
Secondary Stock Market: Where existing shares are traded.
Key Global Stock Exchanges
New York Stock Exchange (NYSE) – USA
NASDAQ – USA
London Stock Exchange (LSE) – UK
Bombay Stock Exchange (BSE) – India
National Stock Exchange (NSE) – India
Tokyo Stock Exchange (TSE) – Japan
Importance
Helps companies raise equity capital.
Provides investors with wealth creation opportunities.
Reflects economic conditions of a country.
4. Bond Market (Debt Market)
The bond market (or debt market) is where governments, corporations, and institutions issue debt securities to raise capital.
Types of Bonds
Government Bonds (Sovereign Bonds): Risk-free, issued to fund government expenditure.
Corporate Bonds: Issued by companies for long-term financing.
Municipal Bonds: Issued by local governments for projects like schools or infrastructure.
Convertible Bonds: Can be converted into equity at a later date.
Role
Provides predictable returns to investors.
Allows governments to finance fiscal deficits.
Offers diversification to investors who seek lower risk than equities.
5. Derivatives Market
The derivatives market deals with financial contracts whose value is derived from underlying assets such as stocks, bonds, commodities, or currencies.
Types of Derivatives
Futures Contracts: Agreement to buy/sell at a future date at a predetermined price.
Options Contracts: Right, but not obligation, to buy/sell at a specific price.
Swaps: Exchange of cash flows (e.g., interest rate swaps, currency swaps).
Forwards: Customized contracts between two parties.
Importance
Helps manage risk (hedging).
Provides leverage opportunities for traders.
Facilitates price discovery.
6. Foreign Exchange (Forex) Market
The Forex market is the world’s largest financial market, where currencies are traded.
Key Features
Decentralized, operates 24/7 globally.
Daily turnover exceeds $7 trillion (2025 estimate).
Major currency pairs: EUR/USD, GBP/USD, USD/JPY, USD/INR.
Participants
Central banks
Commercial banks
Corporations
Hedge funds
Retail traders
Importance
Facilitates global trade and investment.
Provides a mechanism for hedging currency risks.
Enables speculation on exchange rate movements.
7. Commodity Market
The commodity market deals with raw materials and primary products such as gold, silver, oil, natural gas, agricultural products, and metals.
Types
Hard Commodities: Metals, oil, natural resources.
Soft Commodities: Agricultural products like coffee, wheat, sugar.
Examples of Commodity Exchanges
MCX (Multi Commodity Exchange) – India
NCDEX (National Commodity & Derivatives Exchange) – India
CME (Chicago Mercantile Exchange) – USA
LME (London Metal Exchange) – UK
Importance
Enables producers and consumers to hedge against price fluctuations.
Provides opportunities for traders and investors.
Plays a vital role in inflation and cost-of-living measures.
8. Insurance Market
The insurance market is a specialized financial market that provides risk protection.
Individuals and businesses pay premiums to insurance companies.
Insurers pool risks and pay claims in case of insured events.
Examples: Life insurance, health insurance, property insurance, reinsurance.
9. Mortgage Market
This market deals with loans secured by real estate (housing or commercial properties).
Primary Mortgage Market: Direct lending between banks and borrowers.
Secondary Mortgage Market: Mortgages are bundled and sold as securities (Mortgage-Backed Securities – MBS).
The 2008 Global Financial Crisis highlighted the risks in this market when mortgage-backed securities collapsed.
10. Cryptocurrency Market
A relatively new market, cryptocurrencies operate on blockchain technology.
Examples
Bitcoin (BTC)
Ethereum (ETH)
Ripple (XRP)
Solana (SOL)
Features
Decentralized and borderless.
Volatile but offers high returns.
Increasingly gaining mainstream adoption.
Conclusion
Financial markets are the lifeline of modern economies. They are diverse, ranging from traditional stock and bond markets to emerging cryptocurrency and derivative markets. Each type serves a unique function – from providing short-term liquidity to enabling long-term capital formation, risk management, and global trade facilitation.
For individuals, understanding these markets opens up opportunities for wealth creation, portfolio diversification, and financial security. For nations, well-functioning financial markets are critical to sustaining growth, innovation, and stability.
As economies evolve with digital technologies and globalization, financial markets will continue to expand and innovate, offering both opportunities and challenges.

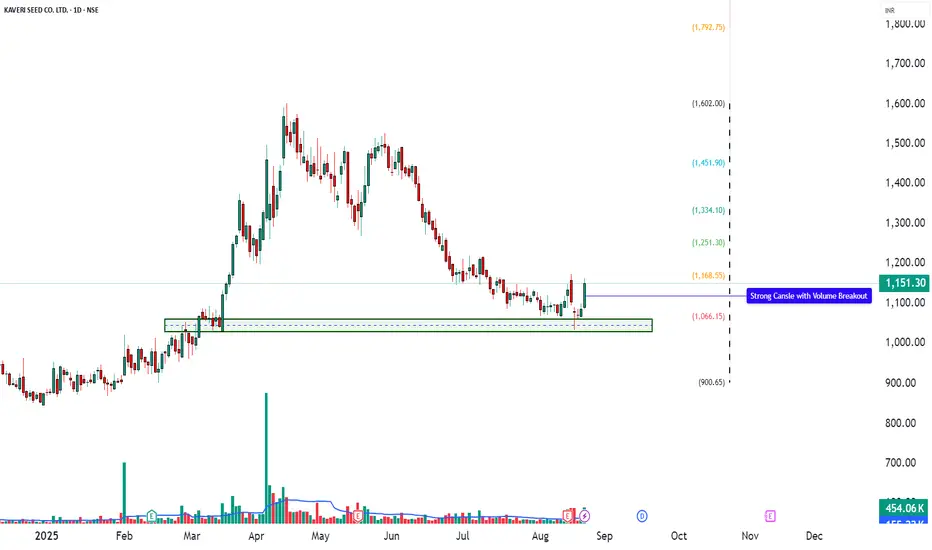
KSCL – Technical & Educational Snapshot📊 KSCL – Technical & Educational Snapshot
Ticker: NSE: KSCL | Sector: 🌱 Seeds & Agro
CMP: ₹1,151.30 ▲ (as of 21 Aug 2025)
Rating (for learning purpose): ⭐⭐⭐⭐
Pattern Observed: 📉 Double Top + Descending Wedge (target near ₹1,000 completed)
KSCL earlier formed a Double Top followed by a Descending Wedge breakdown, with the projected bearish reference zone being successfully achieved. With that completion, the stock has now entered a new phase, displaying fresh bullish momentum. A strong bullish candle, RSI breakout, and Bollinger Band expansion from a squeeze highlight renewed buying strength.
This technical shift points towards a possible trend reversal or at least a medium-term bounce, provided the price sustains above key resistance levels. Supporting indicators (MACD, CCI, Stochastic) are aligned in favor of momentum continuation, adding weight to the bullish case.
📊 Momentum Snapshot:
Momentum indicators are tilting to the bullish side. While Stochastic (84) is moderately elevated, the confluence of RSI breakout, MACD bullish crossover, and strong CCI indicates that momentum could sustain until higher resistance levels are tested.
📊 Volume Check
🔹 Current Volume: 454.06K
🔹 20 SMA Volume: 155.22K ✅
💥 Nearly 3x average volume – confirms strong institutional / broad-based buying interest!
💡 Interpretation:
When volume is well above the 20-period average, it strengthens the reliability of a breakout.
This shows the move is not just retail-driven but likely backed by larger participants.
High-volume breakouts tend to sustain better compared to low-volume moves.
💡 Learnings:
Breakouts emerging from a Bollinger Band Squeeze often lead to strong trending moves as volatility expands. When supported by confirmations such as RSI and MACD turning positive together, the reliability of the breakout improves significantly.
Elevated CCI values reflect strong buying momentum, though traders should remain mindful of possible pullbacks. Above all, defining clear stop-loss and invalidation levels ensures disciplined trade management.
📌 Fresh bullish signals are emerging → but confirmation only comes on sustained move above ₹1,180–1,209. Failure to hold above ₹1,100 may keep it in sideways consolidation or trigger further downward pressure.
🔑 Key Levels
Resistance: 1180 | 1209 | 1256
Support: 1104 | 1057 | 1028
Fibonacci Levels: 900.65 | 1066.15 | 1168.55 | 1251.30 | 1334.10 | 1451.90 | 1602
Pullback Level: Around 1104–1110 zone (first support & prior base)
Invalidation Level: Close below 1057 (would negate the bullish setup)
📝 STWP Trade Setup
📌 Entry (Long): Above 1,162
🛡 Stop Loss: 1,059 or below
🎯 Reference Levels: 1264 | 1366
⚠️ Disclaimer – Please Read Carefully
The information shared here is meant purely for learning and awareness. It is not a buy or sell recommendation and should not be taken as investment advice. I am not a SEBI-registered investment advisor, and all views expressed are based on personal study, chart patterns, and publicly available market data.
Trading — whether in stocks or options — carries risk. Markets can move unexpectedly, and losses can sometimes exceed the money you have invested. Past performance or past setups do not guarantee future results.
If you are a beginner, treat this as a guide to understand how the market works — practice on paper trades before risking real money. If you are experienced, always assess your own risk, position sizing, and strategy suitability before entering trades.
Consult a SEBI-registered financial advisor before making any real trading decision. By engaging with this content, you acknowledge full responsibility for your trades and investments.
💬 Found this useful?
🔼 Give this post a Boost to help more traders discover clean, structured learning.
✍️ Drop your thoughts, questions, or setups in the comments — let’s grow together!
🔁 Share with fellow traders and beginners to spread awareness.
✅ Follow simpletradewithpatience for beginner-friendly setups, price action insights & disciplined trading content.
🚀 Stay Calm. Stay Clean. Trade With Patience.
Trade Smart | Learn Zones | Be Self-Reliant 📊
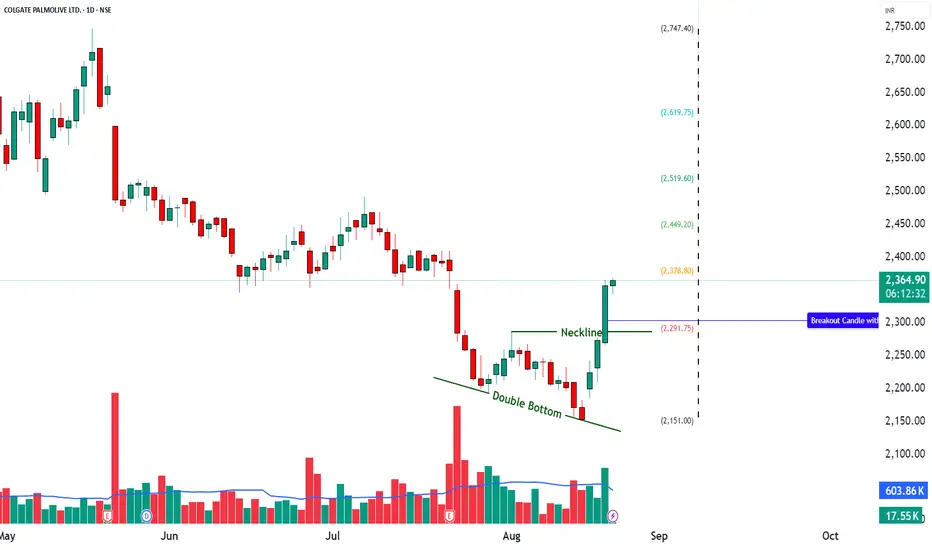
COLPAL - RSI Breakout + Bollinger Band Breakout📊 COLPAL – Technical & Educational Snapshot
Ticker: NSE: COLPAL | Sector: 🪥 FMCG
CMP: ₹ ▲ (as of 20 Aug 2025)
Rating (for learning purpose): ⭐⭐⭐⭐
Pattern Observed: 📈 RSI Breakout + Bollinger Band Breakout
COLPAL is showing strong bullish momentum supported by multiple technical indicators. The presence of a strong bullish candle, along with an RSI breakout at 61, highlights healthy buying pressure. A Bollinger Band breakout and BB Squeeze-Off indicate rising volatility and the possibility of a continuation move. The Bullish SuperTrend adds further confirmation, while momentum indicators (MACD bullish, CCI at 223, Stochastic at 96) signal strong near-term strength.
📊 Momentum Snapshot: Momentum indicators are aligned on the bullish side. While Stochastic shows overbought conditions, strong volume-backed momentum often sustains until key resistance levels are tested.
📊 Volume Check:
🔹 Current Volume: 1.01M
🔹 20SMA Volume: 710.56k ✅
💥 Significantly above average – confirms strong institutional / broad-based buying interest!
💡 Interpretation:
When volume is well above the 20-period average, it strengthens the reliability of a breakout.
It shows that the move is not just retail-driven but likely supported by larger participants.
Breakouts with high volume tend to sustain better compared to low-volume moves.
💡 Learnings:
Breakouts with Bollinger Band expansion often lead to strong follow-through moves.
RSI + MACD confirmation together strengthen trend reliability.
High CCI & Stochastic values show strong momentum but also highlight the importance of monitoring for pullbacks.
Defining pullback and invalidation levels helps in disciplined trade management.
Key Levels:
Resistance: 2393 | 2429 | 2492
Support: 2293 | 2229 | 2193
Pullback Area: 2294
Invalidation Level: Close below 2193
STWP Trade Setup:
Entry (Long): Above 2365
Stop Loss: 2262 or below
Reference Levels: 2467 | 2569
⚠️ Disclaimer – Please Read Carefully
The information shared here is meant purely for learning and awareness. It is not a buy or sell recommendation and should not be taken as investment advice. I am not a SEBI-registered investment advisor, and all views expressed are based on personal study, chart patterns, and publicly available market data.
Trading — whether in stocks or options — carries risk. Markets can move unexpectedly, and losses can sometimes be larger than the money you have invested. Past performance or past setups do not guarantee future results.
If you are a beginner, treat this as a guide to understand how the market works — practice on paper trades before risking real money. If you are an experienced trader, remember to assess your own risk, position sizing, and strategy suitability before entering any trade.
Consult a SEBI-registered financial advisor before making any real trading decision.
By reading, watching, or engaging with this content, you acknowledge that you take full responsibility for your own trades and investments.
💬 Found this useful?
🔼 Give this post a Boost to help more traders discover clean, structured learning.
✍️ Drop your thoughts, questions, or setups in the comments — let’s grow together!
🔁 Share with fellow traders and beginners to spread awareness.
✅ Follow simpletradewithpatience for beginner-friendly setups, price action insights & disciplined trading content.
🚀 Stay Calm. Stay Clean. Trade With Patience.
Trade Smart | Learn Zones | Be Self-Reliant 📊
PERSISTENT – Bullish Engulfing + RSI Breakout📊 PERSISTENT – Technical & Educational Snapshot
Ticker: NSE: PERSISTENT | Sector: 💻 IT Services
CMP: ₹ ▲ (as of 20 Aug 2025)
Rating (for learning purpose): ⭐⭐⭐⭐
Pattern Observed: 📈 Bullish Engulfing + RSI Breakout
PERSISTENT is displaying strong bullish momentum across multiple technical indicators. The presence of a strong bullish candle with Open = Low, combined with an RSI breakout, highlights aggressive buying pressure. A Bullish Engulfing pattern further supports the continuation bias. Meanwhile, the Bollinger Band Squeeze-Off suggests increased volatility with a likely breakout on the upside. Together with a volume-supported move, these signals indicate strength in the trend.
📊 Volume Check:
🔹 Current Volume: 628.85k
🔹 20SMA Volume: 604.21k ✅
💥 Above average – confirming genuine buying interest!
💡 Learnings:
Bullish engulfing + Open=Low candles often signal strong buyer dominance.
RSI breakouts are stronger when paired with above-average volumes.
Bollinger Band squeeze-offs frequently precede powerful directional moves.
Defining pullback areas and invalidation levels helps structure risk management.
Key Levels:
Resistance: 5410 | 5475 | 5580
Support: 5240 | 5135 | 5070
Pullback Level: 5284
Invalidation Level: Close below 5008
STWP Trade Setup:
Entry (Long): Above 5370
Stop Loss: 5173 or below
Reference Levels: 5566 | 5763
⚠️ Disclaimer – Please Read Carefully
The information shared here is meant purely for learning and awareness. It is not a buy or sell recommendation and should not be taken as investment advice. I am not a SEBI-registered investment advisor, and all views expressed are based on personal study, chart patterns, and publicly available market data.
Trading — whether in stocks or options — carries risk. Markets can move unexpectedly, and losses can sometimes be larger than the money you have invested. Past performance or past setups do not guarantee future results.
If you are a beginner, treat this as a guide to understand how the market works — practice on paper trades before risking real money. If you are an experienced trader, remember to assess your own risk, position sizing, and strategy suitability before entering any trade.
Consult a SEBI-registered financial advisor before making any real trading decision.
By reading, watching, or engaging with this content, you acknowledge that you take full responsibility for your own trades and investments.
💬 Found this useful?
🔼 Give this post a Boost to help more traders discover clean, structured learning.
✍️ Drop your thoughts, questions, or setups in the comments — let’s grow together!
🔁 Share with fellow traders and beginners to spread awareness.
✅ Follow simpletradewithpatience for beginner-friendly setups, price action insights & disciplined trading content.
🚀 Stay Calm. Stay Clean. Trade With Patience.
Trade Smart | Learn Zones | Be Self-Reliant 📊

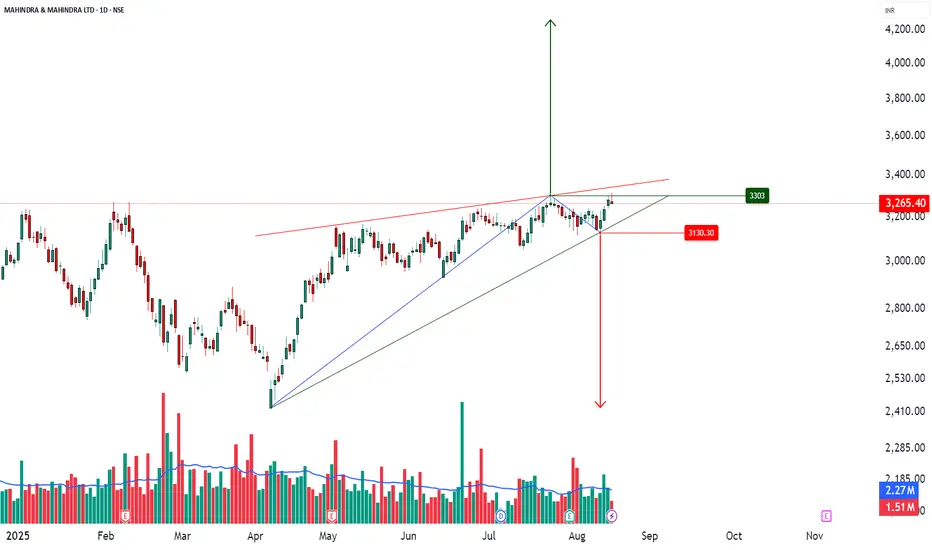
M&M _ Rising Wedge Formation📊 M&M – Technical & Educational Snapshot
Ticker: NSE: M&M | Sector: 🚙 Auto
CMP: ₹2,7XX (as of 16 Aug 2025)
Rating (for learning purpose): ⭐⭐⭐⭐
Pattern Observed: 📉 Rising Wedge Formation (Bearish Reversal Case Study)
🔑 Key Reference Levels (For Learning)
Support / Breakdown Zone: Lower wedge trendline
Resistance / Rejection Zone: Upper wedge trendline
Bearish Projection (Case Study): ~₹2,410
Bullish Continuation (Alternative View): ~₹3,300
📌 Pattern Observations
✅ Price forming higher highs & higher lows but within converging trendlines
✅ Momentum slowing → smaller swings inside wedge
✅ Typical bearish reversal structure (confirmation needed)
✅ Volume + RSI divergence can add conviction
📝 STWP Trade Analysis (Educational Illustration Only)
1️⃣ Bearish Breakdown (Primary Scenario)
Observation: Breakdown below wedge support often studied as bearish signal
Stop Loss (Learning Reference): Above upper wedge / recent swing high
Downside potential: ₹2,410 (measured move projection)
2️⃣ Bullish Breakout (Alternative Scenario)
Observation: Breakout above wedge resistance may lead to continuation
Stop Loss (Learning Reference): Below wedge / recent swing low
Upside potential: ₹3,300
📊 Risk Management & Confirmation
Traders typically wait for daily close outside wedge boundaries
Volume confirmation is key → spikes above average strengthen the move
RSI divergence often adds confidence to the setup
📌 Summary (Learning View Only)
The M&M Rising Wedge is a classic reversal study.
Key lesson: A wedge pattern teaches how slowing momentum can shift market control — but confirmation with volume + price close is essential before validating either direction.
⚠️ Disclaimer – Please Read Carefully
The information shared here is meant purely for learning and awareness. It is not a buy or sell recommendation and should not be taken as investment advice. I am not a SEBI-registered investment advisor, and all views expressed are based on personal study, chart patterns, and publicly available market data.
Trading — whether in stocks or options — carries risk. Markets can move unexpectedly, and losses can sometimes be larger than the money you have invested. Past performance or past setups do not guarantee future results.
If you are a beginner, treat this as a guide to understand how the market works — practice on paper trades before risking real money. If you are an experienced trader, remember to assess your own risk, position sizing, and strategy suitability before entering any trade.
Consult a SEBI-registered financial advisor before making any real trading decision.
By reading, watching, or engaging with this content, you acknowledge that you take full responsibility for your own trades and investments.
________________________________________
💬 Found this useful?
🔼 Give this post a Boost to help more traders discover clean, structured learning.
✍️ Drop your thoughts, questions, or setups in the comments — let’s grow together!
🔁 Share with fellow traders and beginners to spread awareness.
✅ Follow simpletradewithpatience for beginner-friendly setups, price action insights & disciplined trading content.
🚀 Stay Calm. Stay Clean. Trade With Patience.
Trade Smart | Learn Zones | Be Self-Reliant 📊
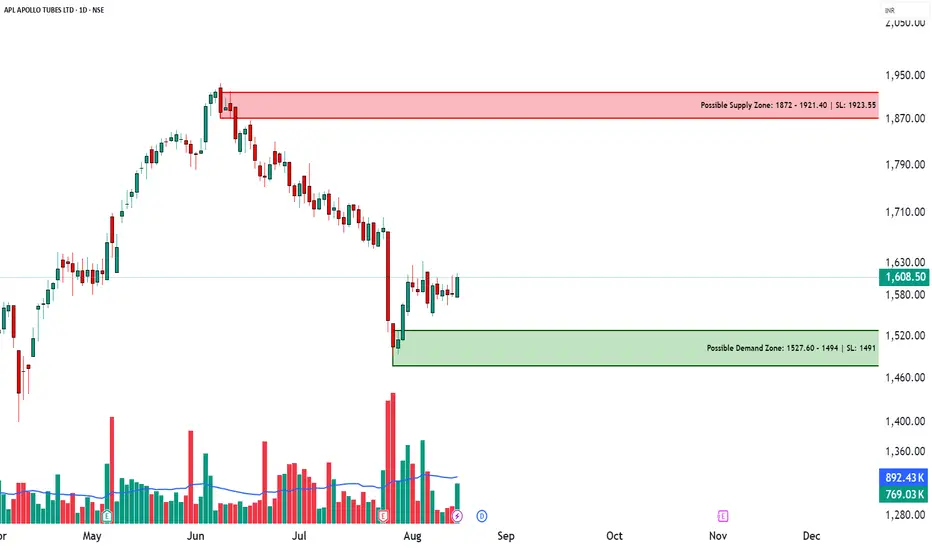
APLAPOLLO – Technical & Educational Snapshot📊 APLAPOLLO – Technical & Educational Snapshot
Timeframe: Daily / Weekly / Monthly
Overall Bias (for learning): ⭐⭐⭐⭐ Moderately Bullish – supply & demand zones identified, breakout study in progress
🔹 Candlestick Observations
Daily Bullish Piercing → Bullish Engulfing Buyers showing short-term strength
Weekly Three Black Crows → Bullish Engulfing Bearish pressure absorbed; case study of reversal attempt
Monthly NA No clear signal on higher timeframe
🔹 Supply & Demand Zones (Learning Reference)
Supply Zone (Resistance area): ₹1872 – ₹1921.40
(Stop Loss Ref: 1923.95 → possible invalidation if breached)
Demand Zone (Support area): ₹1494 – ₹1527.60
(Stop Loss Ref: 1491 → possible invalidation if broken)
🔹 Technical Observations
✅ Strong bullish candles forming
✅ Bullish Engulfing → buyer dominance visible
✅ Open = Low → intraday bullish bias illustration
✅ Double Wick → rejection from lower levels
✅ Breakout probability higher if weekly channel is cleared
📊 Volume Study
Any breakout is more reliable when supported by higher-than-average volume.
Traders typically wait for volume confirmation alongside bullish candlestick follow-through before validating a breakout.
📌 Summary (Learning View Only)
APLAPOLLO is a useful case study in demand-supply dynamics and bullish engulfing setups.
Lesson: Breakouts above consolidation + volume confirmation often strengthen trend continuation.
⚠️ Disclaimer (SEBI-Compliant)
This post is for educational & informational purposes only. It is not a buy/sell recommendation, not research, and not investment advice.
I am not a SEBI-registered advisor. Examples are for learning through chart patterns and public market data. Please consult a SEBI-registered financial advisor before making investment decisions.
💬 Found this useful?
🔼 Tap Boost so more traders can learn from structured analysis.
✍️ Share your views in the comments — let’s grow together.
✅ Follow @simpletradewithpatience for clean, zone-based setups & beginner-friendly market education.
🚀 Stay Calm. Stay Clean. Trade With Patience.
Trade Smart | Learn Zones | Be Self-Reliant 📊