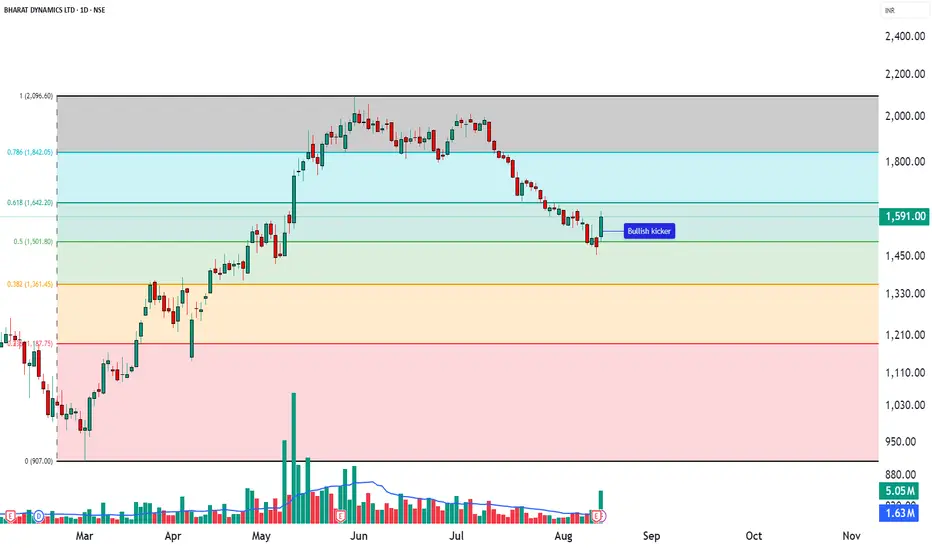
BDL - “Bullish Kicker Candlestick – Educational Analysis” ________________________________________
📊BDL – Technical & Fundamental Educational Snapshot
Ticker: NSE: BDL | Sector: 🏭 Defence & Aerospace
CMP: ₹1,591 ▲ (as of 13 Aug 2025)
Rating: ⭐⭐⭐⭐ (Moderately Bullish Setup – Educational Purposes Only)
Pattern Observed: 📈 Bullish Kicker Candlestick Pattern
________________________________________
Bullish Kicker Candlestick – Educational Analysis (BDL, NSE)
The Bullish Kicker is a strong reversal candlestick pattern, signaling a sudden shift from bearish to bullish sentiment. Studying this pattern helps traders understand price action and momentum dynamics.
________________________________________
Key Features:
Gap up from previous candle → sudden change in market sentiment.
No overlap between candle bodies → shows aggressive bullish control.
Bears initially in control, but strong buying pushed the price higher.
________________________________________
💡 Volume Confirmation
Kicker candle volume: 5.05M, compared to 20-day average of 1.63M.
Higher-than-average volume indicates strong participation and validates momentum from an educational perspective.
________________________________________
Support & Resistance Zones
📈Support Zones: 1525, 1460, 1417
📉 Resistance Zones: 1633, 1676, 1741
Patterns near strong support or after a downtrend are typically more reliable for educational analysis.
________________________________________
🔍 Indicator Insights
RSI: 42 – recovering from oversold levels.
VWAP: Bullish – indicates intraday support and momentum.
These indicators provide additional context for studying the pattern, not for direct trading decisions.
________________________________________
⚖️ Trade Planning Concepts (Educational Only)
Entry Concept: Observe the close of the kicker candle, or wait for the next candle to break above its high.
Stop Loss Concept: Slightly below the low of the kicker candle (~1502).
Reference Levels: Nearby resistance zones (1633, 1676, 1741) or risk-reward frameworks.
________________________________________
💡 Risk Management Concepts
Limit risk per study trade (e.g., 1–2% of capital).
Patterns may fail if subsequent price action invalidates the momentum.
________________________________________
Note: Bullish Kickers often follow impactful news or earnings. Observing volume and confirmation indicators is essential to understand price action dynamics.
________________________________________
⚠️ Disclaimer – Please Read Carefully
The information shared here is meant purely for learning and awareness. It is not a buy or sell recommendation and should not be taken as investment advice. I am not a SEBI-registered investment advisor, and all views expressed are based on personal study, chart patterns, and publicly available market data.
Trading — whether in stocks or options — carries risk. Markets can move unexpectedly, and losses can sometimes be larger than the money you have invested. Past performance or past setups do not guarantee future results.
If you are a beginner, treat this as a guide to understand how the market works — practice on paper trades before risking real money. If you are an experienced trader, remember to assess your own risk, position sizing, and strategy suitability before entering any trade.
Data, prices, and analysis are based on information available as of 12 August 2025, and market conditions can change at any time. Always verify with reliable sources and consult a SEBI-registered financial advisor before making any real trading decision.
By reading, watching, or engaging with this content, you acknowledge that you take full responsibility for your own trades and investments.
________________________________________
💬 Found this useful?
Drop your thoughts, questions, or setups in the comments — let’s grow together!
🔁 Share this post with fellow traders and beginners to spread clean, structure-based learning.
✅ Follow simpletradewithpatience for beginner-friendly setups, price action insights, and disciplined trading content.
🚀 Stay Calm. Stay Clean. Trade With Patience.
Trade Smart | Learn Zones | Be Self-Reliant 📊
________________________________________
Learntotrade
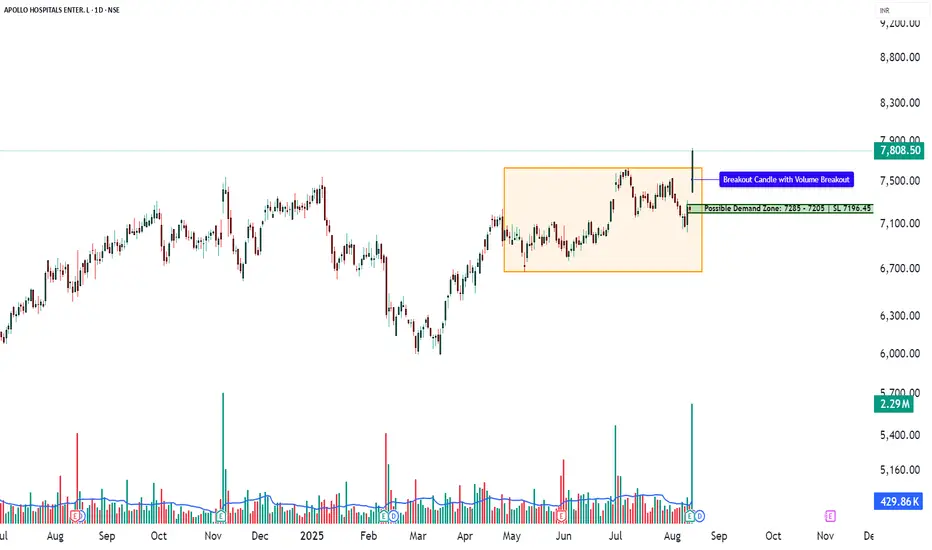
APOLLOHOSP – Ranging Channel Breakout Case Study (Educational)________________________________________
📊 APOLLOHOSP – Technical & Fundamental Educational Snapshot
Ticker: NSE: APOLLOHOSP | Sector: 🏥 Hospitals & Healthcare Services
CMP: ₹7,808.50 ▲ (as of 13 Aug 2025)
Rating: ⭐⭐⭐⭐☆ (Moderately Bullish Setup – Educational Purposes Only)
Pattern Observed: 📈 Ranging Channel Breakout
________________________________________
“Apollo Hospitals is on fire! After reporting a stunning 42% rise in Q1 net profit, the stock zoomed nearly 8%, now hovering near its 52-week high. Technical charts are flashing a powerful ‘Strong Buy’ signal across multiple indicators—momentum is undeniable. With balanced options interest and analyst targets pegged around ₹8,100, the stock may still have room to run. A breakout past ₹7,800 could set the stage for the next leg higher!”
________________________________________
Chart Pattern & Technical Analysis:
Close: ₹7,808.5 — strong bullish momentum after Ranging Channel breakout.
Candle: Big bullish bar with multiple confirmations — 52-week breakout, RSI breakout, MACD crossover, Bollinger Band breakout, bullish SuperTrend.
Momentum: WVAP bullish; RSI 68, MACD Buy, CCI 235, Stochastic 96.
________________________________________
Volume Analysis:
Volume: 2.29M shares traded — 5× the 20-day average (429.86K).
Signal: Exceptional participation confirming a decisive 20-day volume breakout.
________________________________________
Support & Resistance:
Resistance: ₹7,969, ₹8,130, ₹8,420.
Support: ₹7,518, ₹7,228, ₹7,060.7.
Outlook: Possible breakout opportunity with swing trade potential.
________________________________________
Learnings:
Q1 FY26 Results: PAT ↑ ~42% YoY to ₹433 cr; revenue ↑ ~15% YoY to ₹5,842 cr; stock rallied 5–6% post-results.
AI Focus: Plans to double AI investments in 2–3 years to boost efficiency & patient outcomes.
Value Unlocking: Spin-off & listing of digital health & pharmacy unit in 18–21 months.
Share Swap: 195.2 shares in new entity for every 100 Apollo shares; Apollo to retain ~15% stake.
________________________________________
Investment Outlook & Conclusion:
📈 Bullish Case:
5th straight quarter of profit growth; Q1 beat estimates.
Expanding margins via premium care, diagnostics, and digital.
Demerger of digital health & pharmacy arm could unlock value.
AI investments to enhance efficiency & returns.
Rising insurance penetration & healthcare spending favor leaders.
________________________________________
📉 Bearish Case:
Premium valuation risks de-rating if growth slows.
Demerger success hinges on smooth execution.
Regulatory changes could impact margins.
Heavy capex & competition may delay returns.
________________________________________
📅 Short vs Long Term:
Short-term (1–3M): Possible follow-through gains from Q1 beat; track Q2 updates & demerger progress.
Long-term (12–24M): Growth from core hospitals + value creation via digital arm listing & AI-driven efficiency.
________________________________________
📊 STWP Trade Analysis:
Trend: Bullish continuation — price broke key range and sustained momentum.
Sample Trade Setup:
Entry: ₹7,840 | Stop: ₹7,011.95
Reference Levels: ₹8,668 (~1:1 RR), ₹9,496 (~1:2 RR)
💡 These prices are only for demonstrating risk–reward calculations and position planning — not for live execution.
________________________________________
Conservative Setup:
Entry Zone: ₹7,808.50–₹7,840 | Stop: ₹7,723.24
Reference Levels: ₹8,064, ₹8,235
(For learning position sizing and risk control)
________________________________________
Pullback Watch:
Zone: ₹7,717.56 | Stop: ₹7,594 | Potential retest area
Potential Use: Studying pullback retests in breakout structures.
________________________________________
Possible Demand Zone(on Daily Time Frame): 7285 - 7205 | SL 7196.45
This is for observing historical demand behaviour — not a call to buy.
________________________________________
Market View (Based on Current Data):
Overall Bias: Bullish positioning.
Trend: Uptrend likely if ₹7,800–₹7,850 holds as support.
Volatility: Moderate (IV ~22–26).
OI Insight: Strong call writing above spot & put writing below — bullish stance with support defense.
________________________________________
🔍 Option Structures – For Learning Purpose
(Prices, Greeks & OI data are from market snapshot on 13 Aug 2025)
________________________________________
7800 CE – LTP ₹155.60
📊 Delta: 0.54 | Theta: -6.27 | IV: 22.39%
💡 Breakeven: ₹7,955.60
Why it’s worth studying:
ATM strike with quick reaction to spot moves (Delta ~0.50)
Strong OI build-up (+1.52L) & high liquidity (37k contracts)
Positioned just above spot; could capture momentum on a 7,850+ breakout
________________________________________
7600 PE – LTP ₹66.60 | Contra View
📊 Delta: -0.27 | Theta: -4.19 | IV: 25.18%
💡 Breakeven: ₹7,533.40
Why study it:
Strong short build-up in Puts (+3.32L OI) shows confidence price stays above this level
~200 pts below spot, acting as a buffer support zone
Higher IV means time decay favours sellers if support holds
________________________________________
Bull Call Spread
🟢 Buy: 7800 CE @ ₹155.60
🔴 Sell: 8000 CE @ ₹72.20
💰 Net Debit: ₹83.40 | Breakeven: ₹7,883.40
Why study it:
Lowers cost vs. naked CE buy by pairing ATM buy with OTM sell
Positive delta for upside, with loss capped to net debit
8000 strike OI acts as a profit cap zone, helping define risk-reward
Reduces theta decay compared to a single long option
________________________________________
📘 My Trading Setup Rules
Avoid Gap Plays
→ Check pre-open price action to avoid trades influenced by gap-ups/gap-downs.
Breakout Entry Only
→ Enter trades only if price breaks previous day’s High (for bullish trades) or Low (for bearish trades).
Watch Volume for Confirmation
→ Monitor volume closely. No volume = No trade.
Enter on Strong Candle + Volume
→ Execute the trade only if a strong candle appears with increasing volume in the direction of the trade.
Defined Risk:Reward Only
→ Take trades only if R:R is favorable (ideally ≥ 1:2).
Premium Disclaimer
→ Option premiums shown are based on EOD prices — real-time premiums may vary during execution.
Time Frame Preference
→ Trade with your preferred time frame — this strategy works across intraday or positional setups.
________________________________________
⚠️ Disclaimer – Please Read Carefully
The information shared here is meant purely for learning and awareness. It is not a buy or sell recommendation and should not be taken as investment advice. I am not a SEBI-registered investment advisor, and all views expressed are based on personal study, chart patterns, and publicly available market data.
Trading — whether in stocks or options — carries risk. Markets can move unexpectedly, and losses can sometimes be larger than the money you have invested. Past performance or past setups do not guarantee future results.
If you are a beginner, treat this as a guide to understand how the market works — practice on paper trades before risking real money. If you are an experienced trader, remember to assess your own risk, position sizing, and strategy suitability before entering any trade.
Data, prices, and analysis are based on information available as of 12 August 2025, and market conditions can change at any time. Always verify with reliable sources and consult a SEBI-registered financial advisor before making any real trading decision.
By reading, watching, or engaging with this content, you acknowledge that you take full responsibility for your own trades and investments.
________________________________________
💬 Found this useful?
Drop your thoughts, questions, or setups in the comments — let’s grow together!
🔁 Share this post with fellow traders and beginners to spread clean, structure-based learning.
✅ Follow simpletradewithpatience for beginner-friendly setups, price action insights, and disciplined trading content.
🚀 Stay Calm. Stay Clean. Trade With Patience.
Trade Smart | Learn Zones | Be Self-Reliant 📊
________________________________________
LUPIN LIMITED – Technical Analysis________________________________________
📊 LUPIN LIMITED – Technical & Fundamental Snapshot
Ticker: NSE:LUPIN | Sector: Pharmaceuticals
Current Market Price (CMP): ₹1,944.20 ▲ (+4.99%) (as of August 7, 2025)
Chart Pattern: Consolidation Zone (Between ₹1,795.20 and ₹2,225)
Market Sentiment: ⭐⭐⭐ Neutral-to-Positive
________________________________________
🔍 What’s Happening on the Chart?
Lupin’s stock is moving sideways — like it's stuck in a box.
📦 Box Range: Between ₹1,795.20 (bottom) and ₹2,225 (top)
👉 Current price is near the middle at ₹1,944.20 — this means buyers and sellers are in a tug of war.
________________________________________
🕯️ Candle & Indicator Analysis (Simplified)
Here’s what the chart is telling us:
📈 Bullish Marubozu Candle:
Strong green candle — indicates buyers were in control all day.
VWAP (Volume Weighted Avg. Price):
✅ Positive — suggests big players (institutions) may be buying.
MACD (Momentum):
⚠️ Bearish — signals that upside momentum is still not strong.
RSI (Relative Strength Index):
52 = Neutral — price isn't overbought or oversold.
Stochastic Indicator:
69 and rising — momentum could be picking up soon.
CCI (Commodity Channel Index):
–17 = Slight weakness, but still within a normal zone.
🧠 What This Means:
The chart is not strongly bullish yet, but it’s showing early signs. Wait for price to break out of the range to confirm strength.
________________________________________
🧭 Key Levels to Watch (Support & Resistance)
📌 Resistance (where price may face selling pressure):
R1: ₹1,980
R2: ₹2,015
R3: ₹2,077
📌 Support (where price may bounce from):
S1: ₹1,882
S2: ₹1,820
S3: ₹1,784
________________________________________
🚨 Breakout Watch Zone
📈 If price breaks and holds above ₹1,980–₹2,015, momentum may increase.
📉 A fall below ₹1,795 might look bearish, but if it bounces back quickly, it can be a false breakdown.
🧠 Beginner Tip:
Don’t rush into a trade. Wait for a close above key levels to confirm direction. Patience protects your capital.
________________________________________
📰 Recent News & Sentiment Update
🧾 Strong Q1 FY26 Results:
Net Profit: ₹1,221 Cr (↑ 52% YoY)
Revenue: ₹6,164 Cr
💥 Stock Reaction:
Price jumped nearly 5% after the earnings report.
⚠️ Macro Risk Alert:
US President Trump hinted at tariffs up to 250% on pharma imports. If this happens, Indian pharma exporters like Lupin could be impacted. (📢 Source: The Economic Times )
________________________________________
📈 Investment Outlook (Short & Long Term)
⏳ Short-Term:
Watch price near ₹1,980–₹2,015 zone
If it breaks out, there may be upside potential
If not, expect more sideways movement within the ₹1,795–₹2,225 range
📆 Long-Term:
If growth continues and tariff fears cool down, the stock may head towards ₹2,200–₹2,375
________________________________________
🧠 STWP’s Educational Trade Idea (Not a Recommendation)
🎯 Watch for potential long trade above: ₹1,952.70
🛑 Stop Loss (to manage risk): ₹1,834.35
💡 Risk-Reward Idea: 1:1 minimum, aim for 1:2 or better
⚠️ This is not a buy or sell signal. It’s shared to help understand trade planning.
________________________________________
🔰 Trading Note for Beginners:
Don’t just buy based on news or a green candle. Use levels, wait for confirmation, and always define your risk with a stop loss.
________________________________________
⚠️ Disclaimer (Please Read Carefully):
This content is shared strictly for educational and research purposes only.
I am not a SEBI-registered investment advisor, and no buy or sell recommendations are being made.
All views expressed are based on personal market analysis and experience. They are not intended as financial advice.
Trading — especially in derivatives like options — involves significant financial risk. Losses can exceed your initial investment.
👉 Always do your own research and consult a certified SEBI-registered advisor before making any investment or trading decisions.
👉 Use proper risk management and only trade with capital you can afford to lose.
The author assumes no responsibility or liability for any trading losses incurred from acting on this content.
By engaging with this material, you agree to these terms.
________________________________________
💬 Found this helpful?
Drop your thoughts, questions, or insights in the comments below ⬇️ — let’s learn together!
🔁 Share this post with your trading friends and community — help them discover clean charts, structured setups, and zone-based learning.
✅ Follow simpletradewithpatience for clear setups, educational content, and a no-nonsense approach to price action, supply-demand zones, and risk-managed trades.
🚀 Trade with patience. Trust your charts. Stay clear-headed.
Because the goal is not just to trade — it's to trade better.
Be Self-Reliant | Trade with Patience | Learn with Charts & Zones 📊
________________________________________

PAYTM – Technical & Fundamental Analysis📊 PAYTM – Technical & Fundamental Educational Snapshot
Ticker: NSE: PAYTM | Sector: 🏦 Digital Payments & Financial Services
CMP: ₹1,122 ▲ (as of 11 Aug 2025)
Rating: ⭐⭐⭐⭐☆ (Moderately Bullish Setup – Educational Purposes Only)
Pattern Observed: 🏆 Cup & Handle (Monthly)
PAYTM has been forming a Cup & Handle pattern on the monthly time frame, indicating the possibility of a bullish continuation. The stock recently closed at ₹1,122 (11 Aug 2025), approaching its immediate resistance zone of ₹1,151 – ₹1,180, with a potential extension toward ₹1,321 if momentum sustains. On the downside, support levels are placed at ₹1,072, ₹1,021, and ₹992. Technical indicators show RSI at 70 (breakout zone), CCI at 103, and Stochastic at 93, signaling strong momentum. While WVAP trend remains bullish and volume surged to 9.41M vs 20-SMA volume of 7.7M, the MACD is still in bearish territory, suggesting caution. Given the 52-week breakout and strong price structure, the setup currently leans bullish for swing trades, provided price holds above key supports.
One97 Communications (Paytm): Shares have gained analyst attention following a 13% rally over the past month. SEBI-registered analyst Mayank Singh Chandel highlighted Paytm’s first-ever operational profit in Q1, marking a major turnaround from losses seen just 18 months prior, bolstered by the complete exit of Chinese investor Antfin in August 2025, which is expected to improve regulatory compliance. Meanwhile, the company continues to narrow its losses—its Q1 consolidated net loss fell to ₹2.9 billion, down from ₹3.6 billion a year earlier, with a 16% year-on-year increase in revenue to ₹29.8 billion. Technically, the stock is navigating a resistance zone between ₹1,000–₹1,150, with a breakout above ₹1,150 possibly signaling further upside.
Investment Outlook & Conclusion: The stock presents a balanced risk-reward scenario. On the bullish side, continued earnings growth, sector tailwinds, and improving technical structure could support upward momentum. However, downside risks include adverse market sentiment, sectoral weakness, or failure to sustain key support levels. In the short term, price action may remain volatile with potential pullbacks, while in the long term, sustained fundamentals and trend confirmation could offer attractive opportunities.
📊 STWP Trade Analysis – The setup reflects bullish continuation characteristics in classical technical analysis. For educational illustration, a possible framework could consider a reference entry near ₹1,130, supported by an illustrative stop loss at ₹1,046 for risk management. Example upside objectives include ₹1,213 (1:1 Risk-Reward) and ₹1,296 (1:2 Risk-Reward), while a potential pullback reference zone is placed between ₹1,090 – ₹1,080 as a possible retest area.
⚠️ Disclaimer (Read Carefully)
This post is for educational and informational purposes only.
The author is not a SEBI-registered investment advisor. No buy or sell recommendations are being made.
All views are based on chart patterns, publicly available data, and personal learning experience.
Trading involves risk. Losses can exceed your investment. Always consult a SEBI-registered advisor before making financial decisions.
By engaging with this content, you agree to these terms.
________________________________________
💬 Was this useful?
Drop your thoughts, questions, or setups in the comments — let’s grow together!
🔁 Share this post with fellow traders and beginners to spread clean, structure-based learning.
✅ Follow simpletradewithpatience for beginner-friendly setups, price action insights, and disciplined trading content.
🚀 Stay Calm. Stay Clean. Trade With Patience.
Trade Smart | Learn Zones | Be Self-Reliant 📊

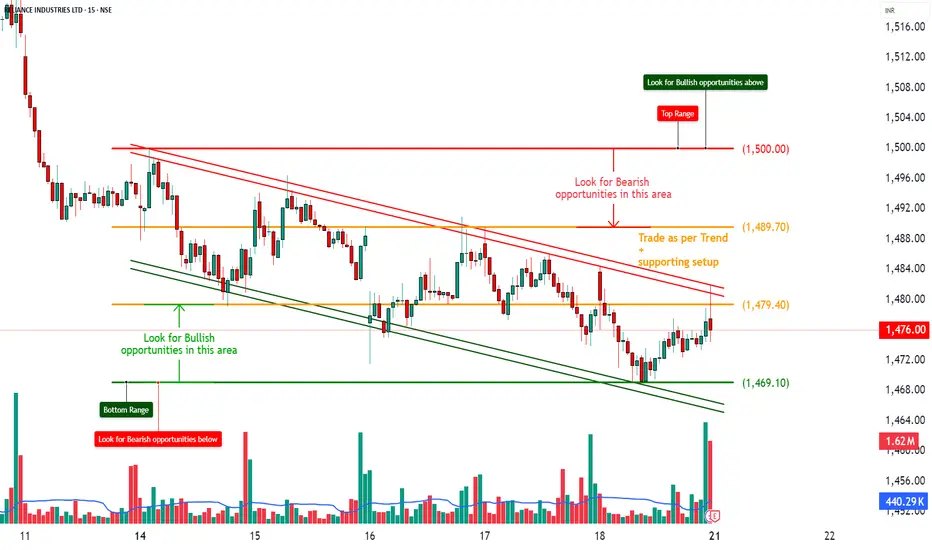
RELIANCE – Positive Outlook Post Q1 Results with Bullish OI________________________________________________________________________________📈 RELIANCE – Positive Outlook Post Q1 Results with Bullish OI Confirmation
📅 Setup Date: 17.07.2025 | ⏱ Timeframe: Daily
📍 Strategy: Post-Earnings Momentum Setup with Defined Risk
________________________________________________________________________________
🔍 Overall View
Spot Price: ₹1476
Q1 Result Update: Profit ↑12% YoY, beat estimates — strong earnings trigger
Trend: Bullish Reversal – Price holding above 1470 with fresh long build-up in CEs
Volatility: IV ~23–27%, stable to slightly rising → good for directional plays
Ideal Strategy Mix: Bullish directional spreads or high delta long CE
________________________________________________________________________________
1️⃣ Bullish Trade
Best CE: Buy 1480 CE @ ₹25.15
Why:
• Long Build-Up (+60.38% OI) with price ↑3.5% — strong institutional buying
• At-the-money with delta 0.50 → responsive to price movement
• High OI (27.5 lakh) with active volumes confirms smart money activity
• Matches post-result momentum — ideal CE for breakout strategy
________________________________________________________________________________
2️⃣ Bearish Trade (Contrarian)
Best PE: Sell 1450 PE @ ₹10.75
Why:
• Short Covering seen (-5.57% OI) → downside hedge positions getting closed
• Price ↑3.3% and IV stable (22.36%) → premium erosion favorable
• Spot is comfortably above ₹1450, providing buffer
• Rests below key support zone post-result → limited downside expectation
________________________________________________________________________________
3️⃣ Strategy Trade (As per trend + OI data)
Strategy: Bull Call Spread → Buy 1480 CE / Sell 1520 CE
→ ₹25.15 / ₹8.85
Net Debit: ₹16.30
Max Profit: ₹40 – ₹16.30 = ₹23.70
Max Loss: ₹16.30
Risk:Reward: ≈ 1 : 1.45 ✅
Lot Size: 500
Total Risk: ₹8,150
Max Profit: ₹11,850
📊 Breakeven Point: ₹1496.30
📉 Exit If: Spot closes below ₹1465 (invalidates CE strength and post-result optimism)
________________________________________________________________________________
Why:
• Strong Q1 numbers + fresh long build-up on 1480 CE and 1470 CE
• 1520 CE also active but minor short covering = good candidate to sell
• IVs are moderate, giving clean pricing for spreads
• Defined risk, R:R > 1:1, and positive delta makes this strategy safer
________________________________________________________________________________
📘 My Trading Setup Rules
Avoid Gap Plays
→ Check pre-open price action to avoid trades influenced by gap-ups/gap-downs.
Breakout Entry Only
→ Enter trades only if price breaks previous day’s High (for bullish trades) or Low (for bearish trades).
Watch Volume for Confirmation
→ Monitor volume closely. No volume = No trade.
Enter on Strong Candle + Volume
→ Execute the trade only if a strong candle appears with increasing volume in the direction of the trade.
Defined Risk:Reward Only
→ Take trades only if R:R is favourable (ideally ≥ 1:2).
Premium Disclaimer
→ Option premiums shown are based on EOD prices — real-time premiums may vary during execution.
Time Frame Preference
→ Trade with your preferred time frame — this strategy works across intraday or positional setups.
________________________________________________________________________________
⚠ Disclaimer (Please Read):
• These Trades are shared for educational purposes only and is not investment advice.
• I am not a SEBI-registered advisor.
• The information provided here is based on personal market observation.
• No buy/sell recommendations are being made.
• Please do your own research or consult a registered financial advisor before making any trading decisions.
• Trading involves risk. Always use proper risk management.
I am not responsible for trading decisions based on this post.
________________________________________________________________________________
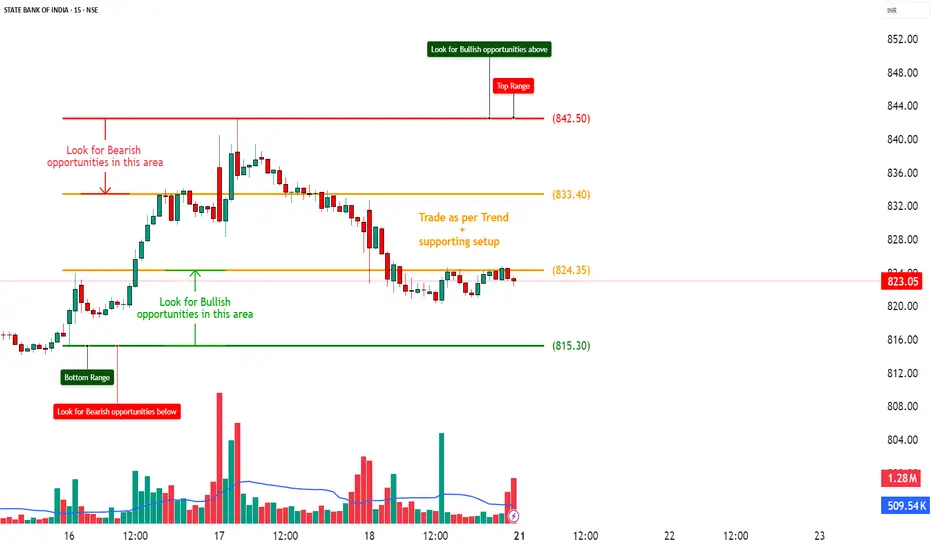
SBIN – Bearish Bias with Heavy CE Shorts and Weak Call Structure________________________________________________________________________________📈 SBIN – Bearish Bias with Heavy CE Shorts and Weak Call Structure
📅 Setup Date: 17.07.2025 | ⏱ Timeframe: Daily
📍 Strategy: Short-Term Bearish Momentum Setup with Defined Risk
________________________________________________________________________________
🔍 Overall View
Spot Price: ₹823.35
Trend: Mildly Bearish – Spot facing resistance at 830–840 with weak CE premiums
Volatility: IV ~18%–22% (stable to slightly elevated)
Ideal Strategy Mix: Bearish directional trades or credit spreads near resistance
________________________________________________________________________________
1️⃣ Bullish Trade (Contrarian Setup)
Best CE: Buy 820 CE @ ₹12.65
Why:
• ATM strike with highest delta (0.56) among CEs
• Smallest short build-up in CE chain (OI ↑0.73%, vs ~+4%–12% on other CEs)
• If spot reclaims 830+, this option will respond fastest
• IV is lowest (17.73%) = cheapest in premium vs other strikes
Contrarian Setup – Not ideal unless spot crosses 830 with strong volume
________________________________________________________________________________
2️⃣ Bearish Trade
Best PE: Buy 820 PE @ ₹8.65
Why:
• Strong Long Build-Up (+29.5% OI), volume-led spike (+46.6%)
• Solid delta (-0.44) with decent Vega → responds well to downside
• IV is relatively low (19.6%), allowing room for expansion
• Ideal strike as spot sits slightly above – quick delta pickup expected
________________________________________________________________________________
3️⃣ Strategy Trade (As per trend + OI data)
Strategy: Bear Put Spread → Buy 820 PE / Sell 800 PE
→ ₹8.65 / ₹3.00
Net Debit: ₹5.65
Max Profit: ₹20 – ₹5.65 = ₹14.35
Max Loss: ₹5.65
Risk:Reward: ≈ 1 : 2.54 ✅
Lot Size: 750
Total Risk: ₹4,237.50
Max Profit: ₹10,762.50
📊 Breakeven Point: ₹814.35
📉 Exit If: Spot closes above ₹832 (invalidates PE strength and bearish structure)
________________________________________________________________________________
Why:
• Heavy CE short build-up across 820–850 strikes (Bearish Call Ladder)
• 820 PE has strong long buildup + clean delta = momentum PE
• 800 PE still holding OI, good strike to sell for defined risk
• IVs are still in mid-range = spread cost low, R:R > 1:2.5
________________________________________________________________________________
📘 My Trading Setup Rules
Avoid Gap Plays
→ Check pre-open price action to avoid trades influenced by gap-ups/gap-downs.
Breakout Entry Only
→ Enter trades only if price breaks previous day’s High (for bullish trades) or Low (for bearish trades).
Watch Volume for Confirmation
→ Monitor volume closely. No volume = No trade.
Enter on Strong Candle + Volume
→ Execute the trade only if a strong candle appears with increasing volume in the direction of the trade.
Defined Risk:Reward Only
→ Take trades only if R:R is favourable (ideally ≥ 1:2).
Premium Disclaimer
→ Option premiums shown are based on EOD prices — real-time premiums may vary during execution.
Time Frame Preference
→ Trade with your preferred time frame — this strategy works across intraday or positional setups.
________________________________________________________________________________
⚠ Disclaimer (Please Read):
• These Trades are shared for educational purposes only and is not investment advice.
• I am not a SEBI-registered advisor.
• The information provided here is based on personal market observation.
• No buy/sell recommendations are being made.
• Please do your own research or consult a registered financial advisor before making any trading decisions.
• Trading involves risk. Always use proper risk management.
I am not responsible for trading decisions based on this post.
________________________________________________________________________________
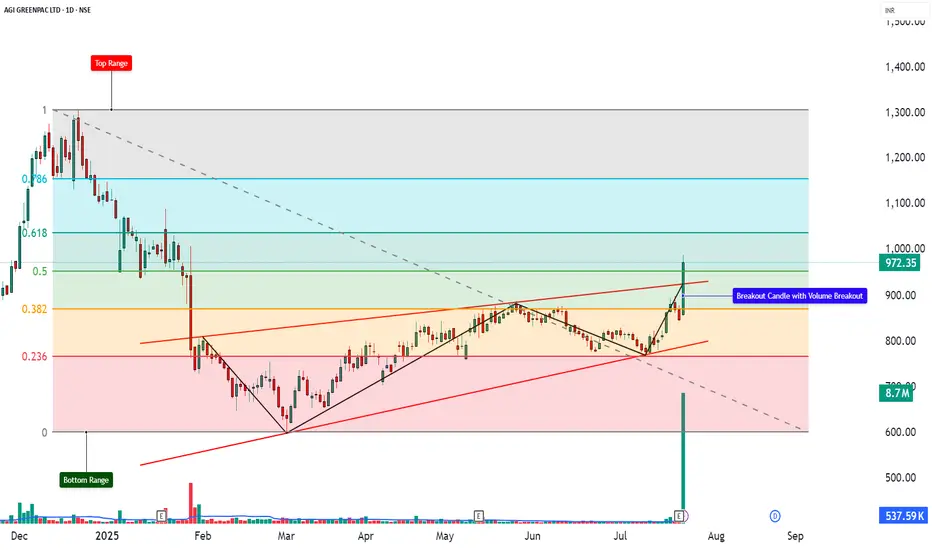
AGI - Breakout Alert – Strong Volume, Clear Trend, Smart Zones! ________________________________________________________________________________
📈 AGI GREENPAC LTD – AGI GREENPAC Breakout Alert – Strong Volume, Clear Trend, Smart Zones! Breakout
🕒 Chart Type: Daily Chart
📆 Date: July 22, 2025
________________________________________________________________________________
📌 Price Action:
AGI GREENPAC has staged a textbook breakout above its rising channel, with a massive +14.83% rally, closing the day at ₹972.35. The price not only cleared a medium-term resistance level but also broke above critical Fibonacci levels, reclaiming bullish control. This is not just a price breakout — it's a structure + volume + indicator alignment, offering a compelling bullish setup with potential for follow-through.
________________________________________________________________________________
📊 Chart Pattern:
✅ Rising Channel Breakout – A bullish continuation pattern formed over several months
✅ Breakout occurred near the channel’s upper boundary with explosive volume
✅ Price cleared 0.5 (₹950.50) and 0.618 (₹1037.15) Fibonacci retracement levels from the prior fall
✅ The structure was backed by a base formation, indicating accumulation beneath resistance. This pattern signals a potential transition from slow ascent to impulsive trend phase — a powerful sign when backed by volume and momentum indicators.
________________________________________________________________________________
🕯️ Candlestick Pattern:
✅ Wide-Range Bullish Candle
✅ Open = Low formation (strength from the first tick)
✅ Strong follow-through above consolidation
✅ Classic “Buy Today, Sell Tomorrow” price action
✅ Confirms structural breakout from channel top
________________________________________________________________________________
🔊 Volume Analysis:
AGI GREENPAC saw a big jump in trading volume, with over 8.7 million shares traded — that’s more than double the usual average of the past 20 days. This kind of volume shows that a lot more people were actively buying the stock, and it wasn’t just a one-time spike — the buying continued throughout the day. What makes this even more special is that it comes after many days of low activity, which often means big investors were slowly building their positions. When such quiet periods are followed by a big volume and price breakout, it usually signals the start of a strong uptrend. Also, this is the highest volume in the past 52 weeks, which gives even more strength to this breakout and shows serious buying interest.
________________________________________________________________________________
📈 Technical Indicators:
The technical indicators are showing strong signs of bullish momentum in AGI GREENPAC. The RSI is at 73, which means the stock is trending strongly and buyers are in control. The MACD, a popular momentum indicator, has given a bullish crossover both on the daily and weekly charts — this is a positive signal that the trend may continue. The CCI, which tracks the speed and strength of price moves, is at 274, indicating very strong upside pressure. The Stochastic is at 93, which means the stock is in the overbought zone, but still confirming the ongoing strength. The price is trading above the VWAP (Volume Weighted Average Price), showing that buyers are dominating the day. Lastly, the stock has broken out of a Bollinger Band squeeze — a setup where the price was moving in a tight range and has now burst out with momentum. When all these indicators point in the same direction, it gives us a high-confidence signal that the breakout is genuine and may continue.
________________________________________________________________________________
🧱 Support & Resistance:
🔻 Supports:
• ₹887.83 – Immediate support (breakout zone)
• ₹803.32 – Mid-structure base
• ₹752.93 – Last support before invalidation
• Bottom Range: ₹599.10 – Historical demand base
🔺 Resistance Zones:
• ₹1022.73 – First resistance (Fibonacci level)
• ₹1073.12 – Previous swing top
• ₹1157.62 – 0.786 Fib level and prior rejection area
• Top Range: ₹1307.90 – Final upside Fibonacci target
________________________________________________________________________________
👀 What’s Catching Our Eye:
What really makes this setup stand out is that everything is coming together at once — and that doesn’t happen often. The stock has broken out of a rising channel, which is a strong chart pattern. It also crossed important Fibonacci levels, showing strength in the move. The volume is more than double the average, which tells us that serious buyers are stepping in. Momentum indicators like RSI and CCI are showing strong upward energy. On top of that, the price has broken out of a tight Bollinger Band range and is staying above VWAP, which adds more strength to the trend. When so many signals align like this, it usually means the stock has a good chance of moving even higher — this is what we call a high-confidence breakout.
________________________________________________________________________________
🔍 What We’re Watching For:
The key thing now is whether the stock can stay above the ₹950–₹960 zone over the next few days. If it does, it will confirm that the breakout is strong and has the potential to move higher. However, if the price dips slightly into the ₹900–₹915 range with low volume, it could be a good opportunity for a safe re-entry. On the other hand, if the stock closes below ₹887, it may be a warning sign that the breakout is failing. This zone is very important — it’s the make-or-break level that will decide if the uptrend continues or fades away.
________________________________________________________________________________
✅ Best Buy Levels (Low Risk Idea):
🔹 Entry: On pullback to ₹861.7–₹864.9 zone with SL ₹848.54
🔹 Low Risk Entry: ₹851.12 with Stop Loss: ₹833.72 (closing basis)
🔹 Risk-Reward: 1:1 | 1:2 +
📌 Avoid chasing — let the price validate the breakout
________________________________________________________________________________
💼 Sector Tailwinds:
AGI GREENPAC is in a business that’s currently seeing strong demand — especially from sectors like real estate, pharmaceutical packaging, alcohol bottling, and FMCG (like food and household products). These industries need high-quality glass and packaging, which is exactly what AGI provides. With growth happening in these areas, the company stands to benefit. This means that the fundamentals are also supporting the chart breakout, making the overall setup even stronger.
________________________________________________________________________________
⚠️ Risks to Watch:
Even though the chart looks strong, there are a few things to be careful about.
First, indicators like RSI and Stochastic show that the stock is in the overbought zone, which means a small pullback or correction is possible. If the price closes below ₹887, it could mean the breakout has failed. Also, if you start seeing red candles with low volume, it might be an early sign that buying interest is fading. Most importantly — don’t invest all your money at once. It's always better to enter with proper risk management and a clear plan, especially after a sharp move.
________________________________________________________________________________
🔮 What to Expect Next:
If AGI GREENPAC stays above the ₹950–₹960 range, it can likely move up to ₹1022–₹1073 in the short term. If the momentum continues and the stock breaks above ₹1073, it could head even higher toward ₹1157–₹1300 in the coming weeks. But if the price drops below ₹887, it could mean the breakout has failed, and the upward trend might not continue. So, the next few days are very important to confirm whether the breakout is real and sustainable.
________________________________________________________________________________
🧠 How to Trade AGI GREENPAC (For Educational Use Only):
🔹 Breakout Plan
• Entry: ₹988.60 or Pullback Zone ₹903–₹915
• SL: ₹842 (Closing basis)
• Risk-Reward: 1:1 | 1:2 +
• Position Sizing: Never all-in — always size by risk
________________________________________________________________________________
⚠ Disclaimer (Please Read):
• These Trades are shared for educational purposes only and is not investment advice.
• I am not a SEBI-registered advisor.
• The information provided here is based on personal market observation.
• No buy/sell recommendations are being made.
• Please do your own research or consult a registered financial advisor before making any trading decisions.
• Trading involves risk. Always use proper risk management.
I am not responsible for trading decisions based on this post.
________________________________________________________________________________
💬 Found this Helpful?
How would you trade this — chase momentum or wait for pullback entry?
👇 Drop your thoughts or questions below
🔁 Share this post with your trading community – let them benefit from clean charts, structured setups, and zone-based learning.
✅ Follow simpletradewithpatience for charts, clean setups, and educational content based on price action, zones, and risk-managed trades.
🚀 Trade with patience, trust your charts, and stay clear-headed!
Be Self-Reliant | Trade with Patience | Learn with Charts & Zones 📊________________________________________
HINDUSTAN UNILEVER LTD – Technical Analysis________________________________________
🧠 HINDUSTAN UNILEVER LTD – Technical Analysis
Ticker: NSE: HINDUNILVR | Sector: FMCG
Current Price: ₹2,521.20 ▲ (+3.44% on July 31, 2025)
Technical View: ⭐⭐⭐⭐ | Chart Pattern: Volume-Driven Range Breakout
________________________________________
Latest News & Developments
Hindustan Unilever (HUL) reported strong Q1 FY26 results, with standalone net profit rising 7.6% YoY to ₹2,732 crore and consolidated profit up ~6%. Revenue grew ~4–5% YoY, aided by a rural demand rebound and volume-led gains in home care and beauty segments. While demand recovery is still gradual and margin guidance has been trimmed, the company is ramping up investments for future growth. A key structural change includes the demerger of its Kwality Wall’s ice-cream business by FY26-end. Leadership transition is also underway, with Priya Nair set to take over as CEO & MD from August 1, 2025. Shares surged 3.5% on July 31 to ₹2,521.85, outperforming the market.
________________________________________
Technical Analysis & Chart Pattern
Hindustan Unilever Ltd (HUL) has broken out above a key resistance zone of ₹2,440–2,445 on the daily chart, supported by strong volume and a bullish candle. This move ends the prior consolidation phase between ₹2,136–2,602. Momentum indicators such as RSI (~70), MACD, and moving averages show a bullish bias. If the price sustains above ₹2,500, the stock may trend toward resistance levels at ₹2,573, ₹2,625, and ₹2,702. Key support levels lie at ₹2,445, ₹2,368, and ₹2,316.
________________________________________
Trade Analysis (SEBI-Compliant | Educational Purpose Only)
As per the chart structure, the stock has shown a breakout above the ₹2,440–2,450 zone on strong volume, currently near ₹2,521. If momentum sustains, potential price zones to watch are ₹2,575–2,625 in the near term and ₹2,700+ in the medium term. A logical risk level could be around ₹2,395 or near the breakout point of ₹2,440.
________________________________________
Technical & Sentiment Snapshot
The stock recently broke out with strong volume, indicating accumulation post-consolidation. A pullback toward ₹2,440–2,430 may test the breakout zone, while a move to ₹2,360–2,316 could signal range re-entry. Sustained trade above ₹2,500–2,520 may indicate trend continuation. Market participants are watching volume behaviour on dips and potential sentiment shifts under new leadership. Key risks include broader market weakness, margin pressures, and rural/urban demand trends.
________________________________________
Educational Insight for Learners
A classic breakout occurs when a stock trades within a defined range (support and resistance) and then moves sharply beyond that range with strong volume. To identify such setups, observe the range boundaries, wait for a confirmed close outside the range, and ensure volume rises on the breakout. Entry is ideally near the breakout, with a stop just inside the range and targets based on the range height. The recent price action in HUL aligns well with this rectangle breakout concept — a valuable pattern for learners to study.
________________________________________
⚠️ Disclaimer & Educational Note
This content is strictly for educational and research purposes only. I am not a SEBI-registered advisor, and no buy/sell recommendations are being provided. All insights are based on personal analysis and experience and are not financial advice.
📘 This setup illustrates how combining price action (candlesticks), support/resistance zones, volume, and indicators like RSI or MACD can help build conviction in trades. However, trading—especially in derivatives like options—involves high risk, and losses can exceed the initial investment.
👉 Always do your own research and consult a SEBI-registered advisor before taking any position.
👉 Use strict risk management and only trade with capital you can afford to lose.
The author assumes no liability for any losses incurred.
By engaging with this content, you agree to these terms.
________________________________________
💬 Found this helpful?
Drop your thoughts, questions, or insights in the comments below ⬇️ — let’s learn together!
🔁 Share this post with your trading friends and community — help them discover clean charts, structured setups, and zone-based learning.
✅ Follow simpletradewithpatience for clear setups, educational content, and a no-nonsense approach to price action, supply-demand zones, and risk-managed trades.
🚀 Trade with patience. Trust your charts. Stay clear-headed.
Because the goal is not just to trade — it's to trade better.
Be Self-Reliant | Trade with Patience | Learn with Charts & Zones 📊
________________________________________

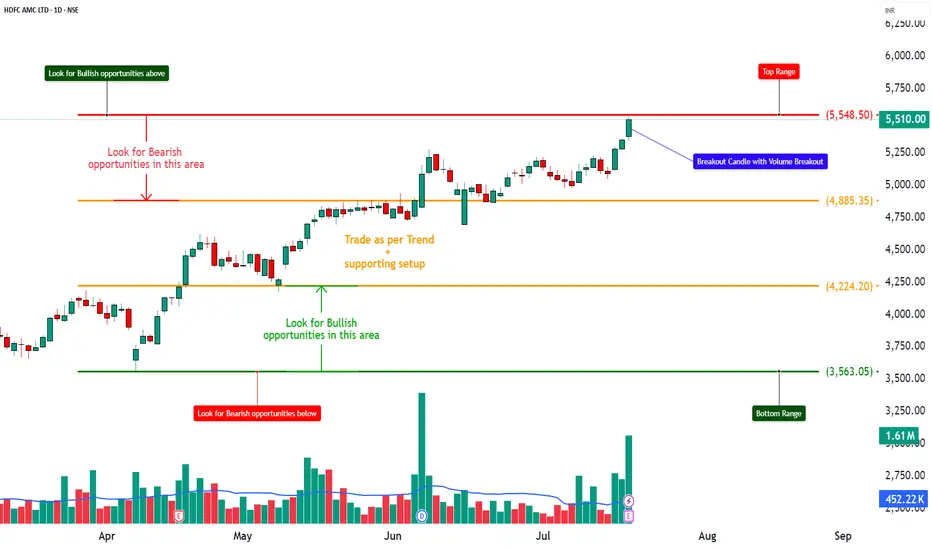
KAYNES TECHNOLOGY IND LTD – Price Action + ZonesKAYNES TECHNOLOGY IND LTD – Price Action + Zones
Ticker: NSE:KAYNES | Sector: Electronics & Semiconductors
Timeframe: 15-Min | Current Price: ₹6,200.00 ▲ (+0.49%)
Technical View: ⭐⭐⭐⭐ | Chart Setup: Breakout with Zone-Based Trade Planning
Kaynes Technology (NSE:KAYNES) has exhibited strong directional momentum following a structured breakout above a prior consolidation range, as seen on the 15-minute chart. The price surged past intermediate resistance near ₹5,990 and is currently stabilizing around ₹6,200, suggesting trend continuation if supported by further volume. Marked zones like the Top Range (₹6,284) and Bottom Range (₹5,405) provide a visual framework to understand price behavior—where strength above upper resistance may invite bullish setups, while failure to hold could signal re-entry into the lower band. A clearly defined demand zone (₹5,850–₹5,764.50) with an example SL near ₹5,755 offers a contextual learning area to study zone-based entries with risk-reward alignment. Observing volume expansion on the breakout and contraction during consolidation is key for interpreting trend strength. The annotation “Trade as per Trend + Supporting Setup” reinforces the importance of directional bias and confluence. All observations are shared to help learners understand breakout structure, demand zones, and price-volume correlation in a real-world context.
⚠️ Disclaimer & Educational Note
This content is strictly intended for educational and research purposes related to the technical study of Kaynes Technology (NSE:KAYNES). I am not a SEBI-registered advisor, and no buy/sell recommendations are being made. All insights are based on personal chart analysis, price-action interpretation, and educational zone-mapping — not financial advice.
📘 The visual setup in this post demonstrates how traders and learners can study breakout structures, demand/supply zones, price-volume behavior, and risk levels in a controlled technical environment. Tools like support/resistance mapping, volume confirmation, and structure-based SL planning help illustrate disciplined trade preparation. However, trading — particularly in leveraged instruments like options or intraday setups — involves substantial risk, and losses can exceed the initial investment.
👉 Always do your own due diligence and consult a SEBI-registered investment advisor before taking any positions in the market.
👉 Practice strict risk management, and only trade with capital you can afford to lose.
The author assumes no responsibility for financial decisions based on this educational content. By engaging with this content, you acknowledge and accept these terms.
💬 Found this helpful?
Drop your thoughts, questions, or insights in the comments below ⬇️ — let’s learn together!
🔁 Share this post with your trading friends and community — help them discover clean charts, structured setups, and zone-based learning.
✅ Follow simpletradewithpatience for clear setups, educational content, and a no-nonsense approach to price action, supply-demand zones, and risk-managed trades.
🚀 Trade with patience. Trust your charts. Stay clear-headed.
Because the goal is not just to trade — it's to trade better.
Be Self-Reliant | Trade with Patience | Learn with Charts & Zones 📊

GODREJ CONSUMER PRODUCTS – Price Action + ZonesGODREJ CONSUMER PRODUCTS – Price Action + Zones
Ticker: NSE\:GODREJCP | Sector: FMCG
Timeframe: 15-Min | Current Price: ₹1,259.00 ▼ (−0.08%)
Technical View:⭐⭐⭐⭐ | Chart Setup: Range Bound Structure with Demand Zone Revisit in Focus
Godrej Consumer Products (NSE\:GODREJCP) is currently trading within a well-defined short-term range, with resistance capped near ₹1,265.50 and an anchored demand zone around ₹1,224.40–₹1,216.90. The stock has shown prior strength with a breakout above ₹1,244.35, but price is now consolidating between the orange mid-range and red supply zone, reflecting indecision. A clean zone-based structure is visible: the Top Range (₹1,265.50) may trigger bullish momentum if breached with volume, while failure to sustain may invite short setups within the range. The mid-structure zone (₹1,244.35) acts as a trend filter, while the green Demand Zone provides a case study for risk-managed entries — with example SL at ₹1,215.75 and mapped risk of ₹8.65. The Bottom Range (₹1,202.20) defines a lower band, and annotations like “Trade as per Trend + Supporting Setup” guide the learner to wait for trend + confluence. This setup is ideal for understanding how price reacts at key zones, how to frame directional bias within ranges, and how demand zones aid structured trade planning with logical stop-loss levels.
---
⚠️ **Disclaimer & Educational Note**
This content is strictly intended for educational and research purposes related to the technical study of Godrej Consumer Products (NSE\:GODREJCP). I am not a SEBI-registered advisor, and no buy/sell recommendations are being made. All insights are based on personal chart analysis, price-action interpretation, and educational zone-mapping — not financial advice.
📘 The visual setup in this post demonstrates how traders and learners can study breakout structures, demand/supply zones, price-volume behavior, and risk levels in a controlled technical environment. Tools like support/resistance mapping, volume confirmation, and structure-based SL planning help illustrate disciplined trade preparation. However, trading — particularly in leveraged instruments like options or intraday setups — involves substantial risk, and losses can exceed the initial investment.
👉 Always do your own due diligence and consult a SEBI-registered investment advisor before taking any positions in the market.
👉 Practice strict risk management, and only trade with capital you can afford to lose.
The author assumes no responsibility for financial decisions based on this educational content. By engaging with this content, you acknowledge and accept these terms.
---
💬 **Found this helpful?**
Drop your thoughts, questions, or insights in the comments below ⬇️ — let’s learn together!
🔁 Share this post with your trading friends and community — help them discover clean charts, structured setups, and zone-based learning.
✅ Follow **simpletradewithpatience** for clear setups, educational content, and a no-nonsense approach to price action, supply-demand zones, and risk-managed trades.
🚀 *Trade with patience. Trust your charts. Stay clear-headed.*
Because the goal is not just to trade — it's to trade better.
**Be Self-Reliant | Trade with Patience | Learn with Charts & Zones 📊**
---

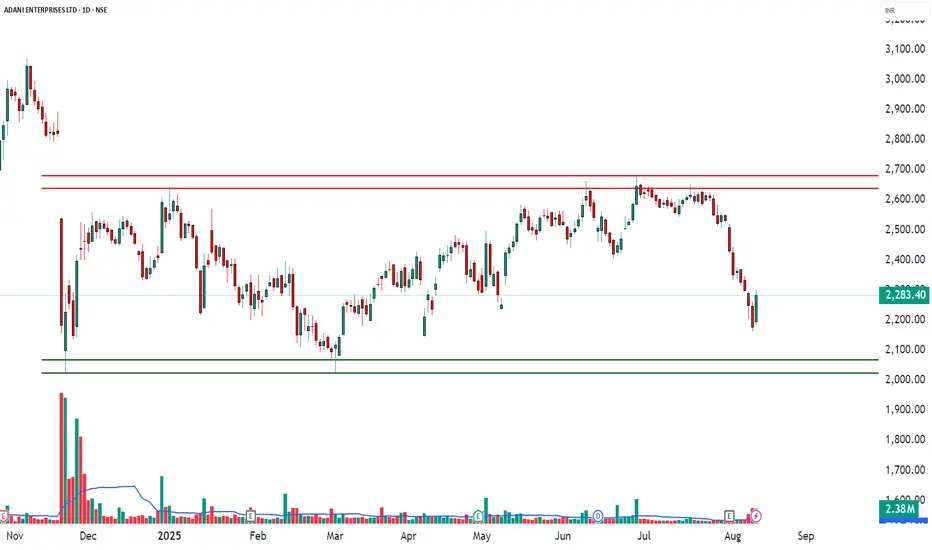
ADANIENT – Options Trade Snapshot📄 ADANIENT – Options Trade Snapshot (Educational Analysis)
Date: 12 Aug 2025
Spot Price: ₹2,283.40
Market View: Bullish bias based on option data & price structure
Overall Sentiment: Positive – multiple Call short coverings and fresh Put short build-ups
Volatility (IV): 34.5% – 51.4% (moderate–high, suggesting option premiums are relatively elevated)
Analysis Purpose: For market study & understanding of option chain signals
1️⃣ Observed Bullish Setup – 2300 Call Option
LTP: ₹64.05
Breakeven (for understanding): ₹2,364.05
Notable Data Points:
Volume spike: 22,099 contracts (166% higher than usual)
IV decreased while price increased → generally indicates aggressive buying
Delta ~0.5 → option price moves about ₹0.50 for every ₹1 in underlying
2️⃣ Observed Neutral-to-Bullish Setup – 2250 Put Option
LTP: ₹51.55
Breakeven (for understanding): ₹2,198.45
Notable Data Points:
Large open interest addition (+105,600 contracts / +47.5%)
Many traders appear to be expecting price to remain above 2250
Theta ~ -2.84/day → higher time decay benefits sellers in such positions
3️⃣ Observed Bullish Spread Structure – 2300 CE + 2400 CE
Leg 1: 2300 CE @ ₹64.05
Leg 2: 2400 CE @ ₹28.40 (short)
Net Cost (for study): ₹35.65
Maximum Risk: ₹6,238.75 (per lot)
Maximum Reward: ₹11,261.25 (per lot)
Breakeven Level: ₹2,335.65
Why:
Limits risk vs naked CE buy while keeping upside potential until 2400.
OI data supports bullish trend above 2300, resistance near 2400.
Lower IV on CE side helps spread entry.
Suitable for moderate upside with controlled risk.
📘 My Trading Setup Rules
Avoid Gap Plays
→ Check pre-open price action to avoid trades influenced by gap-ups/gap-downs.
Breakout Entry Only
→ Enter trades only if price breaks previous day’s High (for bullish trades) or Low (for bearish trades).
Watch Volume for Confirmation
→ Monitor volume closely. No volume = No trade.
Enter on Strong Candle + Volume
→ Execute the trade only if a strong candle appears with increasing volume in the direction of the trade.
Defined Risk:Reward Only
→ Take trades only if R:R is favorable (ideally ≥ 1:2).
Premium Disclaimer
→ Option premiums shown are based on EOD prices — real-time premiums may vary during execution.
Time Frame Preference
→ Trade with your preferred time frame — this strategy works across intraday or positional setups.
Disclaimer:
This analysis is for educational and informational purposes only and is not investment advice. The data presented is based on publicly available market information and represents a study of price action and option chain behaviour. Trading in securities/derivatives involves substantial risk, and past performance is not indicative of future results. Please consult your SEBI-registered investment advisor before making any investment or trading decisions.
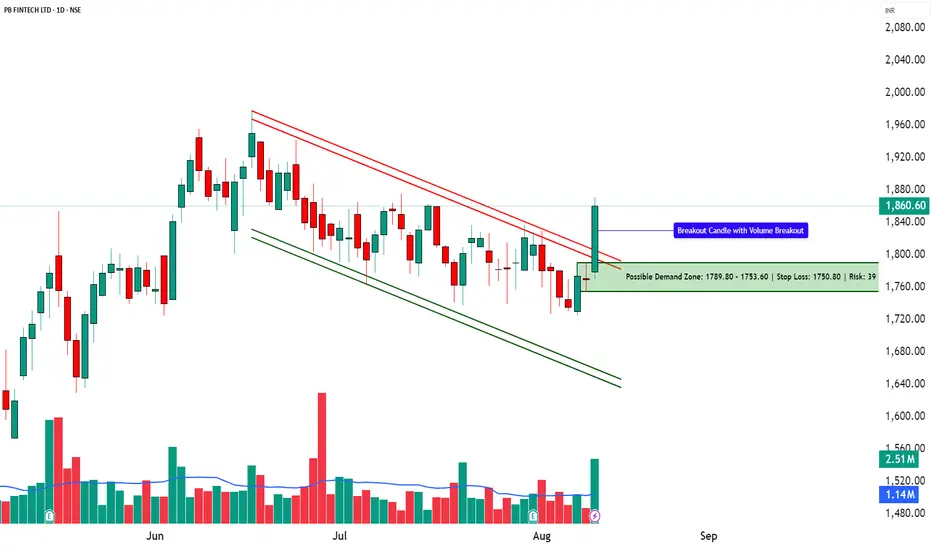
POLICYBZR – Technical & Fundamental Analysis | Channel Breakout📊 POLICYBZR – Technical & Fundamental Educational Snapshot
Ticker: NSE: POLICYBZR | Sector: Digital Insurance & Fintech
CMP: ₹1,860.60
Rating: ⭐⭐⭐ (Neutral to Moderately Bullish Setup – Educational Purposes Only)
Pattern Observed: 📈 Channel Breakout
________________________________________
POLICYBZR (CMP: ₹1,860.6) is exhibiting a Channel Breakout formation, supported by a strong bullish candle. The stock has moved from a bottom range of ₹1,558.4 towards the top range of ₹1,978, with key resistances placed at ₹1,898, ₹1,935, and ₹1,998, while supports are noted at ₹1,797, ₹1,733, and ₹1,696. Technical indicators show RSI at 59 (breakout zone), a bullish MACD crossover, CCI at 122, and Stochastic at 93, indicating strong upward momentum. The price action has also seen a Bollinger Band breakout and is trading above VWAP, suggesting bullish bias. Volume surged to 2.51M shares, significantly higher than the 20-day average of 1.14M, indicating institutional participation. Based on current momentum, there is a possibility of breakout continuation; however, traders should monitor support levels for any reversal signals.
As of early August 2025, PB Fintech’s insurance platform Policy Bazaar has been penalised ₹5 crore by the insurance regulator for certain regulatory lapses, leading to a short-term decline of around 2–3 percent in its share price. Despite this development, the company reported a 33 percent year-on-year increase in Q1 revenues, with net profit rising by 50 percent, supported by a 35 percent growth in core insurance premium collections to approximately ₹6,616 crore. In addition, its enterprise arm has introduced “ClaimSetu”, an AI-powered claims insights and scoring tool for group health insurance, aimed at streamlining documentation and potentially improving claim processing efficiency by up to 50 percent.
From an investment perspective, the outlook for PB Fintech (Policy Bazaar) remains mixed, with both upside potential and downside risks. On the bullish side, sustained revenue growth, rising profitability, and continued expansion in insurance premium collections reflect strong operational momentum. The introduction of AI-driven claim processing solutions could enhance efficiency and customer experience, potentially boosting market share over time. However, the bearish view factors in recent regulatory penalties, heightened compliance scrutiny, and the possibility of short-term sentiment pressure on the stock price. In the short term, price action may remain volatile as the market digests recent developments and broader market conditions. Over the long term, the company’s growth trajectory will depend on successful regulatory compliance, execution of technology-led initiatives, and maintaining a competitive edge in the digital insurance space.
________________________________________
📊 STWP Trade Analysis – Based on the STWP trade framework, a backtest-style example of a possible breakout setup could involve a long entry near ₹1,870.7 with a protective stop at ₹1,722.2. In similar past setups, price movements have reached zones such as ₹2,019 (approx. 1:1 risk–reward) and ₹2,168 (approx. 1:2 risk–reward).
A more conservative hypothetical example might involve an entry in the ₹1,870.70–₹1,860.60 zone, with a protective stop at ₹1,832.48 and potential upside zones at ₹1,945 and ₹2,001 — risk–reward will vary based on entry.
Additionally, a pullback scenario could be illustrated with a potential entry near ₹1,842.9, protective stop at ₹1,805.6, and upside zones aligned with resistance levels.
Possible Demand Zone (Illustrative): ₹1,789.80 – ₹1,753.60 with Stop Loss: ₹1,750.80
Approximate Risk: ₹39
________________________________________
⚠️ Risk Reminder:
Price volatility may increase due to regulatory factors, market sentiment, or broader index trends. Past chart patterns and backtests do not guarantee future performance.
________________________________________
⚠️ Disclaimer (Read Carefully)
This post is for educational and informational purposes only.
The author is not a SEBI-registered investment advisor. No buy or sell recommendations are being made.
All views are based on chart patterns, publicly available data, and personal learning experience.
Trading involves risk. Losses can exceed your investment. Always consult a SEBI-registered advisor before making financial decisions.
By engaging with this content, you agree to these terms.
________________________________________
💬 Found this useful?
Drop your thoughts, questions, or setups in the comments — let’s grow together!
🔁 Share this post with fellow traders and beginners to spread clean, structure-based learning.
✅ Follow simpletradewithpatience for beginner-friendly setups, price action insights, and disciplined trading content.
🚀 Stay Calm. Stay Clean. Trade With Patience.
Trade Smart | Learn Zones | Be Self-Reliant 📊
BLUE STAR LTD - Technical Analysis | Triangle Pattern ________________________________________
📊 BLUE STAR LTD – Beginner-Friendly Technical & Fundamental Snapshot
Ticker: NSE:BLUESTARCO | Sector: Consumer Durables
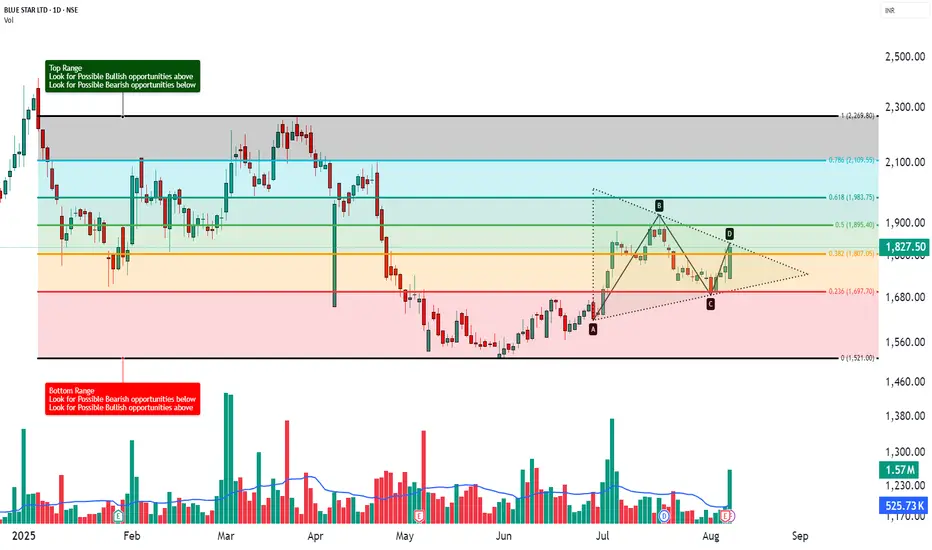
CMP: ₹1,827.50 ▲ (+3.23%) (as of August 7, 2025)
Chart Pattern: Symmetrical Triangle
Technical View: ⭐⭐⭐⭐ Neutral-to-Positive (Educational Purpose Only)
________________________________________
🔍 What’s Happening on the Chart?
BLUE STAR has formed a Symmetrical Triangle – a pattern where price moves within narrowing highs and lows 📉📈
This indicates consolidation and usually results in a strong breakout or breakdown.
📦 Triangle Range: ~₹1,616 to ₹1,922
👉 Current price is testing the upper edge — a breakout could be brewing!
________________________________________
🕯️ Candle & Indicator Analysis (Simplified)
Here’s what the chart and indicators show:
EMA 200 Crossover:
✅ Bullish signal – price is trading above its 200 EMA
RSI (~60):
🔼 Showing strength – not yet overbought
Stochastic (~92):
🚀 Near overbought – buyers in control
MACD:
⚠️ Still bearish – momentum confirmation is pending
VWAP:
✅ Aligned with bullish bias — suggests institutional support
📊 Volume Breakout:
🔺 Volume surged to 1.57 million, almost 3x the average of ~525.73k — a strong sign that big players may be stepping in as price nears breakout levels.
🧠 Trading Insight:
The chart looks bullish but still needs confirmation. Watch for a proper breakout above the triangle with volume.
________________________________________
📰 Recent News & Sentiment Update
Q1 FY26 Results (as of June 30, 2025):
📈 Total Income: ₹2,998.32 Cr (↑ 3.8% YoY)
💰 Net Profit: ₹122.23 Cr
(Source: Company Filings & Analyst Coverage)
Sentiment:
✅ Positive: Modest earnings growth, analyst support
⚠️ Caution: Target cut by some analysts — signals mixed expectations
________________________________________
🧭 Support & Resistance Levels
📌 Resistance Zones (Upside watch):
R1: ₹1,866
R2: ₹1,904
R3: ₹2,112 (measured move target)
📌 Support Zones (Downside watch):
S1: ₹1,750
S2: ₹1,680
S3: ₹1,616 (triangle base)
________________________________________
🔍 How to Trade a Symmetrical Triangle
A symmetrical triangle is a neutral pattern.
The breakout confirms direction:
– Above = potential upside 🟢
– Below = potential downside 🔴
📈 If Bullish Breakout Happens (above ₹1,860):
✅ Wait for a candle close above ₹1,860 with volume
🎯 Possible Price Zones: ₹2,000 → ₹2,165
🛑 Stop Loss: ₹1,750 (below triangle support)
📉 If Bearish Breakdown Happens (below ₹1,680):
✅ Wait for close below ₹1,680
🎯 Possible Price Zones: ₹1,500 → ₹1,375
🛑 Stop Loss: ₹1,750 (above triangle resistance)
________________________________________
🧠 STWP’s Educational Trade Idea (Not a Recommendation)
🎯 Long watch above: ₹1,839
🛑 Stop Loss: ₹1,719.50
📈 Risk-Reward Idea: Minimum 1:1; ideally aim for 1:2+
________________________________________
🔰 Trading Notes
✅ Always use stop losses
⏳ Be patient — wait for confirmation, not assumption
🚫 Don’t chase green candles or panic in red ones
📚 Trade based on structure, not emotions
💼 Risk only 1–2% of your capital per trade
🎯 Target minimum 1:1.5 Risk-to-Reward ratio
________________________________________
⚠️ Disclaimer (Read Carefully)
This post is for educational and informational purposes only.
The author is not a SEBI-registered investment advisor. No buy or sell recommendations are being made.
All views are based on chart patterns, publicly available data, and personal learning experience.
Trading involves risk. Losses can exceed your investment. Always consult a SEBI-registered advisor before making financial decisions.
By engaging with this content, you agree to these terms.
________________________________________
💬 Was this useful?
Drop your thoughts, questions, or setups in the comments below ⬇️ — let’s grow together!
🔁 Share this post with fellow traders and beginners to spread clean, structure-based learning.
✅ Follow simpletradewithpatience for beginner-friendly setups, price action insights, and disciplined trading content.
🚀 Stay Calm. Stay Clean. Trade With Patience.
Trade Smart | Learn Zones | Be Self-Reliant 📊
________________________________________
ASIAN PAINTS LTD – Technical Analysis________________________________________
🧠 ASIAN PAINTS LTD – Technical Analysis
Ticker: NSE:ASIANPAINT | Sector: Decorative & Industrial Coatings
CMP: 2,491 ▲ (+1.9%)
Chart Pattern: Symmetrical Triangle Breakout
Technical View: ⭐⭐⭐⭐ (Neutral-to-Positive Setup – Educational Purposes Only)
________________________________________
📈 Technical Overview (For Educational & Informational Purposes Only)
🔹 Pattern Observed:
Price action indicates a breakout from a symmetrical triangle pattern on the daily timeframe – a structure often linked to volatility contraction and potential directional movement. The stock breached the upper trendline near 2,467 with an uptick in volume, indicating possible buyer interest.
🔹 Supporting Indicators:
— MACD: Bullish crossover
— 200 EMA: Price reclaimed above the long-term average
— RSI: Reading near 66, indicating strengthening momentum
— Bollinger Bands: Price broke above upper band + BB squeeze
— SuperTrend: Bullish
— Open = Low: Potential buyer strength
🔹 Volume Context:
Volume during the breakout session was ~2.02M – higher than average, suggesting institutional participation or increased trader interest.
________________________________________
🔼 Resistance Levels (Reference Zones)
R1: 2,518
R2: 2,545
R3: 2,583
🔽 Support Levels (Reference Zones)
S1: 2,452
S2: 2,413
S3: 2,387
________________________________________
📰 News Summary & Sentiment Context (Neutral View)
📌 Earnings:
Q1 FY26 PAT declined ~6% YoY to 1,100 Cr. Revenue slightly lower YoY but largely in-line with expectations. Decorative segment volume grew ~4%, which helped cushion margin pressures.
📌 Demand Trends:
Urban & project-led demand showing signs of recovery. Rural demand is stable. Some macroeconomic caution warranted due to external factors (e.g., job market uncertainties).
📌 Regulatory Update:
The CCI has initiated a probe on alleged market dominance following a complaint. The company has contested the investigation citing procedural inconsistencies.
📌 Market Mood:
Despite regulatory concerns, post-earnings sentiment appears improved. The stock has risen ~5.2% YTD and has been among recent Nifty outperformers.
________________________________________
📚 Educational Insight for Traders & Learners
The symmetrical triangle is a common consolidation pattern formed by converging trendlines. It reflects a balance of power between buyers and sellers. A breakout (especially with volume) can signify renewed directional bias.
In this case, the stock broke out above the resistance trendline, backed by volume and confirmation from technical tools (RSI > 60, MACD, BB squeeze, etc.).
Such breakouts are monitored by traders for swing or positional opportunities, provided risk is managed and external catalysts (like earnings and macro sentiment) are factored in.
✅ Key Reminder: Technical setups should be combined with proper position sizing, exit plans, and broader market context.
________________________________________
🔍 Trade Setup (For Educational Simulation Only)
Trade Details
🔹 Long Entry: ₹2,505.60
🔹 Stop Loss (SL): ₹2,406.55
🔹 Risk-Reward Ratio: 1:1 | 1:2+
Pullback Trade Setup (Optional Re-Entry)
📍 Pullback Entry Zone: ₹2,491.20 – ₹2,505.60
📍 Protective Stop Zone: ₹2,465.87 – ₹2,453.60
📍 Risk-Reward Range: 1:1 | 1:2+
________________________________________
⚠️ Disclaimer (Please Read Carefully):
This content is shared strictly for educational and research purposes only.
I am not a SEBI-registered investment advisor, and no buy or sell recommendations are being made.
All views expressed are based on personal market analysis and experience. They are not intended as financial advice.
Trading — especially in derivatives like options — involves significant financial risk. Losses can exceed your initial investment.
👉 Always do your own research and consult a certified SEBI-registered advisor before making any investment or trading decisions.
👉 Use proper risk management and only trade with capital you can afford to lose.
The author assumes no responsibility or liability for any trading losses incurred from acting on this content.
By engaging with this material, you agree to these terms.
________________________________________
💬 Found this helpful?
Drop your thoughts, questions, or insights in the comments below ⬇️ — let’s learn together!
🔁 Share this post with your trading friends and community — help them discover clean charts, structured setups, and zone-based learning.
✅ Follow simpletradewithpatience for clear setups, educational content, and a no-nonsense approach to price action, supply-demand zones, and risk-managed trades.
🚀 Trade with patience. Trust your charts. Stay clear-headed.
Because the goal is not just to trade — it's to trade better.
Be Self-Reliant | Trade with Patience | Learn with Charts & Zones 📊

MAXHEALTH – Symmetrical Triangle Breakout________________________________________________________________________________
🧠 MAXHEALTH – Symmetrical Triangle Breakout
📌 Chart Overview
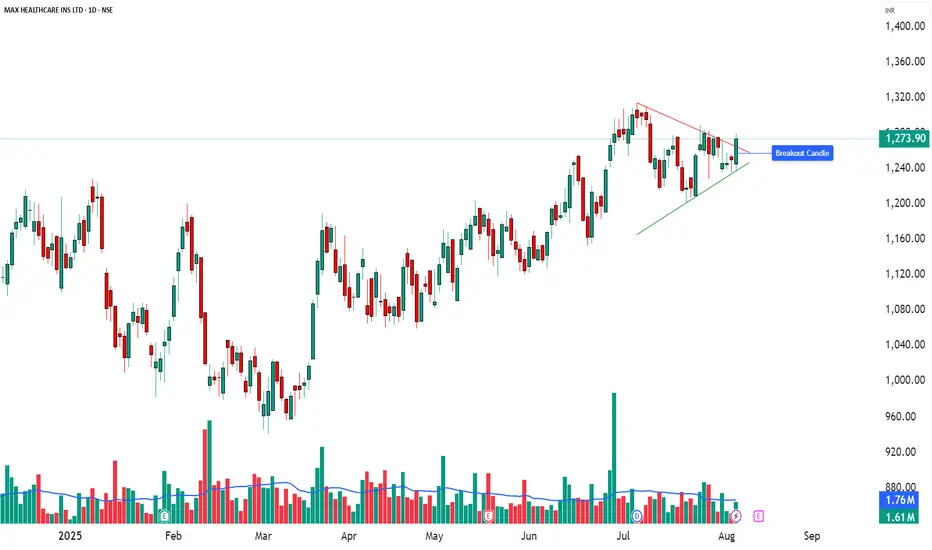
Symbol: `MAXHEALTH` (NSE)
Timeframe: 1D (Daily)
Pattern Identified: 🔺 Symmetrical Triangle
Breakout Confirmation: ✅ Bullish Engulfing
Volume on Breakout: 1.61M (above average)
________________________________________________________________________________
📊 Technical Breakdown (For Educational Use Only)
🔹 Between June and August, MAXHEALTH consolidated into a symmetrical triangle, a classic pattern suggesting price compression.
🔹 A bullish breakout occurred with a strong engulfing candle on above average volume — a potential early signal of trend continuation.
🔹 The breakout occurred near the apex of the triangle, increasing its validity.
💡 Such breakouts are commonly followed by retests or follow through moves. This post is intended to help learners spot and study such setups.
________________________________________________________________________________
📌 Key Reference Levels (Not Trade Levels)
As per the current chart structure, key reference levels for MAXHEALTH include resistance zones at ₹1,290.1, ₹1,306.3, and ₹1,332.6, which may act as potential supply areas in case of continued upward momentum. On the downside, important support zones are observed near ₹1,247.6, ₹1,221.3, and ₹1,205.1, where price could find buying interest if a pullback occurs. These levels are shared purely for technical context and educational study, not as trade recommendations.
________________________________________________________________________________
🧠 Learning Takeaways
✅ Symmetrical Triangle: Indicates indecision and tightening price range. Breakout direction often sets near term tone.
✅ Bullish Engulfing Candle: A strong reversal pattern when formed post consolidation or at trendline breaks.
✅ Volume Confirmation: Adds credibility to breakout strength — look for rising volume on breakouts.
🔍 Always watch for follow up candles, possible pullbacks (retest entries), or invalidation zones to study trade structure in real world setups.
________________________________________________________________________________
⚠️ Disclaimer & Educational Note
This content is strictly for educational and research purposes only. I am not a SEBI-registered advisor, and no buy/sell recommendations are being provided. All insights are based on personal analysis and experience and are not financial advice.
📘 This setup illustrates how combining price action (candlesticks), support/resistance zones, volume, and indicators like RSI or MACD can help build conviction in trades. However, trading—especially in derivatives like options—involves high risk, and losses can exceed the initial investment.
👉 Always do your own research and consult a SEBI-registered advisor before taking any position.
👉 Use strict risk management and only trade with capital you can afford to lose.
The author assumes no liability for any losses incurred.
By engaging with this content, you agree to these terms.
________________________________________________________________________________
💬 Found this helpful?
Drop your thoughts, questions, or insights in the comments below ⬇️ — let’s learn together!
🔁 Share this post with your trading friends and community — help them discover clean charts, structured setups, and zone-based learning.
✅ Follow simpletradewithpatience for clear setups, educational content, and a no-nonsense approach to price action, supply-demand zones, and risk-managed trades.
🚀 Trade with patience. Trust your charts. Stay clear-headed.
Because the goal is not just to trade — it's to trade better.
Be Self-Reliant | Trade with Patience | Learn with Charts & Zones 📊
KAYNES TECHNOLOGY IND LTD – Technical Analysis________________________________________
🧠 KAYNES TECHNOLOGY IND LTD – Technical Analysis
Ticker: NSE:KAYNES | Sector: EMS & Semiconductors
Current Price: 6,172.00 ▲ (+9.5% on July 31, 2025)
Technical View: ⭐⭐⭐⭐ | Chart Pattern: Falling Wedge Breakout
________________________________________
📈 Technical Overview
🔹 Chart Pattern Formed: Falling Wedge Breakout with extremely high volume confirmation
🔹 Breakout Zone: 6,000–6,050
🔹 Momentum Signals:
— RSI breakout above 60
— Strong bullish candle with rising volume
— VWAP and SuperTrend aligned bullish
🔹 Support Trendline Held on multiple touchpoints
🔹 Breakout Candle marked by heavy institutional volume
________________________________________
📰 Key Fundamental Developments
✅ Q1 FY26 PAT up ~50% YoY to 74.6 Cr
✅ Gross margin expanded to 41%, EBITDA margin to 16.8%
✅ Strategic acquisitions from Fujitsu (85 Cr domestic + 118 Cr JV with L&T)
✅ Strong order book visibility (~7,400 Cr)
✅ Raised 1,600 Cr via QIP to fund growth
________________________________________
📊 Sentiment Analysis
Sentiment: ✅ Positive
— Strong earnings beat and margin expansion
— Global expansion through Fujitsu JV
— Bullish commentary from major brokerages
— Institutional confidence via QIP and upgrades
________________________________________
🔼 Resistance Levels
6,400 – Immediate breakout target
6,834 – Top of consolidation range
7,285 – Medium-term resistance (historic supply zone)
🔽 Support Levels
5,970 – Breakout retest zone
5,700 – Structure base
5,170 / 4,864 – Deep support for longer-term invalidation
________________________________________
📌 What’s Catching Our Eye
🔹 Volume spike confirms genuine breakout
🔹 RSI, SuperTrend, VWAP – all flashing bullish
🔹 Back-to-back bullish closes after a 10 day contraction breakout
🔹 Volume & price action aligned across multiple timeframes
________________________________________
👀 What We’re Watching For
🔸 Follow-through momentum toward 6,400+
🔸 Whether breakout holds above 5,970 in coming sessions
🔸 Semiconductor line execution progress
🔸 Margin trends in upcoming quarters
________________________________________
⚠️ Risks to Monitor
⚠️ Rich valuations (~130x P/E) – limited room for disappointment
⚠️ Execution risk on new lines and acquisitions
⚠️ Global slowdown in electronics & macro headwinds
⚠️ Any delay in semiconductor segment scale-up
________________________________________
🔮 What to Expect Next
🔹 Retest of breakout zone (~6,000–6,050) possible
🔹 If held, expect momentum toward 6,400–6,800
🔹 Sideways consolidation likely if volumes taper
🔹 Strong close above 6,400 could initiate fresh uptrend leg
________________________________________
📈 Strategy Insight (For Educational Purposes Only)
— Aggressive Traders: Watch level of 6284
— Momentum Traders: Watch 6,050 retest for low-risk entry
— Risk Management: Position sizing + Capital risk – as per individual preference
________________________________________
💬 Why It’s On Our Watchlist
Kaynes blends EMS scale with high-margin ODM design and semiconductor upside. Rare in India’s listed space. Strong revenue visibility, global expansions, and balance sheet strength make it a high-conviction long-term story.
________________________________________
📉 If Price Comes Down…
5,700–5,800 is a critical support zone. Breakdown below this with volume = trend weakness. 5,400 is final demand zone before structural damage.
________________________________________
🪙 Educational Insight for Learners
This chart is a real-world example of a falling wedge breakout confirmed by volume. The key takeaway: price alone is not enough—watch volume, RSI, and structure. Never chase momentum without a plan. Always pair conviction with discipline.
________________________________________
🚨 Reminder: No stock is a “sure thing.” Use proper risk management. Stay rational when others get emotional.
________________________________________
⚠️ Disclaimer (Please Read Carefully):
This content is shared strictly for educational and research purposes only.
I am not a SEBI-registered investment advisor, and no buy or sell recommendations are being made.
All views expressed are based on personal market analysis and experience. They are not intended as financial advice.
Trading — especially in derivatives like options — involves significant financial risk. Losses can exceed your initial investment.
👉 Always do your own research and consult a certified SEBI-registered advisor before making any investment or trading decisions.
👉 Use proper risk management and only trade with capital you can afford to lose.
The author assumes no responsibility or liability for any trading losses incurred from acting on this content.
By engaging with this material, you agree to these terms.
________________________________________
💬 Found this helpful?
Drop your thoughts, questions, or insights in the comments below ⬇️ — let’s learn together!
🔁 Share this post with your trading friends and community — help them discover clean charts, structured setups, and zone-based learning.
✅ Follow simpletradewithpatience for clear setups, educational content, and a no-nonsense approach to price action, supply-demand zones, and risk-managed trades.
🚀 Trade with patience. Trust your charts. Stay clear-headed.
Because the goal is not just to trade — it's to trade better.
Be Self-Reliant | Trade with Patience | Learn with Charts & Zones 📊
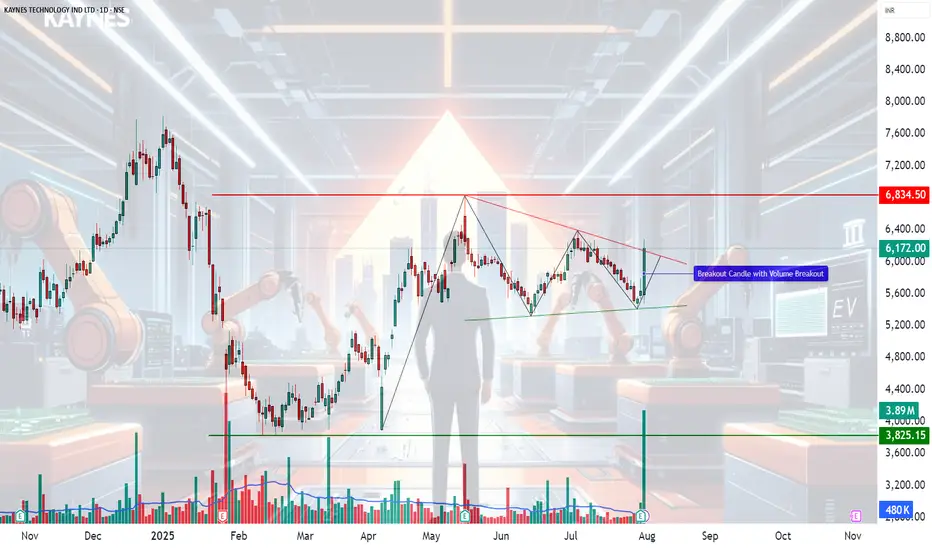
DMART – A Clean Case Study in Patience & Price Action________________________________________
Ticker: NSE: DMART
Sector: Retail – Supermarkets & Hypermarkets
Market Cap: ≈ ₹2.78 lakh crore (approx as of July 30, 2025)
Current Price: ₹4,281.40 (up ~7% on July 30, 2025)
Technical Rating: ⭐⭐⭐⭐⭐
________________________________________
📢 DMart (Avenue Supermarts) Update – July 30, 2025:
If you’re a new investor tracking India’s retail space, DMart just gave us a masterclass in how market sentiment can flip fast — and why fundamentals still matter.
In its Q1 FY26 results, DMart reported a modest 2% profit growth (₹830 cr), despite a solid 16% jump in revenue. This raised concerns among analysts about tight margins and intensifying competition, especially from fast-moving consumer goods (FMCG) and quick-commerce players. Not surprisingly, the stock dipped around 2.6% post-results.
But fast-forward to late July, and the narrative flipped.
On July 30, DMart shares surged 7–8% intraday, marking their biggest rally since March, after announcing the opening of its 426th store and laying out a bold expansion plan. The market cheered the company’s strong growth visibility and confidence in its value-retail model. CEO Neville Noronha emphasized the importance of store additions, digital scaling via DMart Ready, and the company’s resilience in a competitive landscape.
On the digital front, online grocery sales grew 21% YoY to ₹3,502 cr in FY25 — a good sign of consumer shift — though losses widened as DMart expanded into new cities.
What’s the takeaway? For learners, this is a great example of how stocks don’t move just on earnings, but on future guidance, strategy, and investor confidence. DMart may not have wowed with profits this quarter, but its long-term vision still packs a punch.
________________________________________
📉 Technical Analysis | Chart Pattern: Potential Breakout Brewing:
DMART has been consolidating in a symmetrical triangle pattern on the daily chart since April 2025 — a classic setup that often signals a big move ahead. On July 30, the stock showed signs of life with a strong 7% gain and a 5× volume spike, which usually reflects institutional accumulation and rising trader interest.
🔍 But here’s the key insight:
Despite the surge in volume, the price has not yet convincingly broken above the triangle’s upper trendline. This means there’s no valid price breakout yet — only a volume-based alert. For newer traders, this is a great example of why volume alone isn't enough. A true breakout needs a strong candle closing above the pattern, preferably with follow-through buying.
________________________________________
🔼 Key Resistance Levels to Watch:
₹4,403 – Recent swing high and immediate target if breakout confirms
₹4,526 – April top and near-term bullish milestone
₹4,728 – Long-term resistance if momentum builds up post-breakout
🔽 Important Support Levels:
₹4,078 – Breakout support zone and first pullback entry area
₹3,876 – Base of the triangle, also a structural support
₹3,753 – Deeper support, invalidation point if breached
________________________________________
🧭 Strategy Insight for New Traders:
This is a textbook case of a "breakout watchlist" setup. With strong bullish indicators — RSI > 60, MACD crossover, Supertrend flip, and a BB Squeeze breakout setup — the chart is preparing for a move. But confirmation is key.
✅ Wait for a clear breakout above the trendline with sustained volume
✅ Avoid chasing the move too early — breakout traps are common
✅ If the breakout confirms, ₹4,403 and ₹4,526 become logical targets
✅ A retest toward ₹4,080 could offer a low-risk long entry if supported by volume
________________________________________
🧠 Pro Note for Beginners: A breakout isn’t just about price jumping — it’s about structure, confirmation, and follow-through. Think of volume spikes as the "whispers" before the market makes a bold statement.
________________________________________
🔍 Fundamental Analysis:
If you’re just starting out in stock market investing, DMART offers an interesting case study—a well-run retail company with strong fundamentals and a clear growth story. As of July 2025, DMART has shown solid performance, especially in revenue growth, while keeping debt levels incredibly low.
In Q1 FY26, the company posted standalone revenues of ₹15,932 crore—up 16.2% YoY—highlighting strong consumer demand and steady growth momentum. Over the full FY25, consolidated revenue rose nearly 17% YoY, reflecting DMART’s consistent top-line performance. However, while revenues are rising fast, margins have seen slight compression. PAT (net profit) for FY25 stood at ₹2,707 crore with a PAT margin of 4.6%, down from 5% a year earlier.
DMART’s earnings per share (EPS) is growing steadily too—₹41.61 in FY25, up ~7% from last year. But with a price-to-earnings (P/E) ratio of ~96x, the stock trades at a steep premium compared to peers, signaling that the market has high expectations for its future growth.
One of DMART’s biggest strengths is its minimal debt—the company operates with almost zero leverage, giving it exceptional financial flexibility. It also generates healthy free cash flows from its core retail operations, though its online grocery venture (DMart Ready) is still in the investment phase, posting losses as it expands.
From a valuation standpoint, DMART is expensive, no doubt. But investors are paying for its scalability, low-risk model, and disciplined management. With 415 stores across India and consistent quarterly additions, the company continues to grow organically while maintaining a lean balance sheet.
🔔 Bottom Line for Beginners: DMART is a financially strong and well-managed company with proven business fundamentals. But with a very high valuation and slowing profit growth, new investors should be cautious. It may be wise to watch for better entry points or wait for earnings to catch up with the price. For long-term investors with patience and a high-quality bias, it could still be a worthy contender—especially if margins and digital growth improve.
________________________________________
📈 DMART Chart Study – Educational Swing Trade Example:
Disclaimer: This is an educational post intended to help new traders understand breakout setups. This is not a recommendation to buy, sell, or hold any stock or security. Always consult your registered financial advisor before making any trading decisions.
If you're learning how swing trades work, this DMART daily chart setup from July 30, 2025, offers a great example of how price action, volume, and key levels can come together. It’s a practical case study to understand the breakout trading concept.
________________________________________
🛠️ Trade Structure (For Educational Purposes)
Reference Entry Price: ₹4,324.00
Reference Stop Loss: ₹3,925.85
Risk-Reward Scenario: Approx. 1:1, with potential extension to 1:2+ (based on hypothetical higher target)
________________________________________
🔍 Key Chart Observations:
✅ Breakout Candle Formation: A strong bullish candle closed near its high — a typical sign of price strength.
✅ Volume Confirmation: Volume surged to 3.39 million shares, which is over 4× the daily average — often seen in breakout moves.
✅ Price Range Context:
• Support/Base Zone: Around ₹3,340
• Initial Target Zone: ₹4,557.70
________________________________________
📘 Educational Insights:
🔴 Risk-Reward Perspective: At the observed entry level, the risk-to-reward ratio was near 1:1 — not ideal for most strategies. A more efficient trade setup might occur on a pullback or with a more distant target.
🔄 Retest Possibility: If the price retraces to ₹4,150–₹4,200 with lower volume, that zone could serve as a reference for learners exploring re-entry setups (purely for study).
🧠 Capital Risk Planning: Risk management is crucial. Avoid risking more than 2–3% of total trading capital on any single idea, no matter how strong the pattern looks.
________________________________________
📌 Beginner Learning Point:
Breakout trading is more than just chasing big candles. A proper breakout setup usually involves volume surge, clear consolidation range, and defined risk management. Learning to combine these elements is key to developing trading discipline.
________________________________________
🧾 Why I’m Watching DMART — A STWP Perspective for Beginner Investors:
One of the best lessons I’ve learned in my investing journey is this: It’s better to buy a great business at a fair price than a fair business at a great price. And when I look at DMART (Avenue Supermarts Ltd.), I see the foundation of a truly great business — even if the price isn’t quite right just yet.
________________________________________
🛒 A Business Anyone Can Understand:
DMART isn’t chasing trends or building flashy tech. It’s focused on something much simpler — and far more reliable: selling everyday essentials. Groceries, home goods, basics — the things people need no matter what. And they do it efficiently, consistently, and affordably. That simplicity, when executed well, is a major strength.
________________________________________
🧱 A Strong, Repeatable Model:
What really impresses me is their cost discipline. DMART owns many of its stores, keeping rental costs low. They avoid unnecessary frills and instead focus on efficiency and tight operations. The result? A cost advantage that’s tough for others to beat. Even though retail has thin margins, DMART’s model is scalable, profitable, and built for the long haul.
________________________________________
👨💼 Led by a Trusted Name:
The company is backed by Radhakishan Damani — a man known for his patience, clarity, and capital discipline. He’s not in a rush to make headlines. He’s building something durable. And when you find great leadership combined with a focused business model, that’s a rare combo worth watching.
________________________________________
📉 Why This Stock Is on My Watchlist?
In one word: Valuation.
DMART often trades at 80–100 times earnings — which is expensive, even for a wonderful business. As an investor, I’d rather wait for a better deal than rush in and overpay. Great businesses can still turn into poor investments if you don’t get the price right. So for now, I’m staying patient.
________________________________________
📈 If the Price Comes Down…
If the market turns pessimistic or earnings grow into the valuation, DMART will be high on my buy list. Here’s why:
✅ A clean, debt-light balance sheet
✅ A brand people trust
✅ A scalable, cost-efficient model
✅ A long growth runway in India’s retail sector
✅ And thoughtful, no-drama leadership
________________________________________
🪙 Final Thought for New Investors:
As Warren Buffett says, “Time is the friend of the wonderful company and the enemy of the mediocre.”
DMART, in my view, is a wonderful company. I’d love to own it — but only when the price is right. Until then, I’ll keep watching, learning, and staying patient.
(Of course, one could consider buying a small quantity now and adding more on dips — a strategy that balances quality with prudence.)
________________________________________
⚠️ Disclaimer (Please Read Carefully):
This content is shared strictly for educational and research purposes only.
I am not a SEBI-registered investment advisor, and no buy or sell recommendations are being made.
All views expressed are based on personal market analysis and experience. They are not intended as financial advice.
Trading — especially in derivatives like options — involves significant financial risk. Losses can exceed your initial investment.
👉 Always do your own research and consult a certified SEBI-registered advisor before making any investment or trading decisions.
👉 Use proper risk management and only trade with capital you can afford to lose.
The author assumes no responsibility or liability for any trading losses incurred from acting on this content.
By engaging with this material, you agree to these terms.
________________________________________
💬 Found this helpful?
Drop your thoughts, questions, or insights in the comments below ⬇️ — let’s learn together!
🔁 Share this post with your trading friends and community — help them discover clean charts, structured setups, and zone-based learning.
✅ Follow @simpletradewithpatience for clear setups, educational content, and a no-nonsense approach to price action, supply-demand zones, and risk-managed trades.
🚀 Trade with patience. Trust your charts. Stay clear-headed.
Because the goal is not just to trade — it's to trade better.
Be Self-Reliant | Trade with Patience | Learn with Charts & Zones 📊
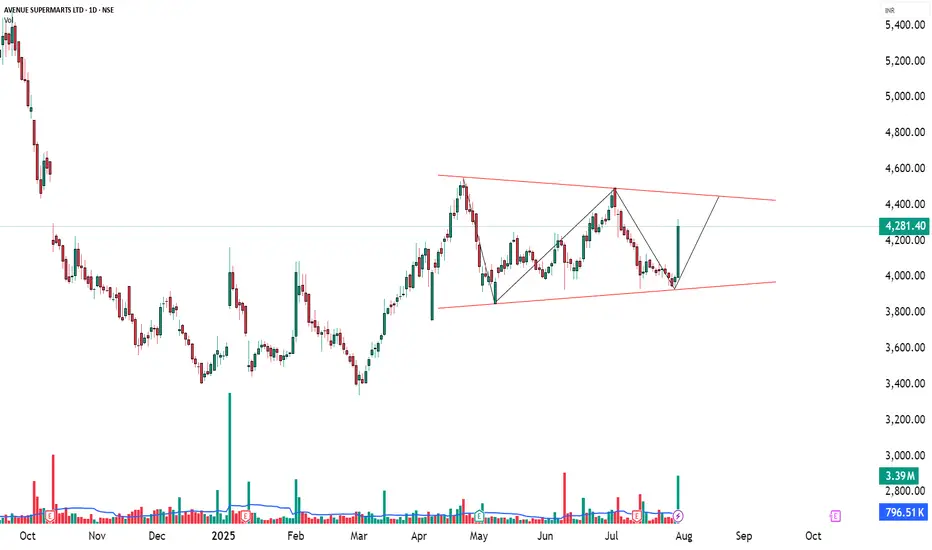
HDFCAMC – Bullish Momentum with Short Covering Base________________________________________________________________________________📈 HDFCAMC – Bullish Momentum with Short Covering Base
📅 Setup Date: 18.07.2025 | ⏱ Timeframe: Daily
📍 Strategy: Momentum Trade Setup with Defined Risk
________________________________________________________________________________
🔍 Overall View
Spot Price: ₹5590
Trend: Bullish Bias – Price sustaining above 5500 with momentum
Volatility: IV ~26–29%, relatively stable with mild contraction
Ideal Strategy Mix: Directional long with partial risk spreads
________________________________________________________________________________
1️⃣ Bullish Trade (Naked options as per trend)
Best CE: Buy 5700 CE @ ₹60.75
Why:
• Long Build-Up (+11.91% OI) with price ↑6.49% = bullish conviction
• Strike just ₹110 above spot → good balance of delta (0.41) and premium
• High TTV (₹89.9 Cr) and stable IV (~26.6%) → institutional activity
• CE 5600 also active, but 5700 is cleaner structure due to fresh longs
________________________________________________________________________________
2️⃣ Bearish Trade (Contrarian Trade – if present)
Best PE: Sell 5500 PE @ ₹59.5
Why:
• Short Build-Up on 5500 PE (+118.7% OI), but price ↓45.84% → strong put writing
• Spot comfortably above strike (₹5590), adding margin of safety
• IV stable → theta decay benefits seller
• Acts as support-level hold strategy in case of mild retracement
________________________________________________________________________________
3️⃣ Strategy Trade (As per trend + OI data)
Strategy: Bull Call Spread → Buy 5700 CE / Sell 5800 CE
→ ₹60.75 / ₹34.15
Net Debit: ₹26.60
Max Profit: ₹100 (spread width) – ₹26.60 = ₹73.40
Max Loss: ₹26.60
Risk:Reward ≈ 1 : 2.75 ✅
Lot Size: 150
Total Risk: ₹3,990
Max Profit: ₹11,010
📊 Breakeven Point: ₹5726.60
📉 Reversal Exit Level: Exit if Spot < ₹5550 (invalidates breakout + weakens CE 5700)
________________________________________________________________________________
Why:
• Strong Long Build-Up at 5700 CE, resistance only mild at 5800
• High IVs make selling 5800 CE favourable → lowers net debit
• Defined risk with RR ≈ 1:2.75 fits your trade rule
• Market supports bullish continuation over 5600-5650 levels
________________________________________________________________________________
📘 My Trading Setup Rules
Avoid Gap Plays
→ Check pre-open price action to avoid trades influenced by gap-ups/gap-downs.
Breakout Entry Only
→ Enter trades only if price breaks previous day’s High (for bullish trades) or Low (for bearish trades).
Watch Volume for Confirmation
→ Monitor volume closely. No volume = No trade.
Enter on Strong Candle + Volume
→ Execute the trade only if a strong candle appears with increasing volume in the direction of the trade.
Defined Risk:Reward Only
→ Take trades only if R:R is favourable (ideally ≥ 1:2)(safe = 1:1).
Premium Disclaimer
→ Option premiums shown are based on EOD prices — real-time premiums may vary during execution.
Time Frame Preference
→ Trade with your preferred time frame — this strategy works across intraday or positional setups.
________________________________________________________________________________
⚠ Disclaimer (Please Read):
• These Trades are shared for educational purposes only and is not investment advice.
• I am not a SEBI-registered advisor.
• The information provided here is based on personal market observation.
• No buy/sell recommendations are being made.
• Please do your own research or consult a registered financial advisor before making any trading decisions.
• Trading involves risk. Always use proper risk management.
I am not responsible for trading decisions based on this post.
________________________________________________________________________________
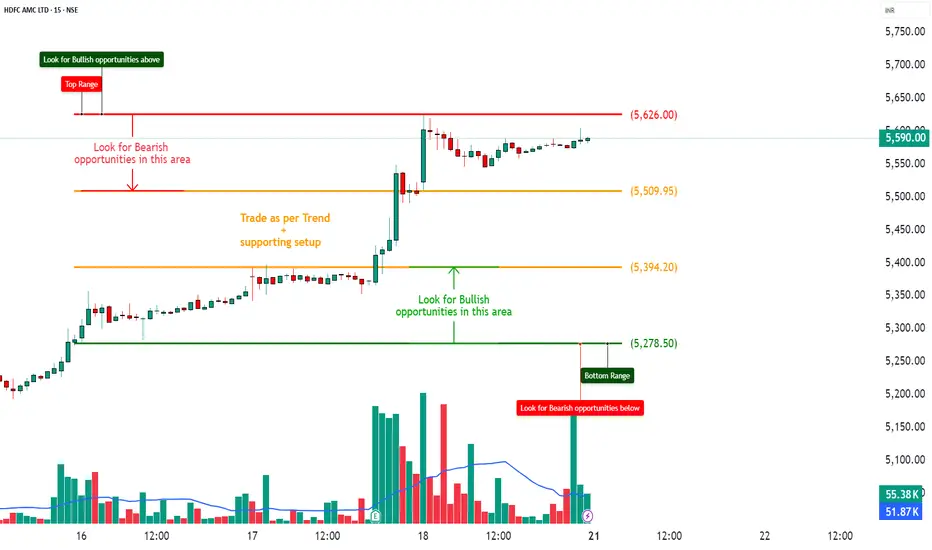
Psychology Is 80% of Trading Success But Most Traders Ignore ItPsychology Is 80% of Trading Success – But Most Traders Ignore It
“Have you ever entered a perfect trade… and still lost?”
Right direction.
Clear technical setup.
Trend confirmation was there.
Yet you closed early.
Or held a losing trade too long.
Or jumped back in out of revenge after a loss.
It wasn’t your system’s fault.
It was your psychology.
💡 Most traders don’t fail because of bad analysis – they fail because of poor emotional control
Let’s walk through some common real-life situations every trader has experienced at least once:
🎯 1. You closed your trade early – afraid the market might reverse
Case study:
A trader entered a long position on XAUUSD at a support zone (2360), aiming for TP at 2375.
But when price reached 2366, he closed out early – afraid to “lose profits.”
The market later hit his original TP perfectly.
➡️ This is classic loss aversion – the fear of losing what you’ve already gained.
🎯 2. You refused to cut a loss – hoping the price would come back
Case study:
A trader shorted EURUSD expecting a pullback, but price broke resistance and continued up.
Instead of cutting the loss, he widened his stop loss, holding onto hope.
The result? A bigger loss than planned.
➡️ This is denial – a refusal to accept you’re wrong, leading to emotional attachment to the trade.
🎯 3. You increased your position size after a winning streak
Case study:
After two strong wins, a trader feels confident and increases position size on the next trade…
Even though the setup isn’t as strong.
That trade ends in a loss – wiping out earlier profits.
➡️ This is overconfidence bias – a dangerous psychological state after wins.
📊 Technical skills only account for 20% – the remaining 80% is mastering yourself
You might:
Understand price structure
Use advanced indicators
Follow a solid trading system
But if you:
Break your stop loss rules
Scale up recklessly
Enter trades impulsively
Then your edge vanishes.
Success becomes inconsistent.
🧠 5 Practical Ways to Strengthen Your Trading Psychology
✅ Keep a trading journal – especially track your emotions
Ask: “Did I follow my plan? Or was I trading to ‘feel better’?”
✅ Never change SL or TP mid-trade
Stick to your original plan. Discipline builds consistency.
✅ Use demo accounts to train discipline, not to prove profitability
Treat each demo trade as if real money is at stake.
✅ Set mandatory “cool-off” periods after consecutive losses
For example: 2 losses = no trades for 24 hours.
✅ Practice waiting – patience is your most underrated tool
Pro traders often wait days for a valid setup. That’s not inactivity – that’s control.
🔁 Trading is not a search for the perfect system – it’s a journey of mastering your own mind
A strategy with only 55% win rate can still be highly profitable
…if paired with discipline, risk management, and emotional control.
But…
A system with 70% accuracy can still blow your account
…if your psychology breaks down under pressure.
🎯 Final Thoughts:
The financial markets reward those who can control themselves – not just those who analyze well.
You don’t need to be smarter than others.
You don’t need to master 10 indicators.
But you must be able to stay calm, act rationally, and follow your rules.
Knowledge lets you see the opportunity – but psychology determines if you survive it.

BALKRISIND – Zone Based Price Action Setup________________________________________________________________________________
📈 BALKRISIND – Zone Based Price Action Setup
🕒 Chart Type: 15-Min | 🗓 Date: 17th July 2025
🔍 Easy-to-Understand Setup for New Traders
________________________________________________________________________________
🚦 Key Zones to Watch
🔴 Top Range (Resistance) – 2779.00
🟠 Mid-Level Zones – 2730.30 | 2681.75
🟢 Bottom Range (Support) – 2633.20
________________________________________________________________________________
💡 What’s Happening on the Chart?
✅ Strong Up-Move seen from the support zone 📈
✅ Price is now consolidating below a tested Supply Zone (2779 - 2758)
✅ Volume spike shows interest near breakout
✅ A clean structure for price action-based planning 🔍
________________________________________________________________________________
🎯 How to Plan Trades (Educational Purpose Only):
🔼 Best Buy Setup:
• Entry: Above 2779 (Breakout signs)
• SL: Below 2730
• Target: R:R 1:1 | 1:2 +
• Reason: Trend continuation + price holding above key levels
🔽 Best Sell Setup:
• Entry: Near 2775–2780 (Supply Zone)
• SL: 2781.30
• Target: R:R 1:1 | 1:2 +
• Reason: Strong supply zone tested + limited upside + defined risk
________________________________________________________________________________
🧠 Simple Learning Points:
• ✅ Trade with the trend until price reaches an opposing zone
• 🧱 Use zones (not random entries) for planning
• 📉 If price enters Supply → look for bearish signs
• 📈 If price pulls back to Demand → look for bullish setups
________________________________________________________________________________
📦 Zone Markings for Reference:
• 🔴 Supply Zone: 2779 – 2758.20
⚠ Disclaimer (Please Read):
• These Trades are shared for educational purposes only and is not investment advice.
• I am not a SEBI-registered advisor.
• The information provided here is based on personal market observation.
• No buy/sell recommendations are being made.
• Please do your own research or consult a registered financial advisor before making any trading decisions.
• Trading involves risk. Always use proper risk management.
I am not responsible for trading decisions based on this post.
________________________________________________________________________________
💬 Found this helpful?
Drop your thoughts or questions in the comments below ⬇️
🔁 Share this post with your trading community – let them benefit from clean charts, structured setups, and zone-based learning.
✅ Follow simpletradewithpatience for charts, clean setups, and educational content based on price action, zones, and risk-managed trades.
🚀 Trade with patience, trust your charts, and stay clear-headed!
Be Self-Reliant | Trade with Patience | Learn with Charts & Zones 📊
________________________________________________________________________________
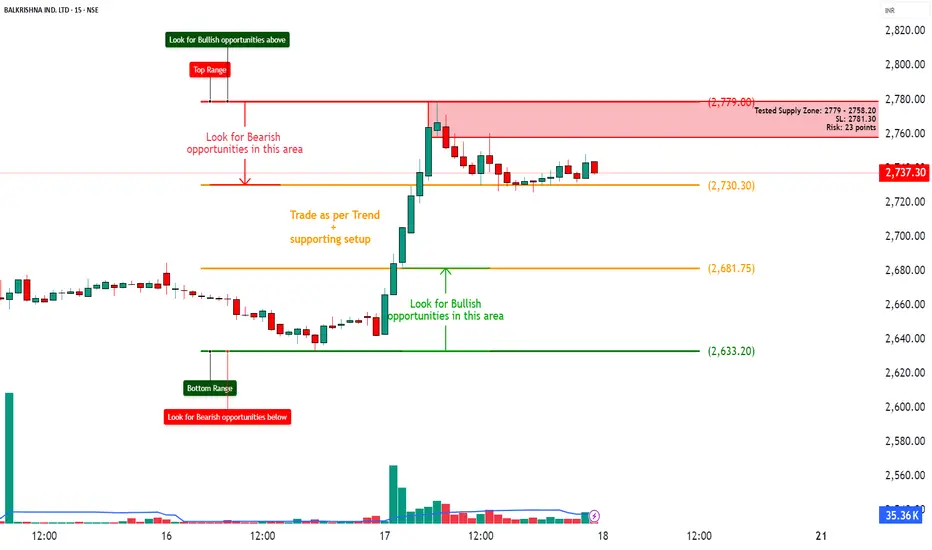
KEI – Bullish Continuation Setup with Breakout Potential________________________________________________________________________________
🚀 KEI – Bullish Continuation Setup with Breakout Potential
📅 Setup Date: 18.07.2025 | ⏱ Timeframe: Daily
📍 Strategy: Defined-Risk Bullish Spread (Short-Term Swing with OI Confirmation)
________________________________________________________________________________
🔍 Overview
Overall Bias: Bullish with supportive Put buildup
Spot Price: ₹3933.3
Trend: Sustained uptrend with OI buildup on CE/PE sides
Volatility (IV): 40–42%, stable with light compression
Ideal Strategy Mix: Defined-risk bullish strategy like vertical call spread
________________________________________________________________________________
1️⃣ Bullish Trade (Naked options as per trend)
Best CE: Buy 3900 CE @ ₹145.05
Why:
• Highest OI among CEs (7.05L) with strong Long Buildup
• Good volume and premium correction (▼16.32%) = cheaper entry
• Spot just above strike → early breakout zone
• Stable IV (40.34) gives clean delta tracking
________________________________________________________________________________
2️⃣ Bearish Trade (Naked options as per trend)
Best PE: Sell 3850 PE @ ₹82.65
Why:
• Long Buildup (OI ↑10.3%) on PE shows bullish support
• Strike sits just below spot → safety buffer
• IV stable and theta erosion beneficial
• Rich premium for selling with bullish bias intact
________________________________________________________________________________
⚙️ 3️⃣ Strategy Trade (As per trend + OI data)
Strategy: Bull Call Spread → Buy 3900 CE / Sell 4100 CE
Net Debit: ₹145.05 - ₹62.35 = ₹82.70
Max Profit: ₹200 - ₹82.70 = ₹117.30
Max Loss: ₹82.70
Risk:Reward ≈ 1 : 1.42 ✅ Within range
Lot Size: 175
Total Risk: ₹14,472.50
Max Profit: ₹20,527.50
Breakeven Point: ₹3982.70
Reversal Exit Level: Exit if Spot < ₹3879.32 (bullish spread invalidation below support)
________________________________________________________________________________
Why:
• Strong Long Buildup on 3900 CE and 4100 PE creates clean structure
• Risk:Reward = 1:1.42 fits strategy filters
• IV cooling supports call spread entry
• Breakout continuation likely with defined risk
________________________________________________________________________________
📘 My Trading Setup Rules
Avoid Gap Plays
→ Check pre-open price action to avoid trades influenced by gap-ups/gap-downs.
Breakout Entry Only
→ Enter trades only if price breaks previous day’s High (for bullish trades) or Low (for bearish trades).
Watch Volume for Confirmation
→ Monitor volume closely. No volume = No trade.
Enter on Strong Candle + Volume
→ Execute the trade only if a strong candle appears with increasing volume in the direction of the trade.
Defined Risk:Reward Only
→ Take trades only if R:R is favorable (ideally ≥ 1:2).(Safe R:R – 1:1)
Premium Disclaimer
→ Option premiums shown are based on EOD prices — real-time premiums may vary during execution.
Time Frame Preference
→ Trade with your preferred time frame — this strategy works across intraday or positional setups.
________________________________________________________________________________
⚠ Disclaimer (Please Read):
• These Trades are shared for educational purposes only and is not investment advice.
• I am not a SEBI-registered advisor.
• The information provided here is based on personal market observation.
• No buy/sell recommendations are being made.
• Please do your own research or consult a registered financial advisor before making any trading decisions.
• Trading involves risk. Always use proper risk management.
I am not responsible for trading decisions based on this post.
________________________________________________________________________________
💬 Found this helpful?
Drop your thoughts or questions in the comments below ⬇️
🔁 Share this post with your trading community – let them benefit from clean charts, structured setups, and zone-based learning.
✅ Follow simpletradewithpatience for charts, clean setups, and educational content based on price action, zones, and risk-managed trades.
🚀 Trade with patience, trust your charts, and stay clear-headed!
Be Self-Reliant | Trade with Patience | Learn with Charts & Zones 📊________________________________________________________________________________
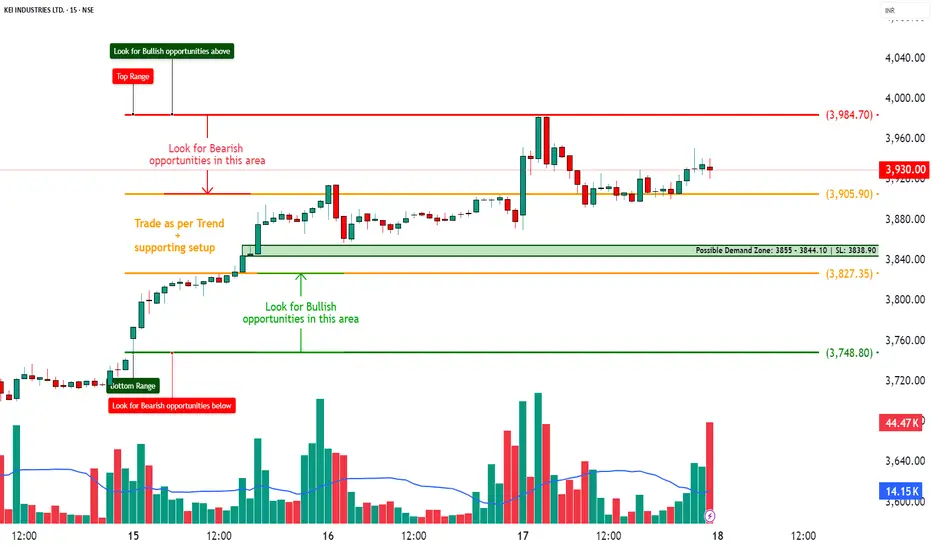
PRESTIGE – Bullish Continuation with Aggressive Call Build-Up________________________________________________________________________________📈 PRESTIGE – Bullish Continuation with Aggressive Call Build-Up
📅 Setup Date: 18.07.2025 | ⏱ Timeframe: Daily
📍 Strategy: Options Trade Setup
________________________________________________________________________________
Overall Bias: Bullish
Spot Price: ₹1,783.2
Trend: Uptrend resumption with aggressive Call OI build-up
Volatility: IV slightly falling in puts, rising in calls → good for defined risk bullish setups
Ideal Strategy Mix: Bullish with defined reward → Bull Call Spread or Naked CE
________________________________________________________________________________
1. 🔼 Bullish Trade (Naked options as per trend)
Best CE: Buy 1800 CE @ ₹49.10
Why:
• Strong Long Build Up with OI up 225%
• Massive volume (1.78L contracts) and ₹33.2 Cr TTV → clear interest
• Decent delta (approx. 0.5–0.55) → good sensitivity to price movement
• Strike closest to spot + high liquidity = ideal for directional trade
________________________________________________________________________________
2. 🔽 Bearish Trade (Naked options as per trend)
Best PE: Sell 1740 PE @ ₹28.6
Why:
• Price down 46% with high volume (4.2L) = put writing
• OI dropped 6.94% → likely unwinding from short bias
• Deep OTM with stable delta (-0.25 approx)
• Favorable if bullish view sustains and price stays above ₹1,740
________________________________________________________________________________
3. ⚙️ Strategy Trade (As per trend + OI data)
Strategy: Call Debit Spread → Buy 1780 CE + Sell 1820 CE
Net Debit: ₹57.3 - ₹41.1 = ₹16.2
Max Profit: ₹40 (spread) - ₹16.2 = ₹23.8
Max Loss: ₹16.2
Risk:Reward ≈ 1 : 1.47
Lot Size: 450
Total Risk: ₹7,290
Max Profit: ₹10,710
Why:
• 1780 CE shows explosive Long Build Up (OI ↑1031%) → active strike for bulls
• 1820 CE also shows strong Long Build Up (OI ↑1000%) → defined bullish target
• Much better R:R than 1800–1840 while staying aligned with trend
• Defined risk with improved capital efficiency and lower theta burn
________________________________________________________________________________
📘 My Trading Setup Rules
Avoid Gap Plays
→ Check pre-open price action to avoid trades influenced by gap-ups/gap-downs.
Breakout Entry Only
→ Enter trades only if price breaks previous day’s High (for bullish trades) or Low (for bearish trades).
Watch Volume for Confirmation
→ Monitor volume closely. No volume = No trade.
Enter on Strong Candle + Volume
→ Execute the trade only if a strong candle appears with increasing volume in the direction of the trade.
Defined Risk:Reward Only
→ Take trades only if R:R is favorable (ideally ≥ 1:2).(Safe R:R – 1:1)
Premium Disclaimer
→ Option premiums shown are based on EOD prices — real-time premiums may vary during execution.
Time Frame Preference
→ Trade with your preferred time frame — this strategy works across intraday or positional setups.
________________________________________________________________________________
⚠ Disclaimer (Please Read):
• These Trades are shared for educational purposes only and is not investment advice.
• I am not a SEBI-registered advisor.
• The information provided here is based on personal market observation.
• No buy/sell recommendations are being made.
• Please do your own research or consult a registered financial advisor before making any trading decisions.
• Trading involves risk. Always use proper risk management.
I am not responsible for trading decisions based on this post.
________________________________________________________________________________
💬 Found this helpful?
Drop your thoughts or questions in the comments below ⬇️
🔁 Share this post with your trading community – let them benefit from clean charts, structured setups, and zone-based learning.
✅ Follow simpletradewithpatience for charts, clean setups, and educational content based on price action, zones, and risk-managed trades.
🚀 Trade with patience, trust your charts, and stay clear-headed!
Be Self-Reliant | Trade with Patience | Learn with Charts & Zones 📊________________________________________________________________________________
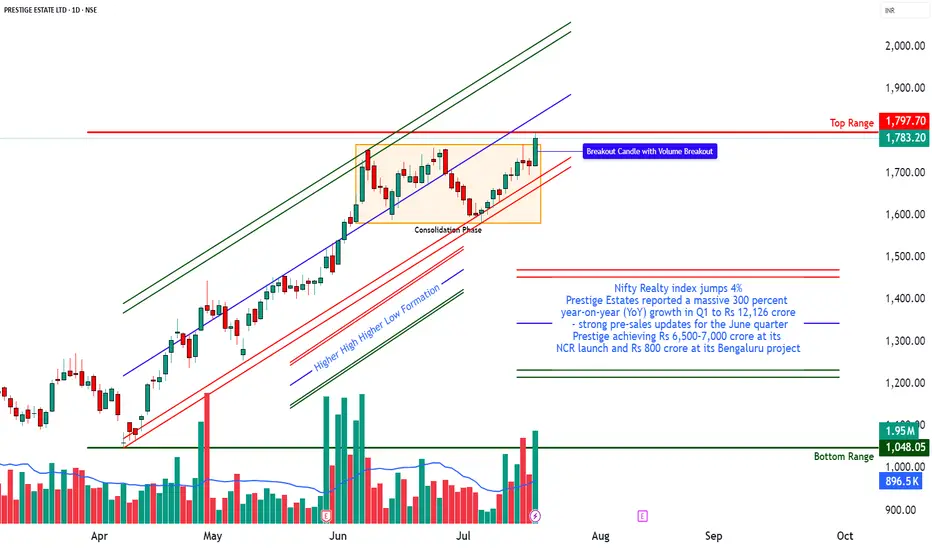
HDFCAMC – Strong Bullish Breakout on High Volume📈 HDFCAMC – Strong Bullish Breakout on High Volume
📅 Setup Date: 18.07.2025 | ⏱ Timeframe: Daily
📍 Strategy: Short-Term HNI Swing Setup
__________________________________________________________________________________
📝 Price Action Summary – HDFCAMC
HDFCAMC has delivered a textbook price action breakout, marked by a wide-range bullish candle on 3x average volume — confirming strong institutional participation. After weeks of tight consolidation and multiple failed attempts near the ₹5,385 resistance zone, the price finally broke out with a clean close near day’s high, indicating minimal selling pressure and clear buyer dominance. The breakout follows a classic compression-before-expansion setup, with the previous range acting as a base for momentum. Importantly, the absence of upper wick, strong follow-through, and volume-backed surge signal genuine strength — not a false breakout. Price has now entered a discovery phase with open space toward ₹5,673–₹5,800. As long as ₹5,385 holds as support, the bulls remain in control, and dip buying remains a high-probability setup. This is a classic case of price action speaking louder than indicators — structure, strength, and story all aligned.
__________________________________________________________________________________Trade Logic – Why This Setup:
Strong Price Structure: The stock has formed a bullish candle backed by a 20-day volume breakout, closing near the highs—indicating strong, sustained demand.
Breakout Confirmation: Price has cleanly broken out from a short-term base formed by multiple candle congestion. It's also trading above the prior resistance level of ₹5,385, confirming breakout strength.
__________________________________________________________________________________ Indicator Confluence: The RSI stands strong at 72, signaling bullish momentum. Additionally, the stock is breaking out of a Bollinger Band squeeze—an early sign of a potential momentum ignition. MACD, CCI, and Stochastic indicators are all aligned in bullish zones across daily, weekly, and monthly timeframes.
EMA Alignment: The stock is trading above all major exponential moving averages (9, 20, 50, 100, and 200 EMA), suggesting healthy trend harmony and support at every timeframe.
VWAP Positioning: Current price action remains well above the daily VWAP, indicating buying interest from institutional players and strong demand zones building underneath.
Volume Spike: Today's volume was 1.61 million, compared to the 10-day average of 452,000—more than a 3x surge, confirming strong buyer conviction and institutional participation.
Open Upside Potential: There are no significant supply zones visible until ₹5,800–₹6,000, offering a clear path for price expansion and swing targets.
Sector Tailwinds: The financial services and AMC sector is witnessing renewed traction after positive earnings and improved fund flow trends, supporting broader strength in related counters.
__________________________________________________________________________________ Would I Enter Now?
YES – Enter Now or on Dip
Reason: Price has just cleared a major volume cluster with strong momentum. Waiting too long might mean missing the breakout. The best approach would be:
• Enter 50% now
• Add 50% near ₹5,495–₹5,485 if there’s an intraday dip
__________________________________________________________________________________ 📈 Resistance Zones
• 🔴 R1: 5,591.5 (possibly weak)
• 🔴 R2: 5,673
• 🔴 R3: 5,797
📉 Support Zones
• 🟢 S1: 5,385
• 🟢 S2: 5,261
• 🟢 S3: 5,179
__________________________________________________________________________________ Direction: Buy (Bullish Bias)
Entry Price: ₹5,510 (Current Market Price)
Alternate Entry: On slight dips to ₹5,485–₹5,495 (ideal risk-managed zone)
Stop Loss: ₹5,385
Reason: This is Support 1 and a key VWAP-based level from the recent volume structure. A breach here invalidates the bullish strength.
Risk–Reward Ratio: 1:1 | 1:2 | +
__________________________________________________________________________________ Overall Bias: Bullish
Spot Price: ₹5,510
Trend: Strong upward momentum
Volatility: Slightly cooling IV (esp. in puts), but still elevated → good for defined-risk strategies
Ideal Strategy Mix: Naked CE or Call Debit Spread (defined-risk bullish strategy)
1. 🔼 Bullish Trade (Naked options as per trend)
Best CE: Buy 5400 CE @ ₹197.95
Why: Strong long buildup with rising OI, high volume, and solid delta — indicating institutional interest and momentum-backed directional strength.
__________________________________________________________________________________ 2. 🔽 Bearish Trade (Naked options as per trend)
Best PE: Sell 5200 PE @ ₹26.5
Why: Strong put writing seen with rising OI and price drop, suggesting low downside risk and income potential if bullish trend holds.
__________________________________________________________________________________
3. ⚙️ Strategy Trade (As per trend + OI data)
Strategy: Call Debit Spread → Buy 5400 CE + Sell 5600 CE
Net Debit: ₹197.95 - ₹92.6 = ₹105.35
Max Profit: ₹200 (spread) - ₹105.35 = ₹94.65
Max Loss: ₹105.35
Risk:Reward ≈ 1 : 0.9
Lot Size: 150
Total Risk: ₹15,802.5
Max Profit: ₹14,197.5
Why: This call spread is ideal because both the 5400 CE and 5600 CE are showing strong long build-up, indicating that traders expect the price to move higher. The 5600 CE has a sharp 168% jump in open interest with high volume, suggesting it’s a realistic target zone. By using a spread (buying 5400 CE and selling 5600 CE), we reduce the upfront cost and limit losses while still capturing upside. It also protects against time decay if the stock consolidates before moving up.
__________________________________________________________________________________ ⚠ Disclaimer (Please Read):
• These Trades are shared for educational purposes only and is not investment advice.
• I am not a SEBI-registered advisor.
• The information provided here is based on personal market observation.
• No buy/sell recommendations are being made.
• Please do your own research or consult a registered financial advisor before making any trading decisions.
• Trading involves risk. Always use proper risk management.
STWP is not responsible for trading decisions based on this post.
__________________________________________________________________________________ 💬 Found this helpful?
Drop your thoughts or questions in the comments below ⬇️
🔁 Share this post with your trading community – let them benefit from clean charts, structured setups, and zone-based learning.
✅ Follow simpletradewithpatience for charts, clean setups, and educational content based on price action, zones, and risk-managed trades.
🚀 Trade with patience, trust your charts, and stay clear-headed!
Be Self-Reliant | Trade with Patience | Learn with Charts & Zones 📊
__________________________________________________________________________________
*********************************************************************************************************************
Caution: This is a result based stock
*********************************************************************************************************************