SOLARINDS - STWP Equity Snapshot📊 STWP Equity Snapshot – SOLARINDS
(Educational | Chart-Based Interpretation)
Solar Industries India Ltd
________________________________________
📌 Intraday Reference Levels (Structure-based | Observational)
Reference Price Zone: 13,739
Risk Reference (Structure Invalidation): 13,089
Observed Upside Zones (Supply Ahead):
14,518 → 15,039
________________________________________
📌 Swing Reference Levels (Hybrid Model | 2–5 Days | Observational)
Reference Price Zone: 13,739
Risk Reference (Structural Breakdown): 12,764
Higher Range Projection (If structure sustains):
15,689 → 17,151
________________________________________
🔑 Key Levels – Daily Timeframe
Support Zones:
13,290 | 13,129 | 12,904
Resistance Zones:
13,766 | 13,901 | 14,062
________________________________________
🔍 STWP Market Read
SOLARINDS is displaying a strong recovery structure from a well-defined demand zone, following an extended corrective phase. Price has reclaimed intermediate resistance with impulsive candles and expanding volume, suggesting renewed buyer dominance rather than a weak pullback bounce.
Momentum indicators remain supportive, with RSI near 64.7, indicating strength without immediate exhaustion. Volume participation is decisively above average (Vol X ~2.11), highlighting institutional involvement during the recovery leg. Overall structure reflects trend continuation potential, while risk remains elevated due to prior overhead supply zones.
________________________________________
📊 Chart Structure & Indicator Summary
Structure: Demand-led recovery with breakout attempt
Trend: Upward bias developing
Momentum: Strong and expanding
RSI: Bullish zone, not overextended
Volume: High, confirming participation
Volatility: Expanding (normal in trend resumption phase)
________________________________________
📈 Final Outlook (Condition-Based)
Momentum: Strong
Trend: Up
Risk: High (wide range & supply overhead)
Volume: High
________________________________________
💡 STWP Learning Note
Strong moves are sustained by structure and participation, not predictions. The edge lies in risk calibration, patience, and clean post-trade reviews—not forecasting outcomes.
________________________________________
⚠️ Disclaimer
This content is an educational market interpretation based on chart structure and publicly available data. It does not constitute investment advice, a recommendation, or solicitation. Markets involve risk. Please consult a SEBI-registered financial advisor before making any trading or investment decision.
📘 STWP Approach
Observe momentum. Respect risk. Let structure guide decisions.
🚀 Stay Calm. Stay Clean. Trade With Patience.
💬 Did this add value?
🔼 Boost to support structured learning
✍️ Share your views or questions in the comments
🔁 Forward to traders who value disciplined analysis
👉 Follow for clean, probability-driven STWP insights
🚀 Stay Calm. Stay Clean. Trade With Patience.
Trade Smart | Learn Zones | Be Self-Reliant 📊
Learntrading

HEROMOTOCO - Rejection From Strong Resistance, Momentum Cooling💹 Hero MotoCorp Ltd (NSE: HEROMOTOCO)
Sector: Automobiles | CMP: 5817
View: Bearish — Rejection From Strong Resistance, Momentum Cooling
HEROMOTOCO has recently faced a sharp rejection from its upper resistance zone near the 6100–6200 region after a strong prior rally, indicating supply emergence at higher levels rather than healthy consolidation. The subsequent decline has been decisive, with price slipping back below key short-term levels, suggesting that the recent upswing may have been a momentum-driven leg rather than the start of a sustained trend. Current price behaviour reflects a cooling phase following distribution near the highs.
From a structural perspective, the stock remains within a broader developing framework, but near-term momentum has weakened. RSI around 42.6 sits in a neutral-to-healthy zone, indicating that the stock is neither oversold nor displaying reversal exhaustion. Stochastic has cooled from elevated levels, while MACD signals point to loss of bullish momentum rather than aggressive bearish acceleration. ADX suggests the trend is still developing, though recent behaviour highlights a transition from expansion to consolidation or pullback.
Volume participation remains moderate (Vol-X ~0.83), confirming that the recent decline is orderly and controlled, not panic-driven. This reduces the probability of sharp capitulation but keeps downside risk open as long as price fails to reclaim overhead supply. The current structure favours patience, with markets reassessing value after a strong prior move.
Key price references show strong overhead resistance clustered near 5931–6045 and further up around 6120, while immediate structural supports are placed near 5742, followed by 5668 and 5553, defining the current risk-reward envelope. Sustained acceptance above the resistance band would be required to restore bullish confidence, while continued trade below this zone keeps the bias tilted to the downside or range-bound with elevated volatility.
On the derivatives side, near-ATM CALLs and PUTs are referenced strictly for analytical insight into positioning behaviour. CALL-side data shows rising open interest with moderate volume expansion, indicating short build-up rather than directional strength, while PUT-side activity reflects short-covering-led participation, suggesting defensive repositioning rather than fresh aggressive bearish bets. Implied volatility remains in a relatively low-to-moderate band, pointing to measured risk pricing rather than fear-driven expansion. Overall, derivatives behaviour aligns with a cooling, non-trending phase, where conviction remains mixed and momentum-dependent.
Structure quality metrics reflect this balance. The STWP Edge Score in the moderate range highlights tradability but not high-conviction trend alignment. Liquidity remains concentrated near ATM strikes, supporting participation, but directional option structures remain sensitive to time decay and price stalling, reinforcing the importance of confirmation through price acceptance or rejection at key levels.
Overall, HEROMOTOCO is currently in a post-rally digestion phase, with bearish pressure emerging near resistance and momentum moderating. While deeper downside is possible if supports fail, the absence of capitulation volume suggests that the stock may oscillate within a defined range unless fresh directional conviction develops.
Final Outlook (Educational Snapshot):
Momentum: Neutral| Trend: Developing / Cooling | Risk: Low | Volume: Normal
⚠️ STWP Legal Disclaimer
This document is strictly for educational and informational purposes. All examples, charts, levels, and option structures discussed are illustrative and are not intended as buy, sell, or hold recommendations. STWP does not provide investment advice, trading tips, signals, or personalized financial guidance of any kind, nor is it a SEBI-registered intermediary or research analyst. The analyses, illustrations, and risk–reward structures included here are generic in nature and based on publicly available data and observed market behaviour, which may change without notice. Financial markets involve significant risk; derivatives in particular carry the potential for substantial losses. Option premiums, implied volatility, open interest, delta, and other market variables can fluctuate rapidly and unpredictably.
Readers are solely responsible for their trading decisions, capital management, and risk assessment. Before making any investment or trading decision, please consult a SEBI-registered investment advisor. STWP, its representatives, and affiliates shall not be liable for any direct or indirect loss arising from the use of this material. Historical patterns or past market behaviour do not guarantee future outcomes, nor should any part of this document be interpreted as a promise of performance, accuracy, or returns.
Position Status: No active position in this instrument at the time of analysis.
Data Source: TradingView & NSE India.
💬 Found this useful?
🔼 Boost this post to support structured learning
✍️ Share your thoughts or questions in the comments
🔁 Forward this to traders who value clean technical studies
👉 Follow for disciplined, structured, STWP-style analysis
🚀 Stay Calm. Stay Clean. Trade With Patience.
Trade Smart | Learn Zones | Be Self-Reliant 📊

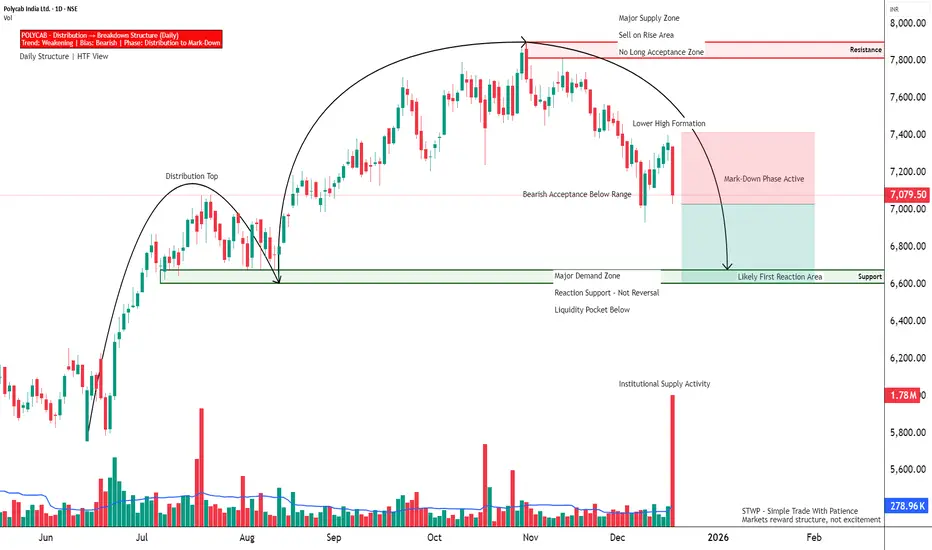
POLYCAB - Breakdown From Distribution Range💹 Polycab India Ltd (NSE: POLYCAB)
Sector: Electricals / Cables | CMP: 7079.5
View: Bearish — Breakdown From Distribution Range
POLYCAB has decisively slipped below its short-term consolidation zone, following a failed attempt to sustain above the 7600–7800 supply region. The rejection from this upper band was sharp and volume-backed, confirming distribution at higher levels rather than healthy consolidation. Recent candles show downside continuation with expanding volatility, keeping the immediate bias tilted to the downside.
Structurally, the stock has transitioned from an uptrend into a lower-high formation, with price now trading below key short-term averages. RSI around 38 reflects weak but not oversold momentum, indicating that downside pressure still has room to play out. MACD remains in bearish territory, while ADX suggests the trend is developing rather than exhausted. This combination favours continuation moves over mean-reversion bounces.
Volume behaviour is a key tell. The recent sell-off has come with very high participation (Vol-X ~9+), signalling active institutional repositioning rather than retail-driven noise. Importantly, selling has not yet shown capitulation characteristics, implying that weakness may persist until a stronger demand pocket is tested.
Key Support & Resistance Zones (Chart-Based)
Resistance Zones:
• 7270 (near-term supply / pullback cap)
• 7460.5 (intermediate resistance)
• 7580 (major overhead resistance, prior distribution zone)
• 7800–7900 (weak but broad HTF supply band)
Support Zones:
• 6960 (Support 1 – immediate reaction level)
• 6840.5 (Support 2 – intermediate demand)
• 6650 (Support 3 – major structural demand zone)
The 6960 level may offer a temporary pause or short-lived bounce, but it is not a trend-defining support. A sustained break below this zone increases downside probability toward 6840.5 and 6650, where stronger demand is likely to emerge. Any pullback toward 7270–7460 is expected to face supply unless accompanied by clear volume contraction and structural improvement.
From a broader risk perspective, POLYCAB is now in a sell-on-rise environment, with trend strength favouring bears and volatility elevated. Long exposure remains high-risk until price reclaims and sustains above the lower resistance band with improving momentum metrics.
Options activity shows increasing alignment with the mark-down structure. Near-ATM PUTs are referenced purely for positioning insight, with balanced-to-negative delta indicating sensitivity to further downside. Rising open interest alongside strong volume points to fresh bearish participation rather than short-covering, while implied volatility remains in a controlled mid-range, suggesting measured risk pricing.
Derivatives participation broadly confirms the cash-market breakdown, with liquidity concentrated near ATM levels and behaviour consistent with informed repositioning. Directional structures remain sensitive to time decay and consolidation, making continued downside acceptance and momentum follow-through essential for validation.
Final Outlook (Educational Snapshot):
Momentum: Weak | Trend: Developing| Risk: High | Volume: Very High
⚠️ STWP Legal Disclaimer
This document is strictly for educational and informational purposes. All examples, charts, levels, and option structures discussed are illustrative and are not intended as buy, sell, or hold recommendations. STWP does not provide investment advice, trading tips, signals, or personalized financial guidance of any kind, nor is it a SEBI-registered intermediary or research analyst. The analyses, illustrations, and risk–reward structures included here are generic in nature and based on publicly available data and observed market behaviour, which may change without notice. Financial markets involve significant risk; derivatives in particular carry the potential for substantial losses. Option premiums, implied volatility, open interest, delta, and other market variables can fluctuate rapidly and unpredictably.
Readers are solely responsible for their trading decisions, capital management, and risk assessment. Before making any investment or trading decision, please consult a SEBI-registered investment advisor. STWP, its representatives, and affiliates shall not be liable for any direct or indirect loss arising from the use of this material. Historical patterns or past market behaviour do not guarantee future outcomes, nor should any part of this document be interpreted as a promise of performance, accuracy, or returns.
Position Status: No active position in this instrument at the time of analysis.
Data Source: TradingView & NSE India.
💬 Found this useful?
🔼 Boost this post to support structured learning
✍️ Share your thoughts or questions in the comments
🔁 Forward this to traders who value clean technical studies
👉 Follow for disciplined, structured, STWP-style analysis
🚀 Stay Calm. Stay Clean. Trade With Patience.
Trade Smart | Learn Zones | Be Self-Reliant 📊
BDL - Breakdown With Reactive Oversold Conditions💹 Bharat Dynamics Ltd (NSE: BDL)
Sector: Defence | CMP: 1324.3
View: Bearish — Breakdown With Reactive Oversold Conditions
BDL has decisively broken below its recent consolidation structure near the 1350–1380 zone, confirming a bearish continuation phase rather than a routine pullback. The breakdown candle is wide-ranged and supported by above-average volume, signalling active supply dominance and institutional distribution. This move has pushed price into lower demand territory, invalidating earlier stabilization attempts and keeping the broader structure tilted to the downside.
From a structural standpoint, the stock remains firmly in a lower-high, lower-low sequence, with price trading well below its short- and medium-term moving averages. RSI has slipped to around 29.8, placing the stock in an oversold zone, but this should be read as exhaustion within a downtrend, not as a reversal signal. Stochastic is deeply oversold, while MACD remains negative with expanding bearish momentum, indicating sellers continue to control price discovery. ADX suggests the trend phase is still active, though volatility is beginning to rise as price approaches nearby demand.
Volume behaviour adds important context. While participation is above average (Vol-X ~1.06), it is not climactic, implying that selling pressure is orderly and controlled, not panic-driven. This keeps the door open for short-term reactive bounces, but does not yet support a structural trend change.
Key Support & Resistance Zones (Chart-Aligned)
Resistance Zones:
• 1348–1373 (broken base, now supply)
• 1387 (upper supply / rejection zone)
Support Zones:
• Support 1: 1309.93 (minor demand, reaction-level support)
• Support 2: 1295.57 (intermediate demand)
• Support 3: 1271.03 (next structural support)
Support 1 at 1309.93 is expected to act as a pause or bounce zone, not a reversal base. A sustained breakdown below this level increases downside probability toward 1295.57 and 1271.03, while any bounce into the 1348–1373 region is likely to face renewed supply unless accompanied by clear structural improvement.
On the derivatives side, the 1320 PUT is referenced purely for analytical insight. The option shows an LTP near 25 with a delta of about -0.45, offering balanced directional sensitivity. A sharp OI contraction of over 30 percent alongside a strong volume expansion highlights short-covering-led activity, not aggressive fresh bearish positioning. IV remains in a mid-range band, consistent with reactive price behaviour rather than sustained trend acceleration.
Overall, BDL remains in a bearish structural phase with weak momentum and elevated risk. Short-term oversold bounces are possible near Support 1, but the larger framework continues to favour sell-on-rise behaviour unless price reclaims resistance with strong follow-through and volume confirmation.
Final Outlook (Educational Snapshot):
Momentum: Weak | Trend: Down | Risk: Low| Volume: Normal
⚠️ STWP Legal Disclaimer
This document is strictly for educational and informational purposes. All examples, charts, levels, and option structures discussed are illustrative and are not intended as buy, sell, or hold recommendations. STWP does not provide investment advice, trading tips, signals, or personalized financial guidance of any kind, nor is it a SEBI-registered intermediary or research analyst. The analyses, illustrations, and risk–reward structures included here are generic in nature and based on publicly available data and observed market behaviour, which may change without notice. Financial markets involve significant risk; derivatives in particular carry the potential for substantial losses. Option premiums, implied volatility, open interest, delta, and other market variables can fluctuate rapidly and unpredictably.
Readers are solely responsible for their trading decisions, capital management, and risk assessment. Before making any investment or trading decision, please consult a SEBI-registered investment advisor. STWP, its representatives, and affiliates shall not be liable for any direct or indirect loss arising from the use of this material. Historical patterns or past market behaviour do not guarantee future outcomes, nor should any part of this document be interpreted as a promise of performance, accuracy, or returns.
Position Status: No active position in this instrument at the time of analysis.
Data Source: TradingView & NSE India.
💬 Found this useful?
🔼 Boost this post to support structured learning
✍️ Share your thoughts or questions in the comments
🔁 Forward this to traders who value clean technical studies
👉 Follow for disciplined, structured, STWP-style analysis
🚀 Stay Calm. Stay Clean. Trade With Patience.
Trade Smart | Learn Zones | Be Self-Reliant 📊

SUPREMEIND High-Volume Reversal Attempt💹 Supreme Industries Ltd (NSE: SUPREMEIND)
Sector: Consumer Durables / Plastics | CMP: 3405.8
View: Neutral to Bullish — High-Volume Reversal Attempt
SUPREMEIND has witnessed a sharp corrective phase from its prior swing high near 4739, followed by a decisive reaction from the lower demand zone around the 3180–3320 region. The recent price action is marked by a strong bullish candle supported by exceptionally high volume, signalling aggressive short covering and fresh participation rather than a low-quality bounce. Despite the strength of the reaction, the broader structure remains a recovery attempt within a larger corrective framework, with price still trading below key medium- and long-term moving averages.
From a structural perspective, the stock is attempting to stabilize after a prolonged decline, with RSI at 43.65 recovering from oversold conditions and moving back into a neutral-to-healthy zone. Stochastic has exited oversold territory, while MACD remains negative but shows early signs of deceleration in downside momentum. ADX reflects a strong directional phase, although current behaviour suggests the trend is transitioning rather than fully reversed. Volume participation is notably elevated (Vol-X 3.86), confirming that the recent move is driven by active repositioning rather than passive mean reversion.
Key price references show overhead supply zones clustered near 3456–3592, while immediate structural support remains around 3320–3184, defining the current risk-reward envelope. A sustained hold above the reclaimed short-term averages would be required to improve structural confidence, while failure to hold recent demand may keep the stock range-bound with elevated volatility.
On the derivatives side, the 3400 CALL is used strictly as an analytical reference to understand positioning behaviour. The option reflects LTP near 72 with a delta of 0.55, indicating strong directional sensitivity. OI contraction of approximately 18 percent combined with an explosive volume expansion of over 1300 percent clearly points to short-covering-led participation rather than fresh leveraged longs. IV remains in a moderate zone, suggesting volatility is present but not excessively priced. This configuration typically aligns with sharp reactive moves, though continuation depends on follow-through in the underlying.
Structure quality metrics remain constructive, with an STWP Edge Score near 6.8/10, supported by liquidity proximity to ATM, balanced IV conditions and strong participation. However, directional options remain highly sensitive to time decay and price stalling, reinforcing the importance of momentum persistence in such environments. Smart positioning currently reflects improving sentiment, though confirmation would require sustained price acceptance above near-term resistance bands.
Overall, SUPREMEIND is exhibiting a high-volume reversal attempt with improving internal momentum, but the broader trend remains in a rebuilding phase. Structural confirmation, moving-average reclaim and contraction-to-expansion behaviour will be critical in determining whether this move evolves into a trend or remains a reactive bounce.
Final Outlook (Educational Snapshot):
Momentum: Strong (Short-Term) | Trend: Recovering / Transitional | Risk: High | Volume: Very High
⚠️ STWP Legal Disclaimer
This document is strictly for educational and informational purposes. All examples, charts, levels, and option structures discussed are illustrative and are not intended as buy, sell, or hold recommendations. STWP does not provide investment advice, trading tips, signals, or personalized financial guidance of any kind, nor is it a SEBI-registered intermediary or research analyst. The analyses, illustrations, and risk–reward structures included here are generic in nature and based on publicly available data and observed market behaviour, which may change without notice. Financial markets involve significant risk; derivatives in particular carry the potential for substantial losses. Option premiums, implied volatility, open interest, delta, and other market variables can fluctuate rapidly and unpredictably.
Readers are solely responsible for their trading decisions, capital management, and risk assessment. Before making any investment or trading decision, please consult a SEBI-registered investment advisor. STWP, its representatives, and affiliates shall not be liable for any direct or indirect loss arising from the use of this material. Historical patterns or past market behaviour do not guarantee future outcomes, nor should any part of this document be interpreted as a promise of performance, accuracy, or returns.
Position Status: No active position in this instrument at the time of analysis.
Data Source: TradingView & NSE India.
💬 Found this useful?
🔼 Boost this post to support structured learning
✍️ Share your thoughts or questions in the comments
🔁 Forward this to traders who value clean technical studies
👉 Follow for disciplined, structured, STWP-style analysis
🚀 Stay Calm. Stay Clean. Trade With Patience.
Trade Smart | Learn Zones | Be Self-Reliant 📊

KAYNES - Oversold Demand-Zone Reversal Attempt💹 Kaynes Technology India Ltd (NSE: KAYNES)
Sector: Electronics Manufacturing | CMP: 4331 | View: Oversold Demand-Zone Reversal Attempt
Price Action
Kaynes witnessed a sharp vertical decline from the 7800 supply belt and has now landed directly on its major multi-month demand zone between 3710–3900. The latest session delivered a wide-range bullish reaction candle, signalling early evidence of absorption after a heavy liquidation phase. Price is currently stabilizing within a critical structure where further downside may ease if demand continues to hold.
VCP Analysis
The stock has moved from a wide high-volatility decline into the first compression point at the lower demand cluster. Although not a textbook VCP, the pattern resembles early-stage volatility contraction after a capitulation event. Buyers have shown intent inside the zone, and any narrowing of daily ranges around 4000–4300 may signal the beginning of a reclaiming structure.
STWP Trading Analysis
Momentum indicators show downward fatigue — RSI is deep oversold and beginning to curl, MACD histogram reflects slowing bearish force, and Stochastic is trying to reverse from lower bounds. Price behaviour suggests the initial capitulation may be complete, as the sudden spike in volume indicates potential strong-handed accumulation. The trend remains broadly negative, but the first signs of stabilization are visible. Sustaining above 3884 keeps the recovery sequence alive; losing it can re-open downside continuation.
Fibonacci Analysis
Using the swing high at 7822 and swing low at 3712:
0.236 Retracement: 4682
0.382 Retracement: 5282
0.5 Retracement: 5767
Kaynes currently trades below all key retracement levels. A clean push above 4606–4682 (Fib 0.236 region) is essential to unlock further retracements. These levels will act as layered resistance zones during the potential upside path.
STWP Support & Resistance
Strong Supports: 3884 (Primary demand support) | 3437 | 3161
Overhead Resistances: 4606 | 4882 | 5329
Price is positioned directly above major structural support with massive volume backing — a region where reversals traditionally form if sustained accumulation continues.
STWP Volume & Technical Setup
Volume hit an exceptionally high reading, reflecting a potential capitulation or institutional absorption event. Such spikes often mark the beginning stages of a base. The EMAs are widely stretched — a characteristic of trend exhaustion — and may gradually compress if price stabilizes. The volume–price behaviour hints at shift in market tone, where forced selling may have met deep-pocket buyers at the demand floor.
⚠️ STWP Legal Disclaimer
This document is strictly for educational and informational purposes. All examples, charts, levels, and option structures discussed are illustrative and are not intended as buy, sell, or hold recommendations. STWP does not provide investment advice, trading tips, signals, or personalized financial guidance of any kind, nor is it a SEBI-registered intermediary or research analyst. The analyses, illustrations, and risk–reward structures included here are generic in nature and based on publicly available data and observed market behaviour, which may change without notice. Financial markets involve significant risk; derivatives in particular carry the potential for substantial losses. Option premiums, implied volatility, open interest, delta, and other market variables can fluctuate rapidly and unpredictably.
Readers are solely responsible for their trading decisions, capital management, and risk assessment. Before making any investment or trading decision, please consult a SEBI-registered investment advisor. STWP, its representatives, and affiliates shall not be liable for any direct or indirect loss arising from the use of this material. Historical patterns or past market behaviour do not guarantee future outcomes, nor should any part of this document be interpreted as a promise of performance, accuracy, or returns.
Position Status: No active position in this instrument at the time of analysis.
Data Source: TradingView & NSE India.
💬 Found this useful?
🔼 Boost this post to support structured learning
✍️ Share your thoughts or questions in the comments
🔁 Forward this to traders who value clean technical studies
👉 Follow for disciplined, structured, STWP-style analysis
🚀 Stay Calm. Stay Clean. Trade With Patience.
Trade Smart | Learn Zones | Be Self-Reliant 📊

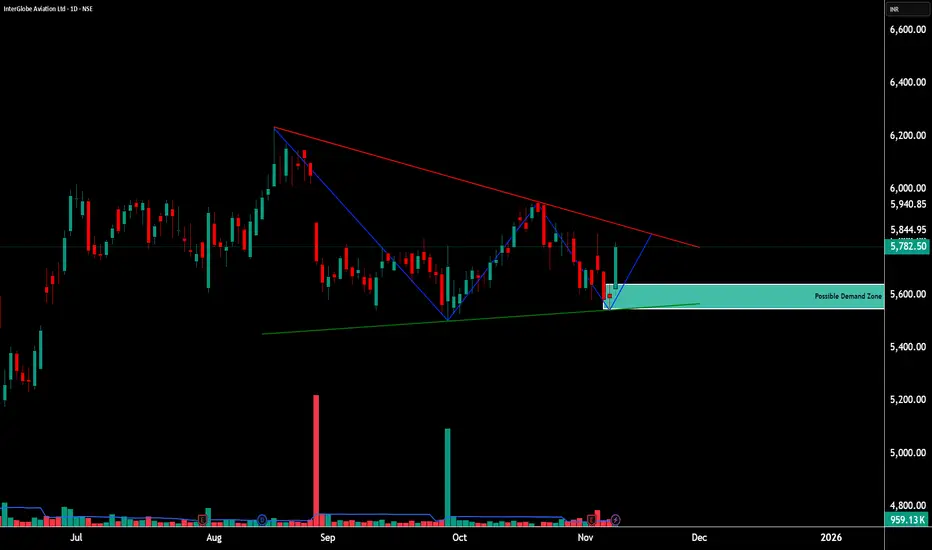
INDIGO – Calm Under Pressure | Demand Zone Commands Respect💹 InterGlobe Aviation Ltd (NSE: INDIGO)
Sector: Aviation & Transport Services | CMP: ₹5,782.50 | View: Descending Structure + Demand Zone Reaction
________________________________________
📊 Price Action
InterGlobe Aviation continues to move within a descending structure, maintaining a controlled series of lower highs under the falling red trendline.
Each time the stock has dipped, it has found support around the ₹5,450–₹5,650 demand zone, a region that has consistently attracted buying interest.
The latest daily candle shows renewed strength emerging from this zone, supported by a clear rise in volume — indicating that the market continues to respect this level.
On the daily chart, IndiGo has formed a descending triangle, and at the far end of this structure lies a well-defined demand zone, suggesting that the stock may be preparing for a possible directional move in the near future.
________________________________________
🧭 Support & Resistance
Support 1: ₹5,663 | Support 2: ₹5,523 | Support 3: ₹5,450
Resistance 1: ₹5,855 | Resistance 2: ₹5,928 | Resistance 3: ₹6,058
Price continues to oscillate between a firm demand base and a declining resistance line, reflecting ongoing compression before expansion.
________________________________________
🧠 STWP Technical Note
The internal readings indicate a balanced phase — neither overly bullish nor weak.
Volume behaviour remains steady near the base, with improving momentum signatures.
Several key internal parameters have begun aligning positively, but the setup still awaits broader confirmation. ________________________________________
🎯 Final Outlook
IndiGo currently stands at a critical juncture — price is testing the limits of its descending structure while buyers continue to defend the lower band.
Momentum is beginning to build, and volume expansion near the base reinforces confidence in the demand zone.
As long as price respects ₹5,600 and holds above the demand base, the chart maintains a neutral-to-positive bias, with scope for a gradual shift toward the upper range of the pattern.
________________________________________
⚠️ Disclosure & Disclaimer – Please Read Carefully
This post is created purely for educational and informational purposes and does not constitute investment advice or a buy/sell recommendation.
I am not a SEBI-registered investment adviser. All observations are based on technical studies and publicly available information.
Trading and investing involve risk; please manage position size and stop-loss discipline as per your risk profile.
Always consult a SEBI-registered financial advisor before making trading decisions.
________________________________________
Position Status: No active position in (INDIGO) at the time of analysis.
Data Source: TradingView & NSE India
💬 Found this useful?
🔼 Boost this post if you value clean, structured analysis.
💭 Drop your views — can Torrent Pharma sustain this breakout above ₹3,835?
🔁 Share this with traders who track institutional breakouts.
👉 Follow for more price-action based institutional setups.
🚀 Stay Calm. Stay Clean. Trade With Patience.
Trade Smart | Learn Zones | Be Self-Reliant 📊
________________________________________
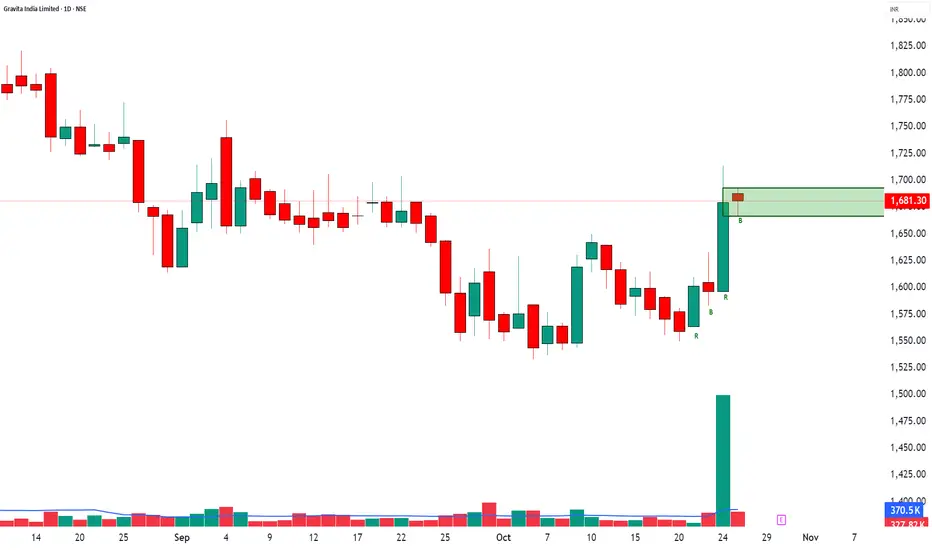
GRAVITA INDIA LTD – Strong Demand Zone📈 GRAVITA INDIA LTD – Strong Demand Zone at 1667–1692 🟢
🔹 Supports: 1668 / 1654 / 1642
🔹 Resistances: 1693 / 1705 / 1718
🔹 Swing Demand Zone: 1692–1667
🎯 STWP Trade View:
Gravita India is currently building strength near its new demand zone.
If the price holds above 1667, it can trigger a move toward 1715–1735 in the short term.
A retest near 1670–1665 with low volume will offer a favorable long entry opportunity.
💡 Learning Note:
Demand zones formed after large bullish candles with high volume often indicate institutional absorption.
Wait for price confirmation or retest to ensure strong continuation from the zone.
Final Outlook: Momentum: Building Up | Trend: Bullish Bias | Risk: Moderate | Volume: Extremely High
________________________________________
________________________________________
⚠️ Disclosure & Disclaimer – Please Read Carefully
The information shared here is meant purely for learning and awareness. It is not a buy or sell recommendation and should not be taken as investment advice. I am not a SEBI-registered investment adviser, and all views expressed are based on personal study, chart patterns, and publicly available market data.
Trading—whether in stocks or options—carries risk. Markets can move unexpectedly, and losses can sometimes exceed the money you have invested. Past performance or past setups do not guarantee future results.
If you are a beginner, treat this as a guide to understand how the market works and practice on paper trades before risking real money. If you are experienced, always assess your own risk, position sizing, and strategy suitability before entering trades.
Consult a SEBI-registered financial adviser before making any real trading decision. By engaging with this content, you acknowledge full responsibility for your trades and investments.
Position Status: No active position in GRAVITA at the time of analysis.
Data Source: TradingView & NSE India (Past Chart Reference) (Historical levels)
💬 Found this useful?
🔼 Give this post a Boost to help more traders discover clean, structured learning.
✍️ Drop your thoughts, questions, or setups in the comments — let’s grow together!
🔁 Share with fellow traders and beginners to spread awareness.
👉 “If you liked this breakdown, follow for more clean, structured setups with discipline at the core.”
🚀 Stay Calm. Stay Clean. Trade With Patience.
Trade Smart | Learn Zones | Be Self-Reliant 📊
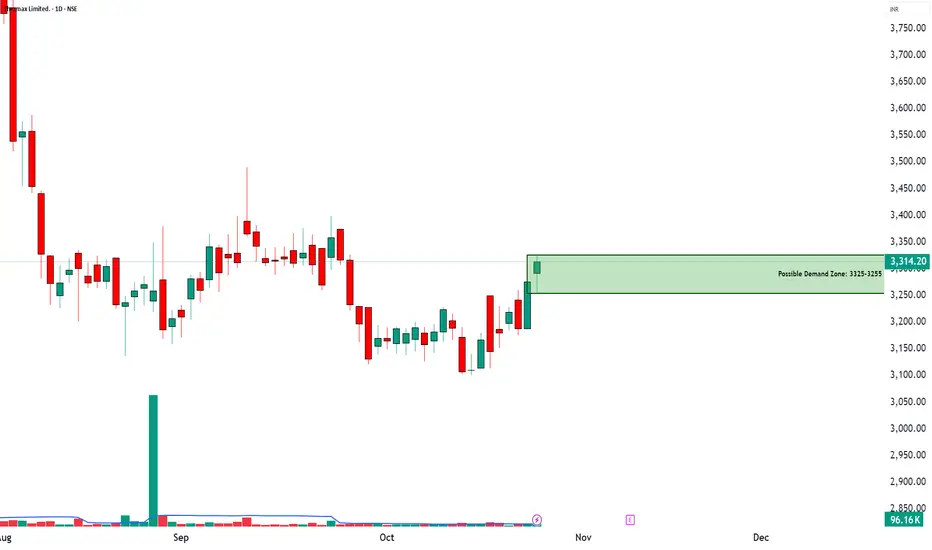
THERMAX LTD – Possible Demand Zone📈 THERMAX LTD – Possible Demand Zone in The Making - A possible Rally Base Rally
🔹 Entry Zone: 3325
🔹 Supports: 3271 / 3228 / 3201
🔹 Resistances: 3341 / 3368 / 3411
🔹 Swing Demand Zone: 3325–3255
🎯 STWP Trade View:
Thermax is showing early signs of trend reversal from recent consolidation.
A sustained close above 3340 may open the way for possible further upside move, while dips toward 3280–3260 can offer buying opportunities.
💡 Learning Note:
When price revisits a previously strong demand zone with low volume and then bounces sharply — it often signals the presence of smart money. Watch how price behaves near zone retests before scaling up.
Final Outlook:
Momentum: Building | Trend: Early Bullish | Risk: Controlled | Volume: picking up
________________________________________
________________________________________
⚠️ Disclosure & Disclaimer – Please Read Carefully
The information shared here is meant purely for learning and awareness. It is not a buy or sell recommendation and should not be taken as investment advice. I am not a SEBI-registered investment adviser, and all views expressed are based on personal study, chart patterns, and publicly available market data.
Trading—whether in stocks or options—carries risk. Markets can move unexpectedly, and losses can sometimes exceed the money you have invested. Past performance or past setups do not guarantee future results.
If you are a beginner, treat this as a guide to understand how the market works and practice on paper trades before risking real money. If you are experienced, always assess your own risk, position sizing, and strategy suitability before entering trades.
Consult a SEBI-registered financial adviser before making any real trading decision. By engaging with this content, you acknowledge full responsibility for your trades and investments.
Position Status: No active position in THERMAX at the time of analysis.
Data Source: TradingView & NSE India (Past Chart Reference) (Historical levels)
💬 Found this useful?
🔼 Give this post a Boost to help more traders discover clean, structured learning.
✍️ Drop your thoughts, questions, or setups in the comments — let’s grow together!
🔁 Share with fellow traders and beginners to spread awareness.
👉 “If you liked this breakdown, follow for more clean, structured setups with discipline at the core.”
🚀 Stay Calm. Stay Clean. Trade With Patience.
Trade Smart | Learn Zones | Be Self-Reliant 📊
ASIANPAINT – Bullish Rest Zone Setup | Watch 2537–2500 🎨 ASIAN PAINTS LTD (NSE: ASIANPAINT)
Sector: Paints & Coatings | CMP: 2,516.00 | View: Bullish Rest Zone Setup
Key Levels
Resistance: 2575 / 2615 / 2640
Support: 2500 / 2478 / 2442
STWP Trade Analysis:
Stock has moved up almost 9% in the last 4 days.
Currently, the stock is resting within a tight consolidation range after a wide bullish bar, forming a Bullish Rest Zone between 2,537.10 and 2,500.70.
Two possible scenarios:
🟢 Scenario 1 – Bulls Take Charge: I would buy @ 2537.10 with a stop at around 2498.40
View: Fresh momentum supported by volume breakout, clear structural strength, and a smooth candle recovery pattern.
🔴 Scenario 2 – Bears Take Charge: I would sell at 2500.70 with a stop at around 2539.4
View: Short-term pullback setup toward 2478–2450 if price loses 2500 zone.
───────────────────────────────────────────────
⚠️ **DISCLOSURE & DISCLAIMER (SEBI-Compliant)**
───────────────────────────────────────────────
📘 **Purpose:**
This content is created **solely for educational and informational purposes** to help readers understand market structure, price action, and technical analysis.
It does **not constitute investment advice**, research recommendation, or a solicitation to buy or sell any security.
👤 **Author Disclosure:**
The author is **not a SEBI-registered investment adviser or research analyst.**
All chart studies, price levels, and observations are based on publicly available data (e.g., **NSE India**, **TradingView**) and are presented purely for **learning illustration**.
📊 **Position Status:**
No active position in * * at the time of publication.
“The author may sometimes trade in the securities discussed, but such trades are independent and shared here only for educational understanding.”
⚠️ **Risk Disclosure:**
Trading and investing involve financial risk. Market movements can be unpredictable, and losses may exceed invested capital.
Readers are strongly advised to consult a **SEBI-registered investment adviser** before making any trading or investment decisions.
🧠 **Responsibility Clause:**
By engaging with this post, you acknowledge that you are **solely responsible for your own trading or investment decisions**, and that this content is intended only for **market education and awareness**.
───────────────────────────────────────────────
💬 **Did You Find This Useful?**
If this analysis helped you understand price structure or market psychology better:
🔼 **Boost** to support transparent & structured financial education.
✍️ **Comment** your insights, observations, or questions — let’s learn together.
🔁 **Share** this post with learners and aspiring traders who value discipline.
📚 **Follow stwp** for more structured, educational breakdowns on stocks & setups.
🚀 *Stay Calm. Stay Clean. Trade With Patience.*
💡 *Trade Smart | Learn Zones | Be Self-Reliant.*
───────────────────────────────────────────────

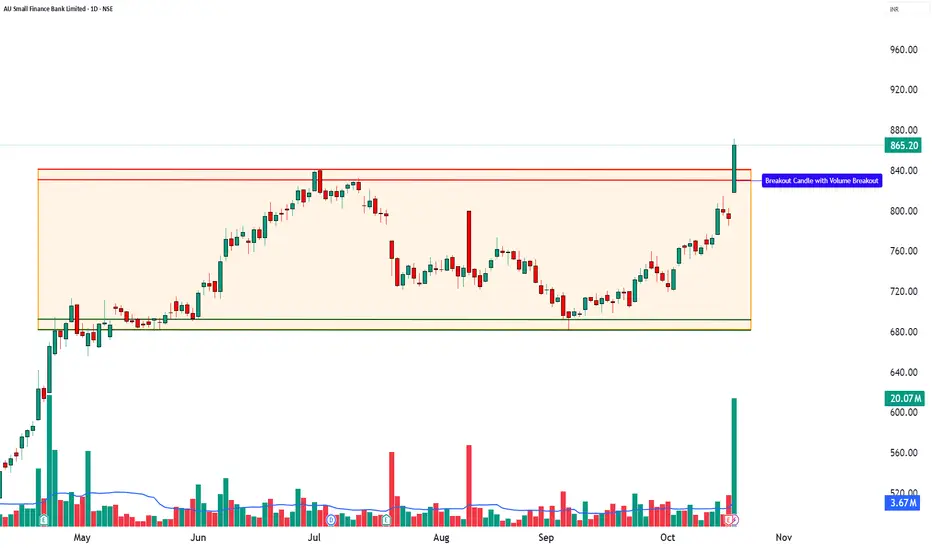
AUBANK – 52-Week Breakout with Strong Volume💹 A.U. Small Finance Bank Ltd (NSE: AUBANK)
Sector: Banking & Finance | CMP: ₹865.20 | View: Bullish Momentum Setup
🔹Price Action:
A.U. Small Finance Bank showed strong upward movement with a big green candle and very high trading volume. The stock opened at its lowest point and kept rising all day, which means buyers were in full control. It also made a new 52-week high, showing that momentum and confidence are strong. In simple words, the stock is breaking out with power, and buyers are clearly leading the trend.
🔹 Technical Analysis:
AUBANK is showing strong bullish momentum with a clear 52-week breakout, signaling fresh buying interest and strong confidence among traders. The big green candle with open-equals-low formation shows that buyers were active right from the start of the session. The RSI at 81 reflects strong momentum, while MACD at 9.35 confirms a positive crossover, adding to the bullish view. Similarly, CCI at 258 and Stochastic at 96 indicate powerful buying pressure, suggesting that the uptrend is well-supported. The VWAP at ₹855.39 is acting as an important support level, helping the price stay stable even during intraday pullbacks. Meanwhile, a Bollinger Band breakout and a BB squeeze-off pattern hint that the stock may continue its sharp upward move. Altogether, the indicators show a well-supported bullish setup, ideal for short to medium-term swing trades.
🔹 Volume Analysis:
The stock saw a huge rise in trading volume — almost 5 times higher than normal! This is a strong sign that big investors or institutions are showing interest. Such a jump in both price and volume means the breakout is real and reliable, not just a short-term move. This kind of volume confirms fresh buying and positive sentiment, suggesting the stock could stay strong for some time.
🔹 Chart Analysis:
For months, AUBANK was moving sideways between ₹680 and ₹840. Now, it has broken above ₹840 with heavy volume, showing that the stock has ended its consolidation phase and started a new bullish trend. This breakout shows that buyers are taking charge, and if the volume remains high, the stock may continue to move upward in the coming sessions.
🔹 Demand Zone: ₹814 – ₹785
This area acts as a strong demand zone, where earlier buying interest was visible. If the price revisits this zone, it may attract fresh accumulation or renewed buying activity. Traders and learners can observe this region for potential re-entry setups once the price shows signs of stability or reversal — purely for educational understanding of demand zone behavior in momentum setups.
🔹 Key Levels:
Resistance: 885/905/939
Support: 832/798/778
🔹 STWP Trade Analysis:
Bias: Bullish
Breakout Level: 872
Intraday Support: 851
Swing Support: 783
Intermediate Support: 680
Observation:
🔹 Final Outlook:
Momentum: Moderate | Trend: Neutral | Risk: High | Volume: High
The setup shows strong bullish signs but comes after a sharp rally, so short-term volatility can be expected. Sustained volume above ₹850 will keep the trend positive.
🔹 Learning Note (Educational Purpose):
This setup is a good example of how volume + breakout candles signal a shift in momentum. It teaches traders that when price breaks resistance with strong volume, it often marks the beginning of a new trend rather than the end of one. Always confirm with RSI/MACD alignment for reliability.
🔹 STWP Mentor Note:
Momentum trading works best when price, structure, and volume align together. Always look for clean breakouts backed by heavy volume — they tell you where smart money is moving. As a trader, focus more on learning price behavior than just chasing the move. Every breakout teaches patience, confidence, and timing — three pillars of successful trading.
───────────────────────────────────────────────
⚠️ **DISCLOSURE & DISCLAIMER (SEBI-Compliant)**
───────────────────────────────────────────────
📘 **Purpose:**
This content is created **solely for educational and informational purposes** to help readers understand market structure, price action, and technical analysis.
It does **not constitute investment advice**, research recommendation, or a solicitation to buy or sell any security.
👤 **Author Disclosure:**
The author is **not a SEBI-registered investment adviser or research analyst.**
All chart studies, price levels, and observations are based on publicly available data (e.g., **NSE India**, **TradingView**) and are presented purely for **learning illustration**.
📊 **Position Status:**
No active position in * * at the time of publication.
“The author may sometimes trade in the securities discussed, but such trades are independent and shared here only for educational understanding.”
⚠️ **Risk Disclosure:**
Trading and investing involve financial risk. Market movements can be unpredictable, and losses may exceed invested capital.
Readers are strongly advised to consult a **SEBI-registered investment adviser** before making any trading or investment decisions.
🧠 **Responsibility Clause:**
By engaging with this post, you acknowledge that you are **solely responsible for your own trading or investment decisions**, and that this content is intended only for **market education and awareness**.
───────────────────────────────────────────────
💬 **Did You Find This Useful?**
If this analysis helped you understand price structure or market psychology better:
🔼 **Boost** to support transparent & structured financial education.
✍️ **Comment** your insights, observations, or questions — let’s learn together.
🔁 **Share** this post with learners and aspiring traders who value discipline.
📚 **Follow STWP** for more structured, educational breakdowns on stocks & setups.
🚀 *Stay Calm. Stay Clean. Trade With Patience.*
💡 *Trade Smart | Learn Zones | Be Self-Reliant.*
───────────────────────────────────────────────
How to trade in the Right Trend - Beginners guide
How to Identify a Trend in a Chart?
Here's a practical breakdown of trend identification methods:
1. Price Structure Method (Most Fundamental)
Uptrend:
- Series of Higher Highs (HH) and Higher Lows (HL)
- Each peak is higher than the previous peak
- Each trough is higher than the previous trough
Downtrend:
- Series of Lower Highs (LH) and Lower Lows (LL)
- Each peak is lower than the previous peak
- Each trough is lower than the previous trough
Sideways/Range:
- Price oscillates between horizontal support and resistance
- No clear higher highs/lows or lower highs/lows
2. Moving Averages
Simple Rules:
- Price consistently above MA = Uptrend
- Price consistently below MA = Downtrend
- Price crossing back and forth = No clear trend
Popular MAs:
- 20 EMA (short-term)
- 50 SMA (medium-term)
- 200 SMA (long-term)
Golden Cross/Death Cross:
- 50 MA crosses above 200 MA = Bullish trend signal
- 50 MA crosses below 200 MA = Bearish trend signal
3. Trendline Method
Drawing Trendlines:
- Uptrend: Connect at least 2 higher lows with a straight line
- Downtrend: Connect at least 2 lower highs with a straight line
- The more touches, the stronger the trendline
- Price respecting the trendline confirms trend strength
4. Multi-Timeframe Analysis
The Complete Picture:
- Weekly chart: Overall market direction
- Daily chart: Intermediate trend
- 4H/1H chart: Entry timing
Rule: Always trade in the direction of the higher timeframe trend
#5. Indicators for Confirmation
ADX (Average Directional Index):
- Above 25 = Strong trend
- Below 20 = Weak/no trend
- Doesn't show direction, only strength
MACD:
- Histogram above zero = Uptrend
- Histogram below zero = Downtrend
- Crossovers signal potential trend changes
RSI:
- Consistently above 50 = Uptrend
- Consistently below 50 = Downtrend
6. Volume Confirmation
Healthy Trends Show:
- Rising volume on moves in trend direction
- Declining volume on corrections/pullbacks
- Volume spikes at breakout points
Quick Checklist for Trend Identification:
✅ Strong Uptrend:
- Higher highs and higher lows
- Price above rising moving averages
- Valid upward trendline intact
- ADX above 25
- Increasing volume on rallies
✅ Strong Downtrend:
- Lower highs and lower lows
- Price below falling moving averages
- Valid downward trendline intact
- ADX above 25
- Increasing volume on declines
⚠️ No Clear Trend (Stay Out):
- Choppy price action
- MAs flat or intertwined
- ADX below 20
- Price between support/resistance
Common Beginner Mistakes:
❌ Looking at only one timeframe
❌ Ignoring the bigger picture
❌ Trading every small wiggle as a "trend"
❌ Not waiting for confirmation
❌ Confusing corrections with reversals
Pro Tips:
💡 **The 3-Touch Rule:** A trend becomes more reliable after price respects a trendline at least 3 times
💡 **Trend is Your Timeframe:** What's an uptrend on daily might be a pullback on weekly
💡 **When in Doubt, Zoom Out:** Higher timeframes show the true direction
💡 **Trade WITH the trend, not against it:** Counter-trend trades have lower probability
**Remember:** Trend identification isn't about being perfect - it's about being on the right side of the market more often than not. Start with the basics (higher highs/lows), then add confirmation tools as you gain experience.
More updates with examples and Explanation on individual topics in a easy way to understand.
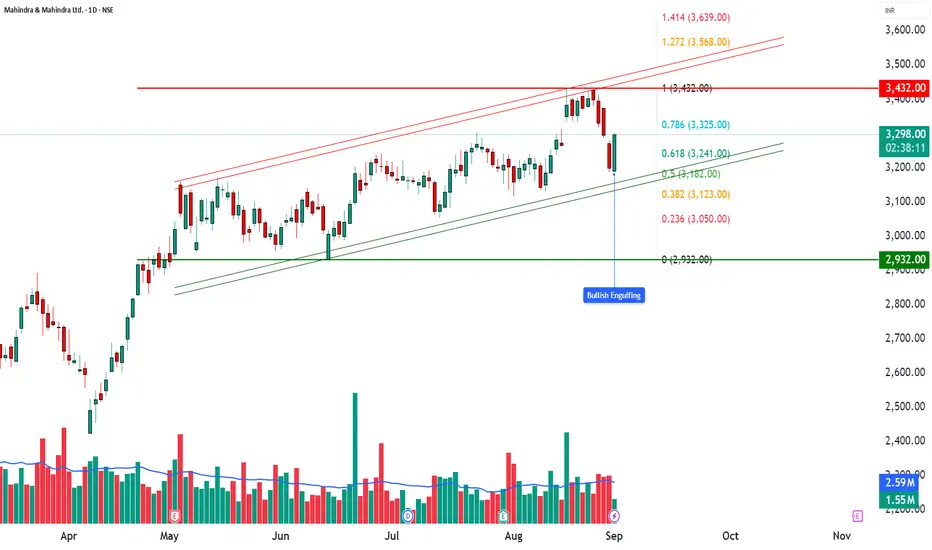
M&M | How to Trade a Bullish Engulfing in a Rising Channel🚘 M&M | How to Trade a Bullish Engulfing in a Rising Channel
📊 Stock: Mahindra & Mahindra Ltd (M&M)
⏳ Timeframe: Daily
📈 Chart Pattern: Rising Channel
🕯 Candlestick Pattern: Bullish Engulfing
________________________________________
🔹 Pattern Overview
M&M is currently trading within a Rising Channel, a structure that often reflects sustained bullish momentum. On the latest daily chart, a Bullish Engulfing candlestick has been formed, signaling renewed buying interest after a brief phase of consolidation.
________________________________________
The setup looks stronger with a Bullish Marubozu and an Open = Low candle, showing aggressive demand from the open. Price is holding well above VWAP, confirming bullish bias. A BB Squeeze Off signals volatility expansion ahead, while the recent false breakdown indicates sellers got trapped and buyers are back in control.
________________________________________
🔹 Key Levels to Watch
Resistance Zones: 3335 – 3374 – 3445
Support Zones: 3224 – 3152 – 3113
________________________________________
🔹 Technical Indicators Snapshot
RSI is at 52, sitting in the neutral zone but leaving room for upside momentum if buying picks up. The MACD shows a bearish crossover, which is an early caution signal to watch. CCI at -14 indicates neutral sentiment with no strong bias, while Stochastic at 55 is mid-range, suggesting neither overbought nor oversold conditions at the moment.
________________________________________
🔹 Candle Analysis
Candle 1 (Yesterday): High 3280 | Low 3187
Candle 2 (Today): High 3302.10 | Low 3191.10
👉 The today’s candle engulfed the previous session’s body, confirming the Bullish Engulfing pattern.
________________________________________
🔹 Trading View (Educational Insight Only)
A Bullish Engulfing inside a Rising Channel generally indicates continuation of the prevailing uptrend. If price manages to probably sustain above the 3335–3374 zone, it may signal strength for further upside. On the other hand, if the stock probably slips below the 3224–3152 support zone, it could lead to short-term profit booking.
________________________________________
📌 “All price levels mentioned are as observed at the time of writing and may change with market movements. Readers are advised to track live prices before making any trading or investment decision.”
⚠️ Disclaimer – Please Read Carefully
The information shared here is meant purely for learning and awareness. It is not a buy or sell recommendation and should not be taken as investment advice. I am not a SEBI-registered investment advisor, and all views expressed are based on personal study, chart patterns, and publicly available market data.
Trading — whether in stocks or options — carries risk. Markets can move unexpectedly, and losses can sometimes exceed the money you have invested. Past performance or past setups do not guarantee future results.
If you are a beginner, treat this as a guide to understand how the market works — practice on paper trades before risking real money. If you are experienced, always assess your own risk, position sizing, and strategy suitability before entering trades.
Consult a SEBI-registered financial advisor before making any real trading decision. By engaging with this content, you acknowledge full responsibility for your trades and investments.
💬 Found this useful?
🔼 Give this post a Boost to help more traders discover clean, structured learning.
✍️ Drop your thoughts, questions, or setups in the comments — let’s grow together!
🔁 Share with fellow traders and beginners to spread awareness.
👉 “If you liked this breakdown, follow for more clean, structured setups with discipline at the core.”
🚀 Stay Calm. Stay Clean. Trade With Patience.
Trade Smart | Learn Zones | Be Self-Reliant 📊
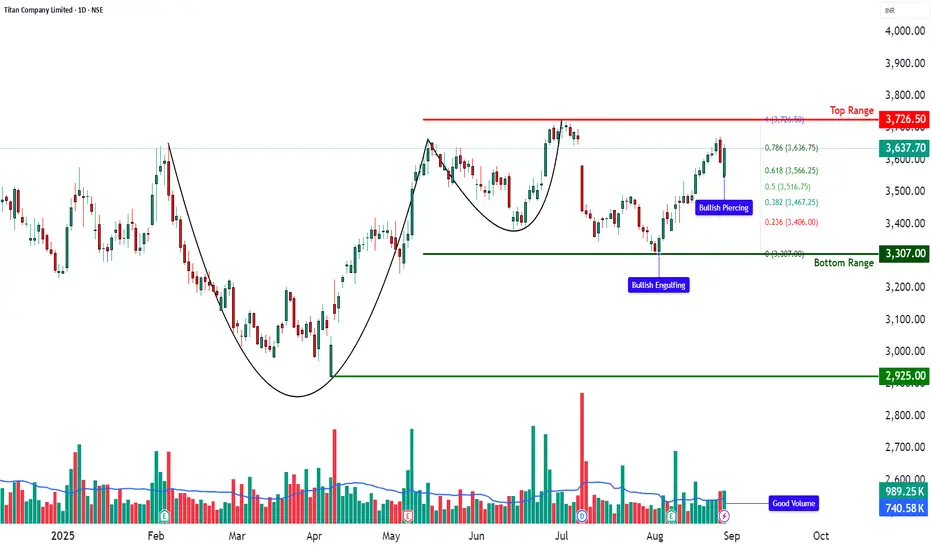
TITAN – Cup & Handle Breakout Retest📊 TITAN – Technical & Fundamental Educational Snapshot
Ticker: NSE: TITAN | Sector: Consumer – Lifestyle & Jewellery
CMP: ₹3,637.70
Rating: ⭐⭐⭐⭐ (Bullish Setup – For Educational Purposes Only)
Pattern Observed: ☕📈 Cup & Handle Breakout Retest
📊 Technical Observations
Titan Company Ltd. (CMP: ₹3,637.7) is presently exhibiting a Cup & Handle formation, with the price recently retesting the handle zone around ₹3,550–₹3,600 and showing signs of strength supported by healthy volumes. On the technical front, important resistance levels are noted around ₹3,675, ₹3,712, and ₹3,773, while support levels lie near ₹3,576, ₹3,515, and ₹3,477. Key indicators currently reflect positive momentum, with RSI around 65, MACD showing bullish signals on multiple timeframes, and CCI at 92, while the Stochastic indicator is in the higher zone (88–94), suggesting overbought but trending conditions. Volumes stood at ~989K, higher than the 20-day average of ~740K, indicating increased participation. Price action is also holding above VWAP, with Bollinger Band dynamics hinting at the possibility of trend continuation.
📰 Fundamental & News Flow
In its Q1 FY26 results, Titan Company Ltd. reported around 11% year-on-year revenue growth, primarily supported by sustained jewellery demand, although margins were modestly affected due to gold price volatility. The company continues to witness healthy traction in its Tanishq jewellery and Titan Eye+ businesses, alongside a recovery trend in watches and wearables. Titan has also been pursuing aggressive retail expansion, and the upcoming festive season is expected to support consumer demand further. From a structural perspective, the company is often highlighted for its premium brand positioning, robust balance sheet, and long-term jewellery demand drivers, which are considered key strengths in its sector.
📊 STWP Trade Analysis (Educational Purpose Only):
The recent price action indicates a Bullish Engulfing pattern followed by a Bullish Piercing formation, which are generally studied as signs of positive sentiment when supported by volumes. After the retest, a reference level around ₹3,726.50 may be noted, while the Bullish Piercing structure also highlights an observation zone near ₹3,650.90, with further upward reference levels around ₹3,752 and ₹3,854, and a protective support reference near ₹3,549. From a Fibonacci retracement perspective, a pullback level is visible near ₹3,566, with an invalidation reference around ₹3,516.
PERSISTENT – Bullish Engulfing + RSI Breakout📊 PERSISTENT – Technical & Educational Snapshot
Ticker: NSE: PERSISTENT | Sector: 💻 IT Services
CMP: ₹ ▲ (as of 20 Aug 2025)
Rating (for learning purpose): ⭐⭐⭐⭐
Pattern Observed: 📈 Bullish Engulfing + RSI Breakout
PERSISTENT is displaying strong bullish momentum across multiple technical indicators. The presence of a strong bullish candle with Open = Low, combined with an RSI breakout, highlights aggressive buying pressure. A Bullish Engulfing pattern further supports the continuation bias. Meanwhile, the Bollinger Band Squeeze-Off suggests increased volatility with a likely breakout on the upside. Together with a volume-supported move, these signals indicate strength in the trend.
📊 Volume Check:
🔹 Current Volume: 628.85k
🔹 20SMA Volume: 604.21k ✅
💥 Above average – confirming genuine buying interest!
💡 Learnings:
Bullish engulfing + Open=Low candles often signal strong buyer dominance.
RSI breakouts are stronger when paired with above-average volumes.
Bollinger Band squeeze-offs frequently precede powerful directional moves.
Defining pullback areas and invalidation levels helps structure risk management.
Key Levels:
Resistance: 5410 | 5475 | 5580
Support: 5240 | 5135 | 5070
Pullback Level: 5284
Invalidation Level: Close below 5008
STWP Trade Setup:
Entry (Long): Above 5370
Stop Loss: 5173 or below
Reference Levels: 5566 | 5763
⚠️ Disclaimer – Please Read Carefully
The information shared here is meant purely for learning and awareness. It is not a buy or sell recommendation and should not be taken as investment advice. I am not a SEBI-registered investment advisor, and all views expressed are based on personal study, chart patterns, and publicly available market data.
Trading — whether in stocks or options — carries risk. Markets can move unexpectedly, and losses can sometimes be larger than the money you have invested. Past performance or past setups do not guarantee future results.
If you are a beginner, treat this as a guide to understand how the market works — practice on paper trades before risking real money. If you are an experienced trader, remember to assess your own risk, position sizing, and strategy suitability before entering any trade.
Consult a SEBI-registered financial advisor before making any real trading decision.
By reading, watching, or engaging with this content, you acknowledge that you take full responsibility for your own trades and investments.
💬 Found this useful?
🔼 Give this post a Boost to help more traders discover clean, structured learning.
✍️ Drop your thoughts, questions, or setups in the comments — let’s grow together!
🔁 Share with fellow traders and beginners to spread awareness.
✅ Follow simpletradewithpatience for beginner-friendly setups, price action insights & disciplined trading content.
🚀 Stay Calm. Stay Clean. Trade With Patience.
Trade Smart | Learn Zones | Be Self-Reliant 📊

Survive the Market, Keep the Flame AliveThere was once a candle burning in a dark room.
Every night, the darkness surrounded it. The candle felt small, almost useless, compared to the never-ending black. But it kept burning.
At first, the candle thought it had to fight the darkness. It wanted to shine stronger, to push the darkness away. But then it realised something important, darkness never goes away. It will always be there.
The candle could not win against the dark.
Its only job was to survive the night.
Even with a small flame, it could give enough light to walk, to see, to keep hope alive.
Over time, the candle understood: strength was not about fighting. Strength was about lasting.
Trading is very similar.
The market is like the darkness. It is huge, unpredictable, and does not care what you want. You cannot control it.
Your job as a trader is not to fight the market. Your job is to protect your flame, your money, your patience, your discipline.
The traders who last are not the ones chasing big profits every day. They are the ones who protect themselves, who stay calm, and who last long enough to see opportunities.
This game is not about controlling the market. It is about controlling yourself.
Good trading is not exciting. It is simple, repetitive, and sometimes boring. But boring is safe. And safe is what keeps your flame alive.
Wins will come. Losses will come. Neither will destroy you if your flame is protected.
Ask yourself:
Can you protect your money on bad days?
Can you accept small losses without fear?
Can you stay patient when nothing is happening?
The market will always be uncertain. The darkness will always be there.
But if you can keep your light burning, the morning will come.
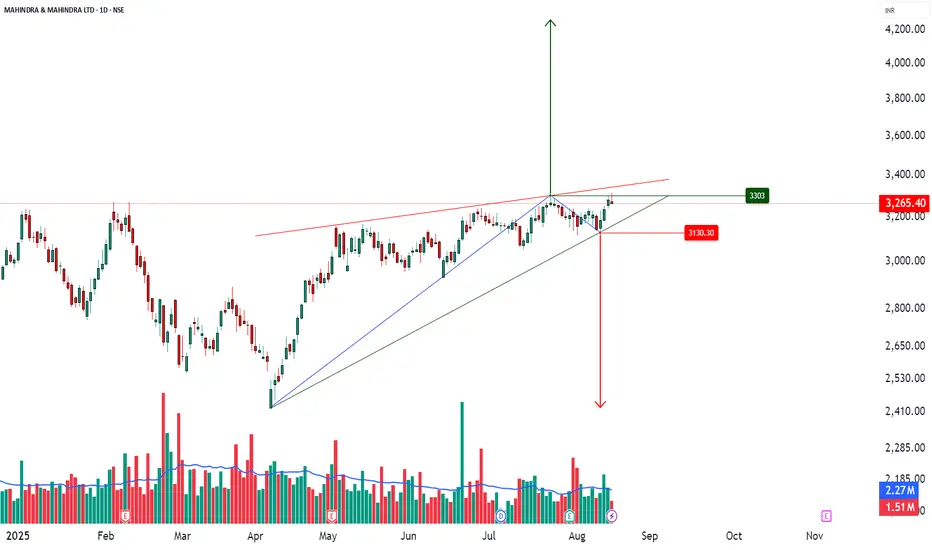
M&M _ Rising Wedge Formation📊 M&M – Technical & Educational Snapshot
Ticker: NSE: M&M | Sector: 🚙 Auto
CMP: ₹2,7XX (as of 16 Aug 2025)
Rating (for learning purpose): ⭐⭐⭐⭐
Pattern Observed: 📉 Rising Wedge Formation (Bearish Reversal Case Study)
🔑 Key Reference Levels (For Learning)
Support / Breakdown Zone: Lower wedge trendline
Resistance / Rejection Zone: Upper wedge trendline
Bearish Projection (Case Study): ~₹2,410
Bullish Continuation (Alternative View): ~₹3,300
📌 Pattern Observations
✅ Price forming higher highs & higher lows but within converging trendlines
✅ Momentum slowing → smaller swings inside wedge
✅ Typical bearish reversal structure (confirmation needed)
✅ Volume + RSI divergence can add conviction
📝 STWP Trade Analysis (Educational Illustration Only)
1️⃣ Bearish Breakdown (Primary Scenario)
Observation: Breakdown below wedge support often studied as bearish signal
Stop Loss (Learning Reference): Above upper wedge / recent swing high
Downside potential: ₹2,410 (measured move projection)
2️⃣ Bullish Breakout (Alternative Scenario)
Observation: Breakout above wedge resistance may lead to continuation
Stop Loss (Learning Reference): Below wedge / recent swing low
Upside potential: ₹3,300
📊 Risk Management & Confirmation
Traders typically wait for daily close outside wedge boundaries
Volume confirmation is key → spikes above average strengthen the move
RSI divergence often adds confidence to the setup
📌 Summary (Learning View Only)
The M&M Rising Wedge is a classic reversal study.
Key lesson: A wedge pattern teaches how slowing momentum can shift market control — but confirmation with volume + price close is essential before validating either direction.
⚠️ Disclaimer – Please Read Carefully
The information shared here is meant purely for learning and awareness. It is not a buy or sell recommendation and should not be taken as investment advice. I am not a SEBI-registered investment advisor, and all views expressed are based on personal study, chart patterns, and publicly available market data.
Trading — whether in stocks or options — carries risk. Markets can move unexpectedly, and losses can sometimes be larger than the money you have invested. Past performance or past setups do not guarantee future results.
If you are a beginner, treat this as a guide to understand how the market works — practice on paper trades before risking real money. If you are an experienced trader, remember to assess your own risk, position sizing, and strategy suitability before entering any trade.
Consult a SEBI-registered financial advisor before making any real trading decision.
By reading, watching, or engaging with this content, you acknowledge that you take full responsibility for your own trades and investments.
________________________________________
💬 Found this useful?
🔼 Give this post a Boost to help more traders discover clean, structured learning.
✍️ Drop your thoughts, questions, or setups in the comments — let’s grow together!
🔁 Share with fellow traders and beginners to spread awareness.
✅ Follow simpletradewithpatience for beginner-friendly setups, price action insights & disciplined trading content.
🚀 Stay Calm. Stay Clean. Trade With Patience.
Trade Smart | Learn Zones | Be Self-Reliant 📊
UNOMINDA - Possible Breakout with Bullish Candle📊 UNOMINDA – Technical & Educational Snapshot
Ticker: NSE: UNOMINDA | Sector: 🚗 Auto Components
CMP: ₹1,149.80 ▲ (as of 16 Aug 2025)
Rating (for learning purpose): ⭐⭐⭐⭐
Pattern Observed: 📈 Possible Breakout with Bullish Candle + RSI/Bollinger Band Confirmation
🔑 Key Reference Levels (For Learning)
Resistance Zones: 1150 – 1165 – 1179 – 1204
Support Zones: 1125 – 1100 – 1085
Reference Pullback Zone: 1068
Risk Reference Zone: 1011
Potential Upside Zones (Educational Projection): 1255 → 1387 → 1456 → 1556
📌 Technical Observations
✅ Bullish candle near resistance
✅ RSI momentum breakout above 64
✅ Bollinger Band expansion → volatility visible
✅ Supertrend in bullish territory
✅ Bollinger Band Squeeze → potential directional move
📊 Volume Analysis
The move was supported by 1.86M volume vs 787.43K (20-SMA) — more than 2× above average.
Such spikes are often studied as signs of institutional participation and momentum strength.
⚠️ Still, follow-through in price action and sustained close above resistance are essential to avoid false breakouts.
📝 STWP Trade Analysis (Educational Illustration Only)
1️⃣ Breakout Illustration
Go Long: 1154/above
Stop Loss (Learning Reference): 1064/below
2️⃣ Conservative Pullback Illustration
Go Long: 1149.80 – 1154 zone
Stop Loss (Learning Reference): 1133/below
3️⃣ Low-Level Pullback Illustration
Go Long: 1145/above
Stop Loss (Learning Reference): 1122/below
(Note: These are structured as learning case studies of how swing setups may be visualized by traders. Not trade calls.)
📌 Summary (Learning View Only)
UNOMINDA provides a good case study in breakout + pullback strategies.
Key lesson: Watch for confirmation above resistance or behavior near pullback zones.
Such structures can be useful when studying swing setups.
Note: A possible breakout with a bullish candle supported by RSI strength and Bollinger Band expansion often signals the start of momentum. However, traders typically wait for volume confirmation and sustained close above resistance to validate the move, as false breakouts are common near key levels.
⚠️ Disclaimer – Please Read Carefully
The information shared here is meant purely for learning and awareness. It is not a buy or sell recommendation and should not be taken as investment advice. I am not a SEBI-registered investment advisor, and all views expressed are based on personal study, chart patterns, and publicly available market data.
Trading — whether in stocks or options — carries risk. Markets can move unexpectedly, and losses can sometimes be larger than the money you have invested. Past performance or past setups do not guarantee future results.
If you are a beginner, treat this as a guide to understand how the market works — practice on paper trades before risking real money. If you are an experienced trader, remember to assess your own risk, position sizing, and strategy suitability before entering any trade.
Consult a SEBI-registered financial advisor before making any real trading decision.
By reading, watching, or engaging with this content, you acknowledge that you take full responsibility for your own trades and investments.
________________________________________
💬 Found this useful?
🔼 Give this post a Boost to help more traders discover clean, structured learning.
✍️ Drop your thoughts, questions, or setups in the comments — let’s grow together!
🔁 Share with fellow traders and beginners to spread awareness.
✅ Follow @simpletradewithpatience for beginner-friendly setups, price action insights & disciplined trading content.
🚀 Stay Calm. Stay Clean. Trade With Patience.
Trade Smart | Learn Zones | Be Self-Reliant 📊

AGI - Breakout Alert – Strong Volume, Clear Trend, Smart Zones! ________________________________________________________________________________
📈 AGI GREENPAC LTD – AGI GREENPAC Breakout Alert – Strong Volume, Clear Trend, Smart Zones! Breakout
🕒 Chart Type: Daily Chart
📆 Date: July 22, 2025
________________________________________________________________________________
📌 Price Action:
AGI GREENPAC has staged a textbook breakout above its rising channel, with a massive +14.83% rally, closing the day at ₹972.35. The price not only cleared a medium-term resistance level but also broke above critical Fibonacci levels, reclaiming bullish control. This is not just a price breakout — it's a structure + volume + indicator alignment, offering a compelling bullish setup with potential for follow-through.
________________________________________________________________________________
📊 Chart Pattern:
✅ Rising Channel Breakout – A bullish continuation pattern formed over several months
✅ Breakout occurred near the channel’s upper boundary with explosive volume
✅ Price cleared 0.5 (₹950.50) and 0.618 (₹1037.15) Fibonacci retracement levels from the prior fall
✅ The structure was backed by a base formation, indicating accumulation beneath resistance. This pattern signals a potential transition from slow ascent to impulsive trend phase — a powerful sign when backed by volume and momentum indicators.
________________________________________________________________________________
🕯️ Candlestick Pattern:
✅ Wide-Range Bullish Candle
✅ Open = Low formation (strength from the first tick)
✅ Strong follow-through above consolidation
✅ Classic “Buy Today, Sell Tomorrow” price action
✅ Confirms structural breakout from channel top
________________________________________________________________________________
🔊 Volume Analysis:
AGI GREENPAC saw a big jump in trading volume, with over 8.7 million shares traded — that’s more than double the usual average of the past 20 days. This kind of volume shows that a lot more people were actively buying the stock, and it wasn’t just a one-time spike — the buying continued throughout the day. What makes this even more special is that it comes after many days of low activity, which often means big investors were slowly building their positions. When such quiet periods are followed by a big volume and price breakout, it usually signals the start of a strong uptrend. Also, this is the highest volume in the past 52 weeks, which gives even more strength to this breakout and shows serious buying interest.
________________________________________________________________________________
📈 Technical Indicators:
The technical indicators are showing strong signs of bullish momentum in AGI GREENPAC. The RSI is at 73, which means the stock is trending strongly and buyers are in control. The MACD, a popular momentum indicator, has given a bullish crossover both on the daily and weekly charts — this is a positive signal that the trend may continue. The CCI, which tracks the speed and strength of price moves, is at 274, indicating very strong upside pressure. The Stochastic is at 93, which means the stock is in the overbought zone, but still confirming the ongoing strength. The price is trading above the VWAP (Volume Weighted Average Price), showing that buyers are dominating the day. Lastly, the stock has broken out of a Bollinger Band squeeze — a setup where the price was moving in a tight range and has now burst out with momentum. When all these indicators point in the same direction, it gives us a high-confidence signal that the breakout is genuine and may continue.
________________________________________________________________________________
🧱 Support & Resistance:
🔻 Supports:
• ₹887.83 – Immediate support (breakout zone)
• ₹803.32 – Mid-structure base
• ₹752.93 – Last support before invalidation
• Bottom Range: ₹599.10 – Historical demand base
🔺 Resistance Zones:
• ₹1022.73 – First resistance (Fibonacci level)
• ₹1073.12 – Previous swing top
• ₹1157.62 – 0.786 Fib level and prior rejection area
• Top Range: ₹1307.90 – Final upside Fibonacci target
________________________________________________________________________________
👀 What’s Catching Our Eye:
What really makes this setup stand out is that everything is coming together at once — and that doesn’t happen often. The stock has broken out of a rising channel, which is a strong chart pattern. It also crossed important Fibonacci levels, showing strength in the move. The volume is more than double the average, which tells us that serious buyers are stepping in. Momentum indicators like RSI and CCI are showing strong upward energy. On top of that, the price has broken out of a tight Bollinger Band range and is staying above VWAP, which adds more strength to the trend. When so many signals align like this, it usually means the stock has a good chance of moving even higher — this is what we call a high-confidence breakout.
________________________________________________________________________________
🔍 What We’re Watching For:
The key thing now is whether the stock can stay above the ₹950–₹960 zone over the next few days. If it does, it will confirm that the breakout is strong and has the potential to move higher. However, if the price dips slightly into the ₹900–₹915 range with low volume, it could be a good opportunity for a safe re-entry. On the other hand, if the stock closes below ₹887, it may be a warning sign that the breakout is failing. This zone is very important — it’s the make-or-break level that will decide if the uptrend continues or fades away.
________________________________________________________________________________
✅ Best Buy Levels (Low Risk Idea):
🔹 Entry: On pullback to ₹861.7–₹864.9 zone with SL ₹848.54
🔹 Low Risk Entry: ₹851.12 with Stop Loss: ₹833.72 (closing basis)
🔹 Risk-Reward: 1:1 | 1:2 +
📌 Avoid chasing — let the price validate the breakout
________________________________________________________________________________
💼 Sector Tailwinds:
AGI GREENPAC is in a business that’s currently seeing strong demand — especially from sectors like real estate, pharmaceutical packaging, alcohol bottling, and FMCG (like food and household products). These industries need high-quality glass and packaging, which is exactly what AGI provides. With growth happening in these areas, the company stands to benefit. This means that the fundamentals are also supporting the chart breakout, making the overall setup even stronger.
________________________________________________________________________________
⚠️ Risks to Watch:
Even though the chart looks strong, there are a few things to be careful about.
First, indicators like RSI and Stochastic show that the stock is in the overbought zone, which means a small pullback or correction is possible. If the price closes below ₹887, it could mean the breakout has failed. Also, if you start seeing red candles with low volume, it might be an early sign that buying interest is fading. Most importantly — don’t invest all your money at once. It's always better to enter with proper risk management and a clear plan, especially after a sharp move.
________________________________________________________________________________
🔮 What to Expect Next:
If AGI GREENPAC stays above the ₹950–₹960 range, it can likely move up to ₹1022–₹1073 in the short term. If the momentum continues and the stock breaks above ₹1073, it could head even higher toward ₹1157–₹1300 in the coming weeks. But if the price drops below ₹887, it could mean the breakout has failed, and the upward trend might not continue. So, the next few days are very important to confirm whether the breakout is real and sustainable.
________________________________________________________________________________
🧠 How to Trade AGI GREENPAC (For Educational Use Only):
🔹 Breakout Plan
• Entry: ₹988.60 or Pullback Zone ₹903–₹915
• SL: ₹842 (Closing basis)
• Risk-Reward: 1:1 | 1:2 +
• Position Sizing: Never all-in — always size by risk
________________________________________________________________________________
⚠ Disclaimer (Please Read):
• These Trades are shared for educational purposes only and is not investment advice.
• I am not a SEBI-registered advisor.
• The information provided here is based on personal market observation.
• No buy/sell recommendations are being made.
• Please do your own research or consult a registered financial advisor before making any trading decisions.
• Trading involves risk. Always use proper risk management.
I am not responsible for trading decisions based on this post.
________________________________________________________________________________
💬 Found this Helpful?
How would you trade this — chase momentum or wait for pullback entry?
👇 Drop your thoughts or questions below
🔁 Share this post with your trading community – let them benefit from clean charts, structured setups, and zone-based learning.
✅ Follow simpletradewithpatience for charts, clean setups, and educational content based on price action, zones, and risk-managed trades.
🚀 Trade with patience, trust your charts, and stay clear-headed!
Be Self-Reliant | Trade with Patience | Learn with Charts & Zones 📊________________________________________
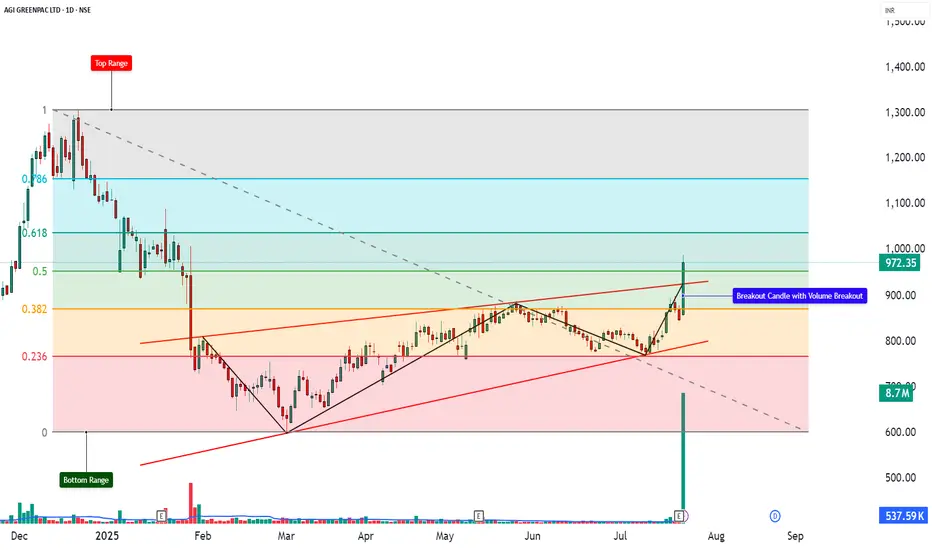
HINDUSTAN UNILEVER LTD – Technical Analysis________________________________________
🧠 HINDUSTAN UNILEVER LTD – Technical Analysis
Ticker: NSE: HINDUNILVR | Sector: FMCG
Current Price: ₹2,521.20 ▲ (+3.44% on July 31, 2025)
Technical View: ⭐⭐⭐⭐ | Chart Pattern: Volume-Driven Range Breakout
________________________________________
Latest News & Developments
Hindustan Unilever (HUL) reported strong Q1 FY26 results, with standalone net profit rising 7.6% YoY to ₹2,732 crore and consolidated profit up ~6%. Revenue grew ~4–5% YoY, aided by a rural demand rebound and volume-led gains in home care and beauty segments. While demand recovery is still gradual and margin guidance has been trimmed, the company is ramping up investments for future growth. A key structural change includes the demerger of its Kwality Wall’s ice-cream business by FY26-end. Leadership transition is also underway, with Priya Nair set to take over as CEO & MD from August 1, 2025. Shares surged 3.5% on July 31 to ₹2,521.85, outperforming the market.
________________________________________
Technical Analysis & Chart Pattern
Hindustan Unilever Ltd (HUL) has broken out above a key resistance zone of ₹2,440–2,445 on the daily chart, supported by strong volume and a bullish candle. This move ends the prior consolidation phase between ₹2,136–2,602. Momentum indicators such as RSI (~70), MACD, and moving averages show a bullish bias. If the price sustains above ₹2,500, the stock may trend toward resistance levels at ₹2,573, ₹2,625, and ₹2,702. Key support levels lie at ₹2,445, ₹2,368, and ₹2,316.
________________________________________
Trade Analysis (SEBI-Compliant | Educational Purpose Only)
As per the chart structure, the stock has shown a breakout above the ₹2,440–2,450 zone on strong volume, currently near ₹2,521. If momentum sustains, potential price zones to watch are ₹2,575–2,625 in the near term and ₹2,700+ in the medium term. A logical risk level could be around ₹2,395 or near the breakout point of ₹2,440.
________________________________________
Technical & Sentiment Snapshot
The stock recently broke out with strong volume, indicating accumulation post-consolidation. A pullback toward ₹2,440–2,430 may test the breakout zone, while a move to ₹2,360–2,316 could signal range re-entry. Sustained trade above ₹2,500–2,520 may indicate trend continuation. Market participants are watching volume behaviour on dips and potential sentiment shifts under new leadership. Key risks include broader market weakness, margin pressures, and rural/urban demand trends.
________________________________________
Educational Insight for Learners
A classic breakout occurs when a stock trades within a defined range (support and resistance) and then moves sharply beyond that range with strong volume. To identify such setups, observe the range boundaries, wait for a confirmed close outside the range, and ensure volume rises on the breakout. Entry is ideally near the breakout, with a stop just inside the range and targets based on the range height. The recent price action in HUL aligns well with this rectangle breakout concept — a valuable pattern for learners to study.
________________________________________
⚠️ Disclaimer & Educational Note
This content is strictly for educational and research purposes only. I am not a SEBI-registered advisor, and no buy/sell recommendations are being provided. All insights are based on personal analysis and experience and are not financial advice.
📘 This setup illustrates how combining price action (candlesticks), support/resistance zones, volume, and indicators like RSI or MACD can help build conviction in trades. However, trading—especially in derivatives like options—involves high risk, and losses can exceed the initial investment.
👉 Always do your own research and consult a SEBI-registered advisor before taking any position.
👉 Use strict risk management and only trade with capital you can afford to lose.
The author assumes no liability for any losses incurred.
By engaging with this content, you agree to these terms.
________________________________________
💬 Found this helpful?
Drop your thoughts, questions, or insights in the comments below ⬇️ — let’s learn together!
🔁 Share this post with your trading friends and community — help them discover clean charts, structured setups, and zone-based learning.
✅ Follow simpletradewithpatience for clear setups, educational content, and a no-nonsense approach to price action, supply-demand zones, and risk-managed trades.
🚀 Trade with patience. Trust your charts. Stay clear-headed.
Because the goal is not just to trade — it's to trade better.
Be Self-Reliant | Trade with Patience | Learn with Charts & Zones 📊
________________________________________

KAYNES TECHNOLOGY IND LTD – Price Action + ZonesKAYNES TECHNOLOGY IND LTD – Price Action + Zones
Ticker: NSE:KAYNES | Sector: Electronics & Semiconductors
Timeframe: 15-Min | Current Price: ₹6,200.00 ▲ (+0.49%)
Technical View: ⭐⭐⭐⭐ | Chart Setup: Breakout with Zone-Based Trade Planning
Kaynes Technology (NSE:KAYNES) has exhibited strong directional momentum following a structured breakout above a prior consolidation range, as seen on the 15-minute chart. The price surged past intermediate resistance near ₹5,990 and is currently stabilizing around ₹6,200, suggesting trend continuation if supported by further volume. Marked zones like the Top Range (₹6,284) and Bottom Range (₹5,405) provide a visual framework to understand price behavior—where strength above upper resistance may invite bullish setups, while failure to hold could signal re-entry into the lower band. A clearly defined demand zone (₹5,850–₹5,764.50) with an example SL near ₹5,755 offers a contextual learning area to study zone-based entries with risk-reward alignment. Observing volume expansion on the breakout and contraction during consolidation is key for interpreting trend strength. The annotation “Trade as per Trend + Supporting Setup” reinforces the importance of directional bias and confluence. All observations are shared to help learners understand breakout structure, demand zones, and price-volume correlation in a real-world context.
⚠️ Disclaimer & Educational Note
This content is strictly intended for educational and research purposes related to the technical study of Kaynes Technology (NSE:KAYNES). I am not a SEBI-registered advisor, and no buy/sell recommendations are being made. All insights are based on personal chart analysis, price-action interpretation, and educational zone-mapping — not financial advice.
📘 The visual setup in this post demonstrates how traders and learners can study breakout structures, demand/supply zones, price-volume behavior, and risk levels in a controlled technical environment. Tools like support/resistance mapping, volume confirmation, and structure-based SL planning help illustrate disciplined trade preparation. However, trading — particularly in leveraged instruments like options or intraday setups — involves substantial risk, and losses can exceed the initial investment.
👉 Always do your own due diligence and consult a SEBI-registered investment advisor before taking any positions in the market.
👉 Practice strict risk management, and only trade with capital you can afford to lose.
The author assumes no responsibility for financial decisions based on this educational content. By engaging with this content, you acknowledge and accept these terms.
💬 Found this helpful?
Drop your thoughts, questions, or insights in the comments below ⬇️ — let’s learn together!
🔁 Share this post with your trading friends and community — help them discover clean charts, structured setups, and zone-based learning.
✅ Follow simpletradewithpatience for clear setups, educational content, and a no-nonsense approach to price action, supply-demand zones, and risk-managed trades.
🚀 Trade with patience. Trust your charts. Stay clear-headed.
Because the goal is not just to trade — it's to trade better.
Be Self-Reliant | Trade with Patience | Learn with Charts & Zones 📊

GODREJ CONSUMER PRODUCTS – Price Action + ZonesGODREJ CONSUMER PRODUCTS – Price Action + Zones
Ticker: NSE\:GODREJCP | Sector: FMCG
Timeframe: 15-Min | Current Price: ₹1,259.00 ▼ (−0.08%)
Technical View:⭐⭐⭐⭐ | Chart Setup: Range Bound Structure with Demand Zone Revisit in Focus
Godrej Consumer Products (NSE\:GODREJCP) is currently trading within a well-defined short-term range, with resistance capped near ₹1,265.50 and an anchored demand zone around ₹1,224.40–₹1,216.90. The stock has shown prior strength with a breakout above ₹1,244.35, but price is now consolidating between the orange mid-range and red supply zone, reflecting indecision. A clean zone-based structure is visible: the Top Range (₹1,265.50) may trigger bullish momentum if breached with volume, while failure to sustain may invite short setups within the range. The mid-structure zone (₹1,244.35) acts as a trend filter, while the green Demand Zone provides a case study for risk-managed entries — with example SL at ₹1,215.75 and mapped risk of ₹8.65. The Bottom Range (₹1,202.20) defines a lower band, and annotations like “Trade as per Trend + Supporting Setup” guide the learner to wait for trend + confluence. This setup is ideal for understanding how price reacts at key zones, how to frame directional bias within ranges, and how demand zones aid structured trade planning with logical stop-loss levels.
---
⚠️ **Disclaimer & Educational Note**
This content is strictly intended for educational and research purposes related to the technical study of Godrej Consumer Products (NSE\:GODREJCP). I am not a SEBI-registered advisor, and no buy/sell recommendations are being made. All insights are based on personal chart analysis, price-action interpretation, and educational zone-mapping — not financial advice.
📘 The visual setup in this post demonstrates how traders and learners can study breakout structures, demand/supply zones, price-volume behavior, and risk levels in a controlled technical environment. Tools like support/resistance mapping, volume confirmation, and structure-based SL planning help illustrate disciplined trade preparation. However, trading — particularly in leveraged instruments like options or intraday setups — involves substantial risk, and losses can exceed the initial investment.
👉 Always do your own due diligence and consult a SEBI-registered investment advisor before taking any positions in the market.
👉 Practice strict risk management, and only trade with capital you can afford to lose.
The author assumes no responsibility for financial decisions based on this educational content. By engaging with this content, you acknowledge and accept these terms.
---
💬 **Found this helpful?**
Drop your thoughts, questions, or insights in the comments below ⬇️ — let’s learn together!
🔁 Share this post with your trading friends and community — help them discover clean charts, structured setups, and zone-based learning.
✅ Follow **simpletradewithpatience** for clear setups, educational content, and a no-nonsense approach to price action, supply-demand zones, and risk-managed trades.
🚀 *Trade with patience. Trust your charts. Stay clear-headed.*
Because the goal is not just to trade — it's to trade better.
**Be Self-Reliant | Trade with Patience | Learn with Charts & Zones 📊**
---

ASIAN PAINTS LTD – Technical Analysis________________________________________
🧠 ASIAN PAINTS LTD – Technical Analysis
Ticker: NSE:ASIANPAINT | Sector: Decorative & Industrial Coatings
CMP: 2,491 ▲ (+1.9%)
Chart Pattern: Symmetrical Triangle Breakout
Technical View: ⭐⭐⭐⭐ (Neutral-to-Positive Setup – Educational Purposes Only)
________________________________________
📈 Technical Overview (For Educational & Informational Purposes Only)
🔹 Pattern Observed:
Price action indicates a breakout from a symmetrical triangle pattern on the daily timeframe – a structure often linked to volatility contraction and potential directional movement. The stock breached the upper trendline near 2,467 with an uptick in volume, indicating possible buyer interest.
🔹 Supporting Indicators:
— MACD: Bullish crossover
— 200 EMA: Price reclaimed above the long-term average
— RSI: Reading near 66, indicating strengthening momentum
— Bollinger Bands: Price broke above upper band + BB squeeze
— SuperTrend: Bullish
— Open = Low: Potential buyer strength
🔹 Volume Context:
Volume during the breakout session was ~2.02M – higher than average, suggesting institutional participation or increased trader interest.
________________________________________
🔼 Resistance Levels (Reference Zones)
R1: 2,518
R2: 2,545
R3: 2,583
🔽 Support Levels (Reference Zones)
S1: 2,452
S2: 2,413
S3: 2,387
________________________________________
📰 News Summary & Sentiment Context (Neutral View)
📌 Earnings:
Q1 FY26 PAT declined ~6% YoY to 1,100 Cr. Revenue slightly lower YoY but largely in-line with expectations. Decorative segment volume grew ~4%, which helped cushion margin pressures.
📌 Demand Trends:
Urban & project-led demand showing signs of recovery. Rural demand is stable. Some macroeconomic caution warranted due to external factors (e.g., job market uncertainties).
📌 Regulatory Update:
The CCI has initiated a probe on alleged market dominance following a complaint. The company has contested the investigation citing procedural inconsistencies.
📌 Market Mood:
Despite regulatory concerns, post-earnings sentiment appears improved. The stock has risen ~5.2% YTD and has been among recent Nifty outperformers.
________________________________________
📚 Educational Insight for Traders & Learners
The symmetrical triangle is a common consolidation pattern formed by converging trendlines. It reflects a balance of power between buyers and sellers. A breakout (especially with volume) can signify renewed directional bias.
In this case, the stock broke out above the resistance trendline, backed by volume and confirmation from technical tools (RSI > 60, MACD, BB squeeze, etc.).
Such breakouts are monitored by traders for swing or positional opportunities, provided risk is managed and external catalysts (like earnings and macro sentiment) are factored in.
✅ Key Reminder: Technical setups should be combined with proper position sizing, exit plans, and broader market context.
________________________________________
🔍 Trade Setup (For Educational Simulation Only)
Trade Details
🔹 Long Entry: ₹2,505.60
🔹 Stop Loss (SL): ₹2,406.55
🔹 Risk-Reward Ratio: 1:1 | 1:2+
Pullback Trade Setup (Optional Re-Entry)
📍 Pullback Entry Zone: ₹2,491.20 – ₹2,505.60
📍 Protective Stop Zone: ₹2,465.87 – ₹2,453.60
📍 Risk-Reward Range: 1:1 | 1:2+
________________________________________
⚠️ Disclaimer (Please Read Carefully):
This content is shared strictly for educational and research purposes only.
I am not a SEBI-registered investment advisor, and no buy or sell recommendations are being made.
All views expressed are based on personal market analysis and experience. They are not intended as financial advice.
Trading — especially in derivatives like options — involves significant financial risk. Losses can exceed your initial investment.
👉 Always do your own research and consult a certified SEBI-registered advisor before making any investment or trading decisions.
👉 Use proper risk management and only trade with capital you can afford to lose.
The author assumes no responsibility or liability for any trading losses incurred from acting on this content.
By engaging with this material, you agree to these terms.
________________________________________
💬 Found this helpful?
Drop your thoughts, questions, or insights in the comments below ⬇️ — let’s learn together!
🔁 Share this post with your trading friends and community — help them discover clean charts, structured setups, and zone-based learning.
✅ Follow simpletradewithpatience for clear setups, educational content, and a no-nonsense approach to price action, supply-demand zones, and risk-managed trades.
🚀 Trade with patience. Trust your charts. Stay clear-headed.
Because the goal is not just to trade — it's to trade better.
Be Self-Reliant | Trade with Patience | Learn with Charts & Zones 📊
