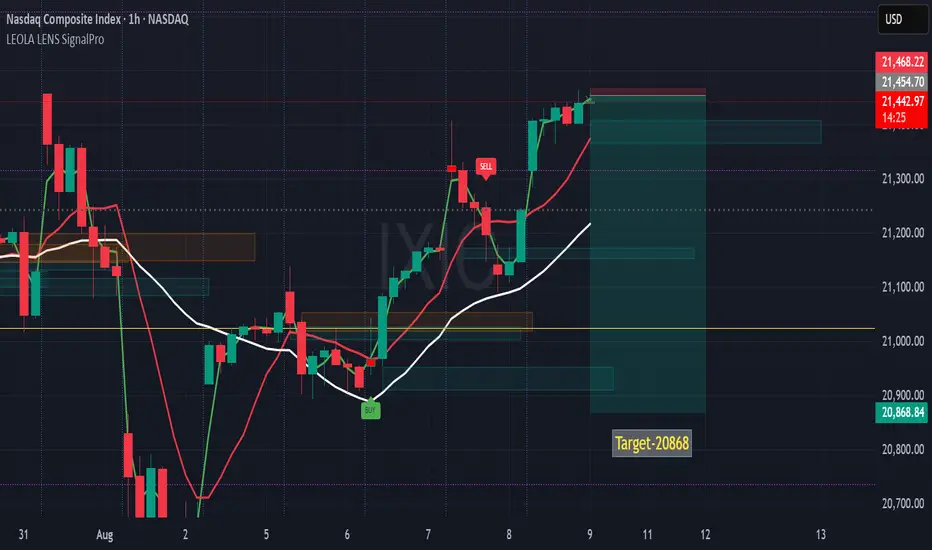
NASDAQ Composite (IXIC)- 1hr Reversal Setup Targeting 20,868This 1-hour chart shows a potential short-term reversal on the NASDAQ Composite, identified using Leola Lens SignalPro.
🔍 Technical Notes:
🟢 Price recently tested the upper red supply zone near 21,454, where prior SELL pressure emerged.
⚪ The white trendline (mid-term bias) is still below price, suggesting a test of resilience before reversal.
🔴 Multiple rejections near the supply zone may hint at exhaustion of buying momentum.
📉 Target: 20,868 — aligning with a prior structural pivot and liquidity zone.
🟡 Watch for confirmation via lower timeframe breakdowns before any continuation lower.
The setup reflects a possible supply-zone reaction after an extended rally, with a measured move toward a lower support zone.
⚠️ Disclaimer:
This analysis is for educational purposes only and should not be taken as financial advice. Always do your own research and consult a licensed financial advisor before making any trading decisions.
Leolalenssignalpro
ETHUSD Lowers High Formation After Recent Peak Eyes 4010📊 Key Observations:
Trend Shift: After peaking near 4,700, ETH rejected strongly with a caution signal at the top, marking a possible exhaustion zone.
Sell Signals: Multiple sell triggers emerged after the top, showing sellers defending resistance levels.
Liquidity Zone: Price is consolidating under the 4,434 – 4,480 area, which is acting as fresh resistance.
Moving Averages: Short-term averages have crossed downward, aligning with bearish momentum.
📉 Current Setup:
Entry region: Around 4,408 – 4,434 (resistance rejection area).
Target zone: 4,009 – 4,040 (highlighted objective area).
Stop level: Above 4,480 (recent supply zone).
🔎 Reasoning:
Lower highs are forming after the recent peak.
Strong sell presence above 4,400s.
Breakdown structure suggests continuation toward the 4,200 handle, with an extended target closer to 4,009.
Market caution markers confirm a potential trend reversal zone already formed earlier.
✅ETHUSD is in a bearish continuation phase unless bulls reclaim 4,480+. Watching the 4,200 and 4,009 levels as key downside objectives.
⚠️ Disclaimer:
This analysis is for educational purposes only and does not constitute financial advice. Always do your own research and manage risk before making trading decisions.

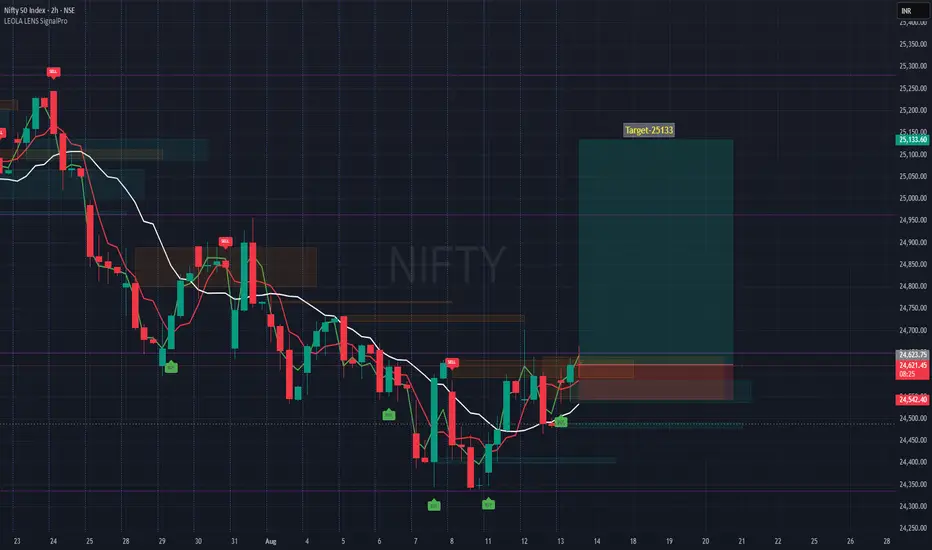
NIFTY Eyes Long on 25133- Bullish Breakout WatchTimeframe: 2-hour (H2)
Entry Zone: Around current breakout level of 24,619
Target: 25,133 – aligns with a prior reaction high and measured move projection from recent swing range.
Stop-Loss: 24,542 – just below the most recent higher low, protecting the setup if momentum fails.
Reasoning:
Price has been forming higher lows since August 7, indicating gradual strength building.
Moving averages have turned upward, confirming short-term trend change.
Previous sell-side liquidity zones have been cleared, reducing overhead resistance until the 25,133 area.
Volume profile shows a gap zone between 24,650 and 25,100, often filled quickly in trending conditions.
Risk Management:
This is a swing-style setup within an ongoing uptrend on the lower timeframe but still needs confirmation from follow-through buying.
Disclaimer:
This chart is for educational discussion only and does not constitute financial advice or a recommendation to trade. Markets carry risk, and decisions should be based on your own analysis and risk tolerance.
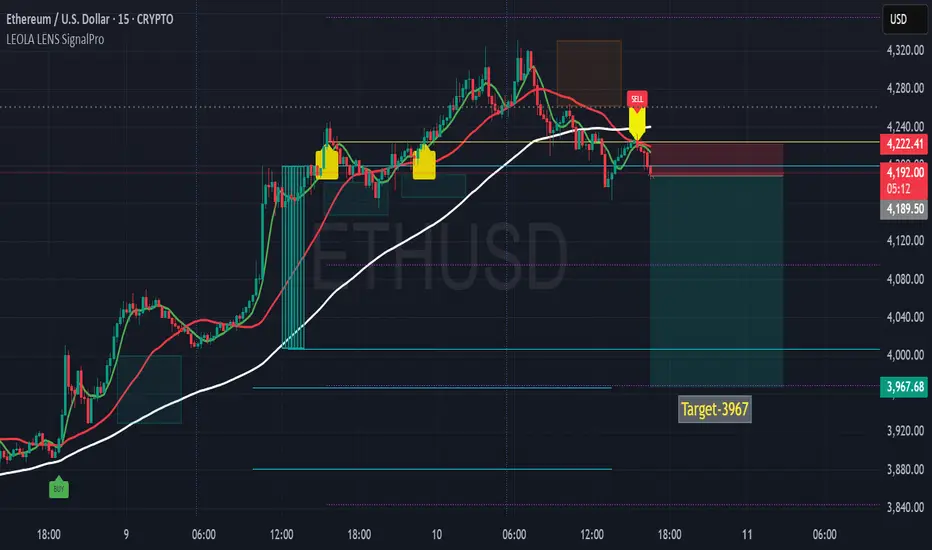
ETHUSD-15MIN SHORT Setup After Supply RejectionThis chart highlights a potential short trade opportunity on ETHUSD following rejection at the overhead supply zone.
Technical Notes:
Yellow caution markers signaled earlier high-probability trend shift points.
Price tested the zone near 4,240, where prior selling pressure emerged.
The recent SELL marker aligned with a break below the moving average, confirming bearish bias.
Liquidity levels below remain untested, offering a possible draw toward the 3,967 target.
Stop-loss placed above recent highs to maintain favorable risk-to-reward.
Bias: Bearish toward target area unless price reclaims and sustains above supply zone.
Disclaimer: This analysis is for educational purposes only and does not constitute financial advice. Trading and investing involve risk, and past performance is not indicative of future results. Always conduct your own research before making trading decisions.
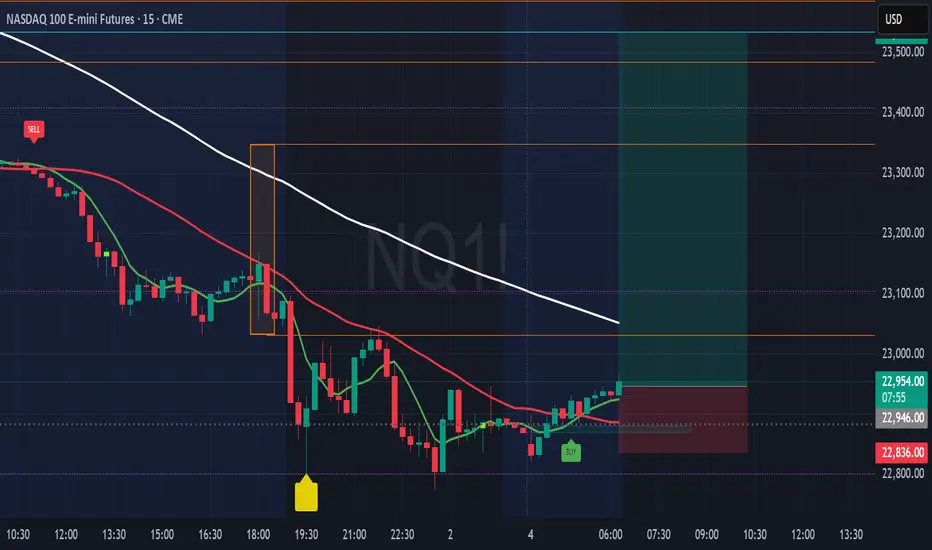
NQ100 - Eyes Long Towards 23531📌 NQ100 Futures 15-min — Buy Signal After Momentum Exhaustion & Trap Zone
Technical Structure Insights (15m):
🟡 A caution label printed near the evening session, highlighting a potential trap zone after short-term buyers were absorbed near the white moving average (trend resistance).
🔻 Price broke lower, completing a strong impulse leg to the downside.
🟢 BUY Signal has since appeared after price based out near 22,830 — coinciding with the purple reaction line.
📈 Current price is climbing back toward dynamic resistance levels (red and white moving averages).
🔍 Price must reclaim and sustain above 23,000 for upward continuation to remain structurally valid.
Otherwise, this may evolve into a lower high setup within the broader trend context.
Disclaimer: This chart is for educational purposes only and does not constitute financial advice. Always perform your own analysis and manage your trading risk responsibly
EURUSD Eyes Short Structure Break📌 EURUSD 15-min — Structure Breakdown After Consolidation Near Resistance
Technical Chart Breakdown (15m):
🔴 SELL Signal triggered after price rejected upper boundary of a tight consolidation box.
🟠 Multiple rejections formed just below 1.158 — suggesting local supply absorption.
🔻 Price broke below the red moving average and consolidation low, confirming momentum shift.
🟡 Leola Lens caution structure (box cluster) marked a potential pause before breakdown.
📉 Downside focus remains valid as long as price stays below 1.158.
🔍 Structural target zone extends toward 1.15, with intermediate reaction levels visible.
Disclaimer: This chart is shared for educational purposes only and does not constitute financial advice or a recommendation to trade. Always conduct your own analysis and manage risk appropriately.
