LIC for 30%+ gainsDate: 5 Oct’24
Stock: Life Insurance Corp of India
Timeframe: Daily
LIC seems to be forming a complex diagonal in Wave V which could end at a minimum level of 1270+ (>30% from current price of 970) as seen in the chart. It could even go higher to around 1400 levels which will be confirmed only as the trend develops.
It seems to have completed Wave B on 4th Oct or may form another lower low to complete it and then move higher in Wave C of V.
This is not a trade recommendation. Please do your own analysis. And I have the right to be wrong.
Aida lagata hai ki LIC Wave V mein ek jatil vikarn bana raha hai jo minimum 1270+ ke star (970 kee maujooda keemat se>30%) par samaapt ho sakta hai, jaisa ki chart mein dekh sakte hain. Yeh lagabhag 1400 ke star tak bhee ja sakta hai jiski pushti trend vikasit hone par hi hogi.
Aisa lagata hai ki 4 Oct ko Wave B poora ho gaya hai ya ise poora karane ke lie ek aur nichala nimn bana sakata hai aur phir V ke Wave C mein oopar ja sakata hai.
Yeh koi trade karne ki salah nahin hai. Kripya apna vishleshan khud karein. Aur mujhe galat hone ka adhikaar hai.
Lic

THE MULTIBAGGER STOCK- RAJESH EXPORTS - 250% GAINWITH Global Leader in Gold business
Rajesh Exports Limited is one of the lucrative stock
REL which is in limelight from the days of fortune 500 list is nearly its 52 week low and the opportunity to its all time high is extreme
LIC holdings in RAJESH EXPORTS are above 10%
wih INDIA's growth story and increasing exports potential supporting the trends
CURRENT PRICE IS AROUND 290
ALL TIME HIGH- 1030
3.5 times from the CMP

LICI BRAKEOUT --- ON DAILY CHART
NSE:LICI
I am buying this stock
Near 1080
And follow sl on 980
My target will be 1280
My risk reward ratio is 1:2
Return on capital 20%

LIC Housing Finance (LICHSGFIN) ATH BREAKOUT.Entry Range: Current price level
Targets:
Target 1: ₹961
Target 2: ₹1290
Stop Loss: ₹729
Trade Rationale:
ATH Breakout : The stock has broken out from its all-time high, indicating strong bullish momentum.
Technical Indicators : Volume
Support Levels : The stock has strong support around ₹729, making it a reasonable stop loss level.
Risk Management : Please make sure position sizing is appropriate to manage risk and follow the stop loss to protect capital.

LICI FOR SHORT My view on this script Bearish.
Target 1 :979
Target 2:966
Stoploss:1010
#Niftyfinance #Lifeinsurancecorporationofindia

Short Term Trading Opportunity in LIC Housing for 10 % UpsideHi,
NSE:LICHSGFIN has given a Bullish Flag Breakout on Daily charts with very good volume.
MACD is also on the bullish side on daily, weekly and Monthly time frames. RSI is also on the bullish side on daily and weekly time frames.
In the current market scenario, I am expecting that the bullish momentum will continue.
Complete price projection like entry, stop loss on Daily Closing basis and targets mentioned on the charts for educational purpose.
Don't Forget to Follow me to get all the updates.
Please share your feedback or any queries on the study.
Disclaimer: Please consult your financial advisor before making any investment decision.

LICI: Channel BreakoutStock is rising in an impulsive manner after giving a breakout of the corrective channel. Stock is likely to extend its gains towards 1080-1100 zone with any weakness holding above the support zone of 940.

LICI TRENDLINE BREAKOUTLICI breaking a trendline resistance
good volume building up
good rsi and MACD crossover
#target 1170,use ur sl
EDUCATIONAL IDEA

Life Insurance Corporation (LIC): 61% upmove possible➡️Narendra Modi Ji's investment tip
➡️a leader with deep competitive MOATs

BANKNIFTY VIEW : WEEK AHEAD The chart indicates a buy signal for the near term.
given that the market saw a significant consolidation rejection at the lower end
support ! @ 45600-45800
next zone: 47350–47600 aREA
Banks that may support = hdfc bank, icici bank ,
neutral: axis bank
weak: kotak bank

Life Insurance Corporation of India | Strong Momentum StockLife Insurance Corporation of India | Strong Momentum Stock
Life Insurance Corporation (LIC) is the largest insurance provider company in India.
Financial: Excellent
Market Cap = 5,26,620 Cr. ROCE = 149 % ROE = 130 %
Debt to equity = 0.00 Promoter holding = 96.5 % Piotroski score = 8.00
Quick ratio = 3.03 Current ratio = 3.03 Profit Var 3Yrs =138 %
Sales growth 3Years =8.26 % Return on assets =0.83 %
This is Strong candidate of multibagger candidate of insurance company.
technically and financially looking excellent.
Note: I am not SEBI registered financial Adviser. I solely present my views on chart .I do not charge any kind of service. This is not buy sell recommendation.
If you like my ideas than like boost and follow me for more ideas.
Thanks and comment freely

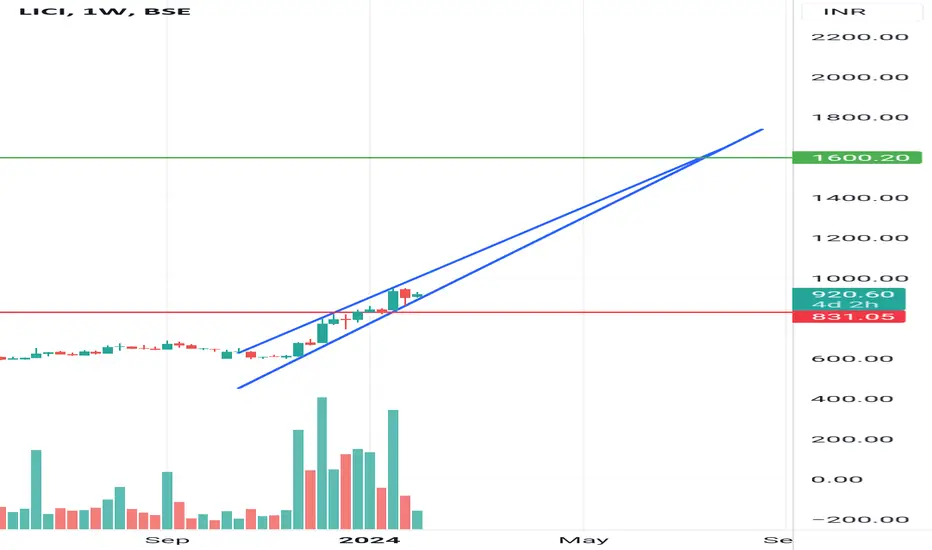
LICI Analysis After a long time, LIC has finally got good positive and a very confident results.
•CMP: 922
•Targets:
-Very Short term target: 950
- Short term target- 980
- Medium Term target 1175
-Long term Target of 1600
You shouldn't miss this Multibagger.
What do you think?
LICI: Preparing for a third waveAFTER A 5-WAVE UPMOVE FROM THE ROCK BOTTOM, PRICES RETREATED BACK LOWER TOWARDS 50% FIBONACCI RETRACEMENT ZONE AND BOUNCE BACK SHARPLY. STOCK HAS GIVEN BIGGEST INTRADAY SINCE IPO.
After a five-wave advance from the rock botom, prices retreated back lower towards 597 which is 50% fibonacci retracement zone. From there stock has bounced back sharply which is the biggest intraday gain since IPO.
We are watching to see a sharp advance in the coming months. A break above 750 shall confirm that stock has started it's third wave and is likely to break the all time high in the coming months.

Life Insurance Corporation, India: Symmetrical triangle breakoutLIC's chart shows a symmetrical triangle breakout with good volume.
Ideal entry on close above 692 looks good on weekly charts.
If it gains momentum and strength, can see it achieve targets of 755 and 850 in short to medium term. And thereafter, its IPO price.
Would be cautious if it falls below 599.
Manage strict stop loss of 5-8% in your trades.
Note: Personal views. Not a buy/sell recommendation. Do consult your advisor.

LICI - Ichimoku BreakoutStock Name - Life Insurance Corporation of India
Ichimoku Cloud Setup :
1). Today's close is above the Conversion Line
2). Future Kumo is Turning Bullish
3). Chikou span is slanting upwards
All these parameters are showing bullishness at Current Market Price
and more bullishness AFTER crossing 826
#This is not Buy and Sell recommendation to any one. This is for education purpose and a helping hand to learn trading in Market.
#CloudTrading
#IchimokuCloud
#IchimokuFollowers
#Ichimokuexpert
I hope you all like my analysis.
Please do share your thoughts into comment section.
Please give a like, share & subscribe for daily analysis.

LICI Ready for next big move.LICI is formed wedge and showing buyers interest forming HH and HL. It has good buying volume today and taken support on lower trendline. Keep this in watchlist.

Life Insurance Corp of India (LIC) BreakOut OpportunityDate : 17-Aug-2023
Rating : Buy
LTP : Rs. 659.65
Target: Rs. 678-->706-->724
SL : 645
NSE:LICI has given a break out from its primary down trend as well as from its resistance level of 650 with increased volume. 7/13/26 DEMA is showing bullish trend. MACD cross over is already done and RSI is showing strength to support bull run.
Disclaimer : I am not a SEBI registered analyst/consultant and not recommending anyone to take any BUY or SELL position in stock market. Investing in stock market is risky and one should do a self analysis and validation before investing in stock market.


LICI Looking Bullish on weekly ChartLICI is showing signs of strength in weekly Charts.
It will be a good buy above 616 level. It can be taken as a Swing trade also. Also RSI is about to cross 50 level. A combo of 616 spot and RSI above 50 will be great indication for buy.
With a SL of 590. Target can be around 650-660.

LIC READY FOR LONG RUNDynamic trendline broken on daily Timeframe
Consolidated for approximately a month in close range
Breakout with volumes
Target can be 600+
SL 550 on daily closing basis

Long LIC target -754 & 846LIC India has formed harmonic pattern on the chart
The stop loss is 540 on closing basis
The target in coming months are marked on the chart.
Final target is 846 once it closes above 754

ICICIPRULI BEST FOR SWING TRADEAs per chart, it looks good entry time for a swing trade
Buy - 412
Stoploss - 385
Target - 466
Time - 25 - 30 Days
Expected returns 10-12%

LIC support and Resistance 2023 LIC Confirm Targets
Support Zone 1 - 650 - 655
Support Zone 2 - 577 - 587
Resistance Zone 1 - 710 - 720
Resistance Zone 2 - 792 - 802
Remark - Buy Near Support Zone and Book Target Near Resistance Zone ,
Stoploss If any weekly Candle Closes Below Support Zone
