$LINK Price Outlook | Is $100+ On The Table? | CryptoPatelBIST:LINK Price Outlook | Is $100+ On The Table? | CryptoPatel
BIST:LINK Is Showing Strong Signs Of A Macro Bullish Reversal After Holding A Multi-Year Support Zone On The 2W Timeframe. The Current Structure Suggests A High-Timeframe Trend Shift That’s Been Building Since The 2021 Top.
Technical Breakdown (HTF):
✅ Breakout And Retest Confirmed
✅ Strong Accumulation Zone: $9 – $12
✅ Holding Above The 0.618 Fibonacci Level ($9.88)
✅ Higher Lows Forming → Macro Trend Turning Bullish
✅ Major Resistance Zone: $25 – $31 (Expansion Trigger)
Upside Targets (CryptoPatel): $31/$52/$90 – $100 (~780% Potential Cycle Move)
Bullish Thesis:
As Long As BIST:LINK Holds Above $7, The Macro Bullish Structure Remains Valid. This Is A Patience-Based, High-Timeframe Setup With A Strong Risk-To-Reward Profile For Spot Positions.
Invalidation:
❌ Weekly Close Below $7
Disclaimer:
Technical Analysis Only. Not Financial Advice. Markets Are Probabilistic—Always Do Your Own Research.
LINKUSDT

LINKUSDT – Trendline Rejection Short Setup (1H)Price has tapped the major descending trendline and is showing rejection signs.
Market structure is still bearish, and price is reacting exactly at the trendline + previous supply zone.
🔎 Trade Idea
Bias: Short
Reason: Price retests descending trendline → shows rejection → aligns with bearish structure
Entry Zone: Current rejection area
Stop-Loss: Above the trendline + previous swing high
Target: Next liquidity zone / previous demand area
🧠 Why This Setup Makes Sense
Trendline is respected multiple times → strong dynamic resistance
Price failed to break structure convincingly
Clean risk–reward setup
Lower highs still intact
Overall market sentiment is neutral-to-bearish
⚠️ Risk Note
This idea is for educational purposes only.
Market conditions can change quickly—manage your risk carefully.

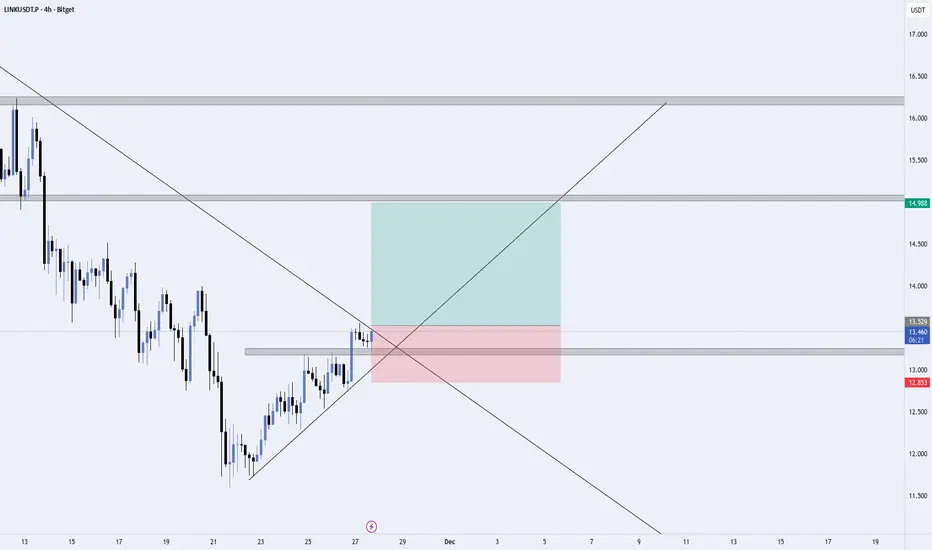
LINK/USDT – Breakout Retest Setup (4H Chart)LINK is showing a potential trend reversal after breaking its major descending trendline.
Price has also retested the previous resistance zone, which is now turning into support.
📌 What I'm Seeing
Strong bullish push from the recent lows
Break above the downtrend line (possible trend reversal)
Price retesting the grey resistance zone, holding as support
Higher-lows on the trendline showing buyers are in control
📈 Trade Plan
Entry: After retest of support (current zone)
Stop Loss: Below the grey zone + below the structure low
Target: The next major resistance around $14.98
This gives a clean Risk-to-Reward setup with structure-based stop and clear target.
🎯 Why This Setup Works
Trendline breakout = first sign of reversal
Retest confirmation shows buyers stepping back in
Market structure is shifting from lower-lows → higher-lows
Clean liquidity zone above, giving bulls room to push
⚠️ Risk Note
Wait for a clean bullish candle before entering.
Crypto is volatile — use proper risk management.
LINK - To The Moon? | 3D Chart AnalysisLINK has pulled back into a strong demand zone between $15.4–$16, aligning perfectly with the ascending trendline support that has held since mid-2023.
The recent wick rejection shows early signs of demand returning — if price holds above this area, we could see a potential mid-term reversal forming.
⸻
📊 Technical Outlook:
• 🔹 Structure: Still maintaining a higher-low formation on 3D
• 🔹 Support Zone: $15.4–$16 — key area for continuation
• 🔹 Trendline Support: Multi-touch ascending trendline intact
• 🔹 RSI: Neutral, room for upside momentum
• 🎯 Targets:
• TP1 → $30
• TP2 → $50
• ❌ Invalidation: 3D close below $15.4
⸻
📈 Bias: Bullish reversal setup – accumulation zone holding strong
🕓 Timeframe: 6 to 9 months

LINKUSD – Waiting for Pullback to Support Before Long EntryLINK was recently rejected at resistance, and we’re now watching for a pullback to confirm support before entering a long spot trade.
🔸 Trade Setup
We are targeting a long spot entry around $21.00 – $21.50, which aligns with prior structure and potential buyer interest. This zone could provide a strong foundation for a rebound if confirmed with price action or volume.
🔸 Targets & Risk Management
Take Profit 1: $27.00 – $31.00
Take Profit 2: $38.00 – $43.00
Stop Loss: Below $19.50
A clean bounce off support with a bullish structure would trigger the setup. Waiting for confirmation is key. As always, manage risk carefully.

Chainlink’s Bull Run: Up 80% After the Dip — Is $100 the Next?Chainlink’s Bull Run: Up 80% After the Dip — Is $100 the Next Target?
If you followed my chart, you likely caught the move.
✅ We entered below $10
✅ It pumped to over $30
✅ Recently dipped near $11 and another good Profit.
It’s still up 80% from our entry zone, and I believe CRYPTOCAP:LINK still has room to grow.
My updated targets: $50 / $75 / $100
Tip: Take some profits along the way and ride the trend smartly.
NFA & DYOR

LINK Long Swing Setup – Higher Low Retest at Key SupportLINK has shown strong relative strength in recent weeks and is now retesting the $12 support zone. With broader markets stabilizing, this level could confirm a higher low and set the stage for continued upside.
📌 Trade Setup:
• Entry Zone: Around $12.00
• Take Profit Targets:
o 🥇 $15.00 – $16.00
o 🥈 $19.00 – $20.00
• Stop Loss: Daily close below $11.00
Chainlink (LINK) – Momentum Shift with Strong EMA ReclaimLINK is showing a clear structural shift, having reclaimed both the 20-week and 200-week EMAs, signaling a potential transition from accumulation to expansion. The recent sweep of liquidity near $14 further strengthens the bullish case.
This setup provides a clean opportunity to enter on retracement to support, with solid upside if the momentum holds.
🔹 Entry Zone:
$13.00 – $13.50 (support + previous liquidity sweep zone)
🎯 Take Profit Targets:
🥇 $20 (HTF resistance)
🥈 $25 (macro range mid/high)
🥉 $30 (prior major resistance)
🛑 Stop Loss:
Daily close below $12.00 (structure invalidation)

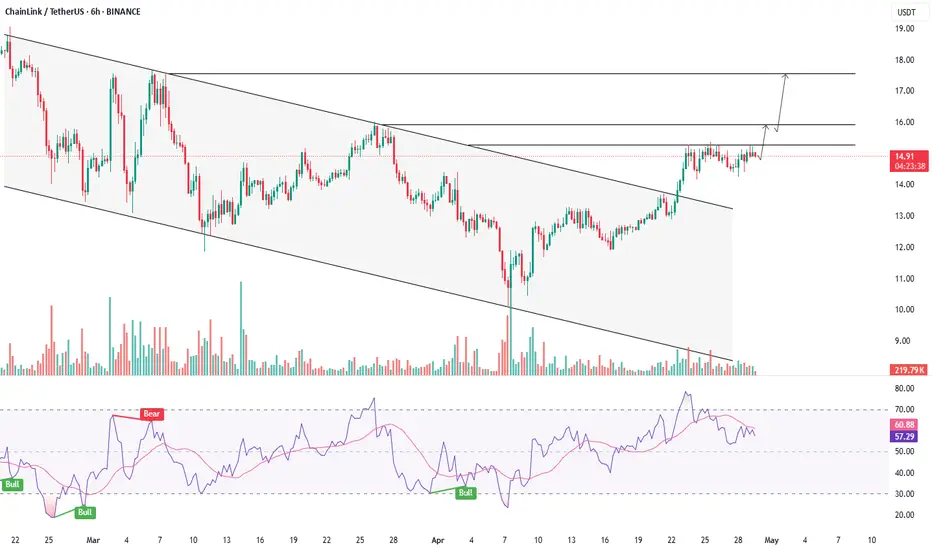
LINKUSDT - CONSOLIDATING NOW, BREAKOUT AHEAD?Symbol - LINKUSDT
CMP - 14.90
LINKUSDT has entered a consolidation phase following its breakout from a downward price channel. This development signals a positive outlook, as it suggests that buyers are accumulating momentum in anticipation of a potential breakout above key resistance levels.
The market has transitioned from a downward price channel to a consolidation phase, with key price levels ranging from 15.27 to 14.40, Bitcoin is exhibiting positive momentum, which, in turn, is supportive of altcoins. Should Bitcoin continue its upward trajectory, particularly after surpassing the 95K threshold, it is likely that the ongoing altcoin season will persist. A breakthrough in LINKUSDT’s resistance level at 15.27 could catalyze further upward movement.
Resistance Levels: 15.27, 15.94
Support Levels: 14.40, 14.26
At present, the performance of altcoins remains largely influenced by Bitcoin, which is benefitting from positive macroeconomic data in both the United States and the global economy. However, for specifically LINKUSDT, attention remains focused on its consolidation phase. If the resistance level at 15.27 is not breached on the first attempt, it is possible that a subsequent retest will yield a successful breakout. Prior to this, the price may test the consolidation support, potentially resulting in a false breakdown, which could create an imbalance favoring buyers. This imbalance, if it materializes, would enhance the likelihood of continued growth and a subsequent resistance breakout, contingent on the persistence of the broader bullish trend.
LINKUSDT HAVING WEAK BULL LEGLINKUSDT current bull leg will reverse but not right now.
15.95 can be a better resistance for mkt to reverse the bull leg

BUY LINKUSDT - Accumulate in the $16-$19 Range🚀 BUY LINKUSDT - Accumulate in the $16-$19 Range
📢 This is a repost of a detailed LINK analysis with additional insights.
📌 Market Overview & Trade Plan
✔ LINK is currently in a weekly timeframe correction, creating an accumulation phase before a major breakout in the M & 3M cycles.
✔ The 3M cycle is expected to resume its strong uptrend soon.
📌 Trade Setup:
Entry Point: 13$ - $16 - $19, or as low as possible.
Target: $50 - $70.
Hold Time: 2 consecutive 3M candles (~6 months).
🔥 LINK is positioning for a major breakout – Secure your spot now! 🚀

LINKUSDTMEXC:LINKUSDT price will like sweep the previous low before we have a pump again
Spot Only
EN: 19.413
SL: 18.34
TP 1: 24.917
TP2: 27.940
TP3: Swing high 30.835
DYOR

LINK/USDT 3x up from our entryLINK/USDT Update: Massive Gains Delivered 🚀
🔹 Entry Zone: $14–$10 ✅
🔹 Current Price: $30.50 (3x from our lower entry )
Chainlink ( CRYPTOCAP:LINK ) has surpassed an $18.5B market cap and hit $30 for the first time since 2021. With its strong utility and growing partnerships, CRYPTOCAP:LINK continues to show incredible potential.
Key Levels to Watch:
▪️ Resistance: $34, $52
▪️ Target: With further adoption, CRYPTOCAP:LINK could potentially reach $100 in this bull run.
Pro Tip: Always book partial profits as you ride the wave.

Is LINKUSDT About to Surge? Yello Paradisers! Could LINKUSDT be on the verge of a major breakout? Here's what we're seeing that could signal a bullish move.
💎LINKUSDT has been trading within a descending channel, but underneath it, a clear W pattern has emerged, increasing the chances of bullish momentum. If LINKUSDT breaks out and closes a candle above the resistance zone, it will confirm both the descending channel and the W pattern, making a bullish move even more likely.
💎On the flip side, if the price pulls back, we might see a potential triple bottom forming at the support zone. For that to happen, though, we'll need confirmation in the form of an I-CHoCH (Internal Change of Character) towards the bullish side.
💎However, if LINKUSDT breaks down and closes below the support zone, it would invalidate the entire setup. Stay vigilant, Paradisers, and be ready to act based on how the market reacts at these key levels.
🎖 Remember, the key to success is patience and discipline. Wait for the highest probability setups to present themselves, and only then make your move. Stick to your strategies, and you'll stay on the path to long-term profitability.
MyCryptoParadise
iFeel the success🌴

This is a good trade Buy LINKUSDT this uptrend season +70% moreThis is how I bought a good position with LINKUSDT in spot without margin.
Following the Main Trend is UPTREND so that only BUY and only use Spot or FUTURE with x3-x5 margin.
My target for LINK this season is ATH

LINK : Next Target 11 USDThe Downtrend Trendline has been Breakout, signaling an Uptrend Continuation with the Next Target at 11 USD.
I want to help People Make Profit all over the World.

LINK's Bullish Shark Pattern: Retest Bounce Targets $23 with 100#Chainlink ( BIST:LINK ) is currently forming a bullish shark pattern, a harmonic pattern that indicates a potential reversal and a strong buying opportunity.
In this scenario, LINK's price is expected to bounce with retest of a crucial support level. The RSI (Relative Strength Index) has reached the oversold area, suggesting that the asset is undervalued and may soon experience a reversal.
If LINK successfully retests the support level and bounces, the bullish momentum could propel it to a significant target of $23. This move would represent an almost 100% return from the current price level.

#LINK/USDT Primed for $30: Bullish Patterns and Key Levels#Chainlink (LINK) is currently undergoing a critical retest of its support level, setting the stage for a potential bounce towards the $30 target. This retest is a significant technical event, as it provides traders with an opportunity to assess the strength of the support and the likelihood of a bullish reversal. Here's a detailed analysis of #LINK/USDT's current situation and the anticipated move to $30.
Immediate Resistance – $25: Before reaching the $30 target, LINK/USDT will likely encounter resistance around $25. This level could act as a short-term hurdle, and breaking above it would pave the way for higher prices.
Primary Target – $30: The main target for this bullish scenario is $30. Reaching this level would signify a substantial gain from the current price and align with the broader market trend.

Link/Chainlink USDT Trade Idea - Link followed my second path where it trapped a lot of late buyers evaporated BSL and came back to the point of origin and shooter up again
- If you are interested in buying Link then I would highly recommend you guys to wait because the RR as per the current price doesn't look good
- 12-14$ can act as a very good range or accumulation zone if you want to buy Link.

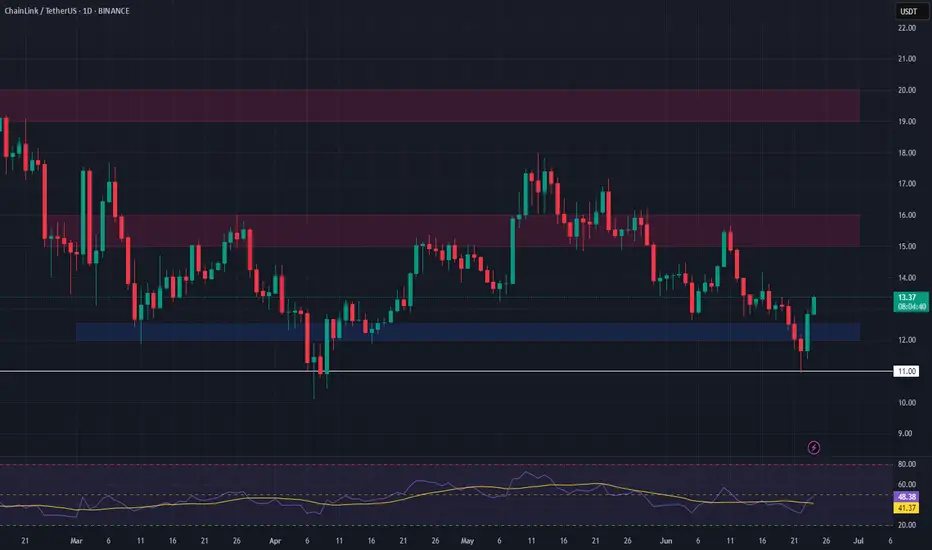
#LINK/USDT Faces Downward Pressure: High Plunge Risk#LINK/USDT situation, including the potential retest levels and technical indicators:
#LINK/USDT Analysis: Bearish Divergence and Decreasing Volume Suggest Potential Retest Levels
#Bearish Divergence
Bearish divergence occurs when the price of an asset continues to make higher highs, but a technical indicator, such as the Relative Strength Index (RSI), makes lower highs. This divergence indicates that the upward momentum is weakening and that a potential reversal or pullback could be imminent.
For #LINK/USDT, we have identified a clear bearish divergence on the daily chart. Despite Chainlink’s price increasing, the RSI is not following suit, signaling that the buying pressure is diminishing. This divergence is a strong indicator that the current uptrend might not be sustainable.
#Decreasing Volume
In addition to the bearish divergence, there is also a notable decrease in trading volume. Volume is a critical indicator of market strength, and a declining volume during an uptrend often suggests that the momentum is fading. This decrease in volume can indicate a lack of conviction among buyers, which may lead to a price decline.
#Potential Retest Levels
Given these technical indicators, it is likely that LINK/USDT might retest certain key support levels:
1. **Retest Around $15.20**
- This level has acted as a significant support in recent trading sessions. If Chainlink’s price retraces, it is likely to find initial support around $15.20. If the price manages to hold at this level, we might see a temporary bounce or consolidation.
2. **Retest Around $14.40**
- If the $15.20 support level fails to hold, the next critical support level to watch is around $14.40. This level has historical significance and could act as a stronger support. A retest at this level would be crucial in determining whether LINK/USDT will stabilize or continue its downward trend.
#Trading Strategies
- **Cautious Approach**: Given the bearish divergence and decreasing volume, traders might consider adopting a cautious approach, possibly reducing their positions or waiting for confirmation before entering new trades.
- **Stop-Loss Orders**: Setting stop-loss orders just below the identified support levels ($15.20 and $14.40) can help mitigate potential losses in the event of a further decline.
- **Watch for Confirmations**: Look for confirmations such as bullish reversal patterns or increasing volume at the support levels before considering long positions.
### Conclusion
LINK/USDT is currently showing signs of potential weakness with a clear bearish divergence and decreasing volume. Traders should be prepared for possible retests at $15.20 and $14.40. Monitoring key technical indicators and market sentiment will be crucial for making informed trading decisions during this period.

LINKUSDT: Potential Reversal in Progress!🚀💎 Paradisers, #LINK has broken out of the resistive trendline and is beginning to show signs of a reversal.
💎 If #LINKUSDT breaks above the resistance zone, it will confirm the breakout of a triple bottom pattern, enhancing the probability of a bullish move.
💎 In the case of a pullback, we can expect a bounce from the demand zone, but note that the probability of success is lower than the breakout of the triple bottom, so manage your risk carefully.
💎 However, if the price breaks down below the demand zone, it will invalidate the bullish signs. In that case, it would be better to wait for more favorable price action to develop.

Analyzing Bullish Divergence: #LINK/USDT Set for Upward Momentum#LINK/USDT Technical Analysis: Bullish Divergence Signals Potential Upside
The #LINK/USDT pair has formed a bullish divergence pattern, suggesting a potential upward movement in the near term. Currently bouncing, it aims to retest the $14.1 level as its immediate resistance.
Should the price manage to surpass this level and breach the liquidity area, further gains towards $15.1 are anticipated. Traders are advised to closely monitor the price action for confirmation of bullish momentum and potential entry opportunities.
Disclaimer: This analysis is for educational purposes only and does not constitute financial advice. Traders should conduct their own research before making any investment decisions.

#LINK/USDT Shows Strength with Bullish Divergence#LINK/USDT has recently formed a bullish divergence pattern, indicating a potential trend reversal. The price is now bouncing back towards the resistance area around $15.20. If LINK/USDT breaks above this resistance, we could see a continuation of the upward trend, potentially leading to new all-time highs.
The bullish divergence, coupled with the bounce from key support levels, suggests a strengthening bullish momentum in the LINK/USDT pair. Traders should keep a close eye on the price action around the $15.20 resistance level, as a successful breakout could signal further gains in the near term.
However, it's important to exercise caution and wait for confirmation of the breakout before entering any trades. Factors such as market sentiment and overall cryptocurrency market conditions should also be taken into consideration when making trading decisions."
