Smart Money Liquidity Trap Explained⭐ Smart Money Liquidity Trap Explained
✨ A deep dive into how institutions manipulate price before major moves ✨
In every financial market — Forex, Crypto, Stocks, Indices — price doesn’t simply move at random. Behind the scenes, Smart Money (institutions, banks, hedge funds) engineer setups that allow them to enter positions at the best possible price. One of their most effective tools is the Liquidity Trap.
Let’s break it down beautifully and clearly. 👇
🔥 What Is a Liquidity Trap?
A Liquidity Trap occurs when Smart Money deliberately pushes price into areas loaded with:
❌ Stop-loss orders
📉 Sell-side liquidity
📈 Buy-side liquidity
😰 Emotional retail entries
🔥 Breakout traders placing pending orders
These areas become liquidity pools — perfect fuel for institutions to fill their massive positions.
Retail traders think it’s a breakout…
But Smart Money thinks:
➡️ "Thank you for the liquidity."
🧩 How Smart Money Creates the Trap
1️⃣ Phase 1: Build the Setup
Smart Money guides price slowly toward an obvious level:
A clean high
A clean low
A trendline
A double top/bottom
Retail traders get excited:
📢 “Breakout coming!”
But institutions are simply gathering attention.
2️⃣ Phase 2: The Liquidity Grab ⚡
Price spikes violently above/below the obvious level.
This move triggers:
🟥 Stop-loss hunts
📉 Forced liquidations
💥 Breakouts that fail instantly
This sudden spike gives institutions the liquidity needed to place large buy or sell orders without causing massive slippage.
This is why the spike is often fast and dramatic.
3️⃣ Phase 3: The Real Move Begins 🚀
After the liquidity is collected, price reverses sharply.
This is the moment Smart Money actually commits to the real direction.
Retail traders feel:
🤯 “Why did it reverse?!”
😭 “I got stopped out for nothing!”
😵 “The breakout was fake!”
But Smart Money simply executed their strategy perfectly.
🎯 How to Use Liquidity Traps in Your Trading
Study where retail traders commonly place:
⛔ Stops
📌 Breakout orders
❗ Predictable entries
Then wait for the fast liquidity grab followed by:
A displacement 🎇
A sharp wick rejection
A structure shift (CHoCH / BOS)
These signals often reveal the true direction of the upcoming move.
💡 Key Features of a Smart Money Liquidity Trap
✨ Sudden spike into obvious areas
✨ Fast liquidation and stop-hunting behavior
✨ Sharp wick rejections
✨ Structure shift after the spike
✨ Smooth continuation in the real direction
🚀 Why This Concept Is So Powerful
Recognizing liquidity traps allows you to:
❌ Avoid fake breakouts
🛡️ Protect yourself from stop-hunts
🎯 Enter the market at premium/discount levels
🤝 Align with Smart Money
💼 Improve long-term consistency
This is how professional traders stay on the right side of volatility — by understanding why the market moves, not just where it moves.
Liquiditygrab

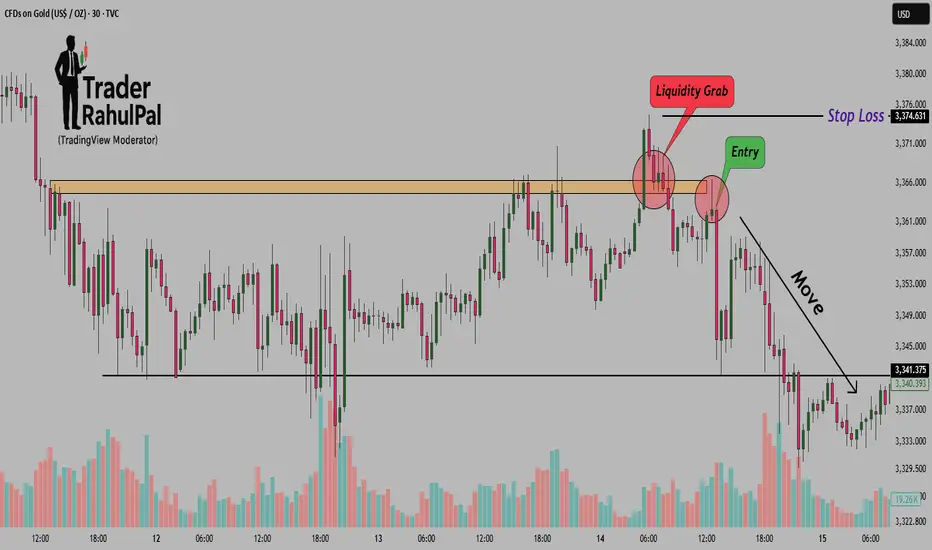
GOLD PULLBACK BEFORE FINAL LEG DOWN🧭 DAILY TRADING PLAN – GOLD (XAU/USD)
📅 Date: Nov 04, 2025
📊 Main timeframe: H2 confirmation + M30 execution
🎯 Strategy: SMC + Liquidity Grab + OB Rejection
MARKET CONTEXT
Gold is currently trading around the 3970 zone after a clear Break of Structure (BOS) on the M30 timeframe, confirming short-term bearish pressure. On the H2 chart, price remains in a descending channel, forming lower highs since 4128 → 4006, aligning with overall bearish sentiment.
Recent CHoCH signals on M30 indicate that buyers tried to defend the 3980–3970 area twice but failed to sustain momentum. Liquidity was swept below minor lows, suggesting a potential continuation toward deeper liquidity pools near 3960–3955.
KEY LEVELS
SELL ZONE 1: 4025–4027
SELL ZONE 2: 4011–4013
BUY ZONE 1: 3980–3978
BUY ZONE 2: 3970–3968
TRADING IDEA
Current bias: Bearish, expecting a pullback before continuation.
If price retraces to 4011–4027, watch for rejection and BOS on M5/M15 to enter short.
TP1: 3978, TP2: 3960
SL: above 4027 (≈6 points)
Alternatively, if price sweeps liquidity below 3968 and shows strong CHoCH upward, consider scalp long back to 3980–3990, with SL below 3962 (≈6 points).
CONFIRMATION
M30: BOS down confirmed after CHoCH
H2: Resistance zone rejection aligning with trendline + EMA confluence
RSI showing mild bearish momentum, not yet oversold → room for downside continuation
OUTLOOK
As long as price remains below 4027, the bearish structure holds. Watch for liquidity grabs at support zone 3960–3970 before a potential short-term retracement. A clean break above 4030 would invalidate this plan and flip bias to neutral.
📌 Plan Summary
🎯 Sell the pullback at 4011–4027
🎯 TP: 3978 / 3960
🛑 SL: 4027 (6 points)

The Secret of Liquidity Grab – Why Price Hunts Highs Before FallHello Traders!
Have you ever noticed how the market first breaks a recent high, traps breakout traders, and then suddenly reverses? This is not random, it’s called a liquidity grab .
Understanding this concept can completely change how you see price action.
1. What is a Liquidity Grab?
Liquidity means orders in the market, stop losses, buy orders, sell orders.
When price hunts a previous high or low, it triggers stop losses and pending orders. This creates a sudden burst of liquidity.
Institutions use this liquidity to enter or exit large positions without causing slippage.
2. Why Price Hunts Highs Before Falling
At previous swing highs, many breakout traders place buy orders and short sellers place stop losses.
When the price spikes above that level:
Breakout traders enter long positions.
Short sellers’ stop losses get triggered (buy orders).
This creates a pool of buying liquidity. Once institutions have sold into this buying pressure, price often reverses sharply.
3. Why This Matters for Retail Traders
Most retail traders get trapped during these liquidity grabs.
They either chase breakouts too late or panic exit at the wrong time.
By recognizing this pattern, you can avoid being the liquidity and instead trade with the smart money.
4. How to Use This in Trading
Wait for the Grab: Don’t rush into a breakout. Wait to see if price quickly reverses after taking out a high/low.
Confirm With Volume: A liquidity grab often shows a sudden spike in volume followed by an opposite move.
Look for Rejection Candles: Pin bars, engulfing candles, or sharp wicks at highs/lows confirm the trap.
Rahul’s Tip:
Next time you see price breaking a high, don’t get excited. Ask yourself, is this a real breakout or just a liquidity grab? Waiting a little longer often saves you from being trapped.
Conclusion:
Liquidity grabs are the hidden traps of the market. Price doesn’t move randomly, it seeks liquidity first.
By understanding this, you can avoid becoming the victim and instead align yourself with the institutions.
If this post gave you clarity on liquidity grabs, like it, share your thoughts in the comments, and follow for more smart price action insights!
M&M Short term Swing trade with 1:3.5 RRIf Nifty holds its current level of 24,600 and is not bearish for next two-three trading sessions then
there are high chances that this setup will work and buyers will take control in M&M.
It is a supply & demand + Trend + Liquidity Trap based setup.
The setup looks good but the only concern is the overall market sentiment so take your risk accordingly.
Good Risk to Reward for first Target is 1:3.5
Let me know if you have any questions or doubts.
Happy to help!
Gaurav.

GBP/USD Technical Insight – Reversal Opportunity from Demand GBP/USD Technical Insight – Reversal Opportunity from Demand Zone
The GBP/USD chart showcases a classic liquidity sweep and bullish reaction from a clearly defined support zone (1.3360 – 1.3400). After an extended bearish move, price entered the demand area, rejected strongly, and formed a potential bullish reversal setup, signaling a possible move toward the resistance zone near 1.3740 – 1.3800.
The use of Supertrend Indicator confirms a shift in market structure, supporting the bullish bias. This setup reflects a textbook example of smart money behavior — where price mitigates imbalance, grabs liquidity, and rallies from institutional zones.
⸻
🧠 Educational Key Points:
• Support & Resistance Zones are well-respected.
• Trend Shift confirmed after long accumulation.
• Liquidity Engineering: Market makers swept the lows before reversing.
• Confluence of Structure + Indicator adds high-probability confidence.
📌 Potential Trade Idea:
Buy from the support zone with targets near resistance; manage risk below the support zone for precision.

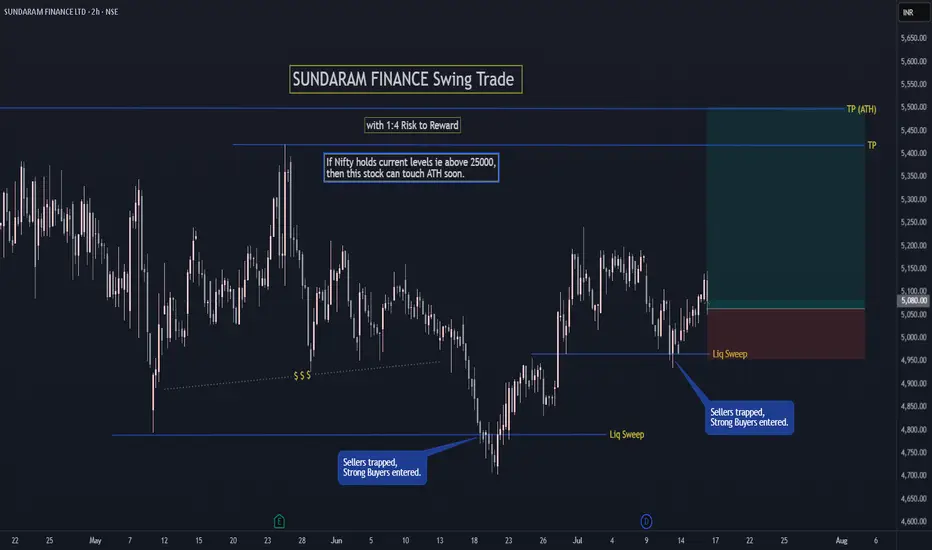
SUNDARAM FINANCE Swing TradeIf Nifty holds current levels ie above 25000,
then SUNDARAM FINANCE can touch ATH soon.
FOLLOW for more such simple swing setups.
Let me know in comments if you have any doubt or questions.
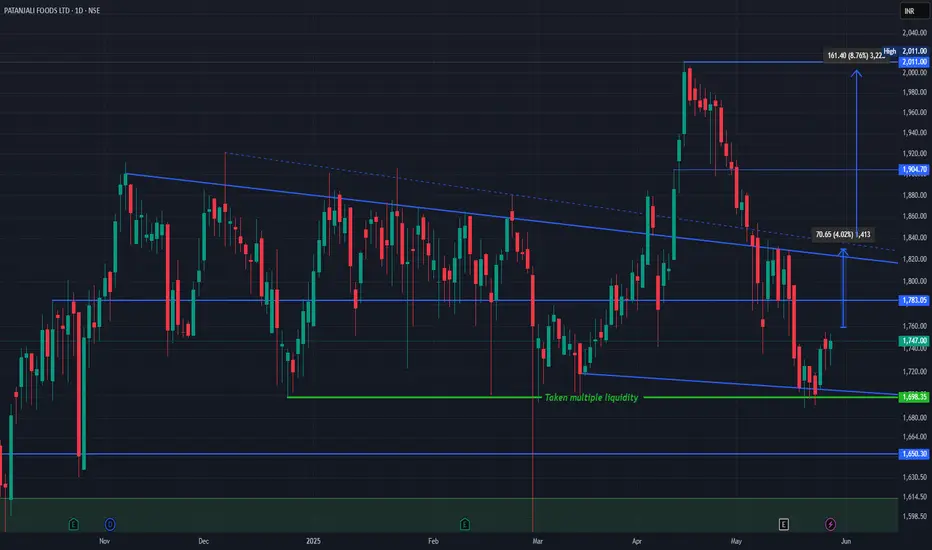
Patanjali Foods Ltd (NSE: PATANJALI) technical chart breakdown.Patanjali Chart Structure & Price Action
The stock has been trading within a descending channel, bounded by the blue trendlines.
It recently bounced from a major demand zone (~₹1,698) marked by the green support line that has absorbed liquidity multiple times ("Taken multiple liquidity").
Price is now slowly recovering from this base.
Current Scenario
CMP: ₹1,747
Immediate Resistance:
₹1,783 (horizontal level)
₹1,818–₹1,835 zone (upper boundary of the falling channel)
Break and sustain above ₹1,783–₹1,835 could trigger a trend reversal.
Upside Targets
Target 1: ₹1,830/Target 2: ₹1,904
Previous structural high Target 3: ₹2,011 Recent swing high Total upside from breakout: ~8.76%
Support Levels
₹1,698 – Critical demand zone (green)
₹1,650 – Next strong support
₹1,570 – Long-term support base (green zone)
Simple Explanation
Patanjali Foods rebounded from a high-liquidity support area and is now showing signs of bullish recovery. A breakout above ₹1,783 could take it back to the ₹1,900–₹2,000 range. Risk is well-defined below ₹1,698. Watch for volume and price action confirmation near the upper channel.
Like, comment your thoughts, and share this post
Explore more stock ideas on the right hand side your feedback means a lot to me!
Disclaimer: This post is for educational purposes only and should not be considered a buy/sell recommendation.
Why Market Moves Against You After Entry–It’s Not a Coincidence!Hello Traders!
Ever felt like the moment you enter a trade, the market just turns against you? You’re not alone. Today, we’ll break down why this happens and how you can avoid getting trapped. This common phenomenon is not just bad luck — it’s often a result of liquidity hunting, stop-loss triggering, and retail behavior predictability .
The Real Reason Behind Entry Reversals:
Liquidity Zones Near Obvious Entry Areas: Most traders enter at breakout or breakdown levels with tight stop-losses. Market makers and institutions know this and target these zones to fill their large orders.
Stop-Loss Clusters = Opportunity: When many traders place SLs at the same level, it creates a liquidity pool. Big players trigger these to generate volatility and enter at better prices.
Retail Predictability: Most traders use similar strategies – entering on breakout candles, using fixed SLs, or chasing momentum. Algos are trained to identify these patterns and act accordingly.
No Confirmation Entry: Entering without waiting for confirmation — like candle close, volume spike, or retest — increases the chances of being trapped.
How to Avoid Getting Trapped:
Don’t Enter at Obvious Levels: Instead of breakout candle entry, wait for retest or structure confirmation.
Use Liquidity Awareness: Identify where other traders may be placing SLs — avoid entering right before those levels.
Watch Volume and Price Behavior: Sharp moves on low volume are often traps. Entry should align with volume strength.
Wait for Retests: A retest after breakout/breakdown gives better R:R and filters out fakeouts.
Conclusion:
The market isn’t random — it’s designed to hunt the predictable. If you want to stay ahead, start thinking like the smart money. Avoid entering at the obvious point, understand where liquidity lies, and build a habit of confirmation-based trading.
Have you ever faced a market reversal just after your entry? Let’s talk about your experience and how you manage such traps in the comments below!

How Brokers, Market Makers & Algos Trigger Your Stop-Loss!
Hello Traders!
Ever felt like the market hits your stop-loss and then flies in your direction? You’re not alone. It’s not always a coincidence. Today, let’s decode how brokers, market makers, and algorithms hunt retail stop-losses and how you can protect yourself by trading smarter.
The Hidden Game Behind Stop-Loss Hunting
Liquidity Pools Below Swing Lows/Highs:
Retail traders often place stop-losses near obvious support and resistance. Smart money knows this — they create a quick fake move to trigger these levels and grab liquidity.
Algos Detect Retail Patterns:
Algorithms scan chart structures, volume profiles, and order book imbalances. If too many stop orders sit below a zone, algos exploit it with a quick flush.
Market Makers Need Orders:
They profit from spreads and volume. By triggering stops, they fill larger institutional orders or create better entry zones for big players.
How to Avoid Getting Trapped
Avoid Obvious SL Placement
→ Don’t place stops right at swing low/high or support/resistance — give it a little buffer.
Use Structure-Based Stops
→ Place SL where your trade idea is invalidated, not just where price might come.
Wait for Confirmation, Not Impulse
→ Enter after a strong confirmation candle or retest. Don’t jump in just because price touches a zone.
Watch for Liquidity Grabs
→ If price quickly breaks support and reverses — it’s likely a trap. Mark that level as a future opportunity zone.
Rahul’s Tip
“Algos aren’t evil — they’re just smarter. So be smarter too. Stop-loss hunting is real — but if you trade with structure and logic, they can’t touch you.”
Conclusion
The market isn’t always random. There are systems, patterns, and traps designed to shake out weak hands. Understanding how stop-loss hunting works can help you survive longer and trade smarter . Trade like a sniper, not like bait.
Have you ever been stop-hunted? Share your story in the comments — let’s help each other grow!
If you found this post valuable, don't forget to LIKE and FOLLOW !
I regularly share real-world trading setups, actionable strategies, and learning-focused content — all from real trading experience, not theory. Stay connected if you're serious about growing as a trader!

WILL BUY THE DIP SUPPORT BULLS & CAN BTC RECOVER TO 71K ?Earlier I discussed about double top pattern in making & captured the great free fall of more than 7,000 points.
Now, Bitcoin can be seen taking support at important levels. Bitcoin is experiencing times of high fear, high volatility and negative sentiment among the traders. From a psychological point of view, this could end in a bullish momentum as I have seen in the past that such high volatility usually lead to trend reversal.
For now, big buyers are actively holding back a possible fall amid transfers of the previously hacked crypto exchange to its debtors and BTC sell-offs by German authorities.
In April, the average cost of BTC mining among the largest public miners was $53,000, technically, the level of average cost of BTC mining plays the role of an intermediate bottom.
Judging by the growth of volumes and price entry into the area of the lower boundary of the "Flag or Megaphone" pattern, buyers appear on the market and at the moment stop the price fall, forming a sideways range of 53500-58500.
Accordingly, a breakdown of one of the boundaries may trigger an impulse to one side or the other, based on the technical nuances there is a probability that there will be an attempt to break the resistance.
Fundamentally, the environment is difficult due to news flow, but investors are waiting for the approval of ETH-ETF, which may bring back the bullish mood to the market (indirect impact on BTC). Technically, the emphasis is on the range. A break of 58500 will give bullish momentum, a break of 53500 may allow the price to decline to the 50500-51000 risk zone
We can only analyze and make a trading decision but only the time will tell whether is it headed to 71K or below 50K.

Liquidity Grab on PELAs the Market Improves and gives a bullish sentiment, PEL has formed a beautiful bear trap and gives a long possibility once the support zone is re entered.
Liquidity Grap- Is a smart money concept similar to stop loss hunting where the market gives a fake breakdown on low volume or a bad spread candle as visible here. The stops of many retail traders are hit as the market bounces back and takes off
Entry at 800
Target at 897
Stop loss 761
Keep It Simple

GOLD LongSetup Contains:
1. Liquidity Grab
2. Break of Structure
3. Order Block
4. FIBO Retracement 0.71%
FOLLOW PAFX & LEARN AND EARN 💸

EURUSD Short ProjectionSetup Contains:
1. Daily Liquidity Grab
2. LTF confirmation
3. Break of Structure
4. Return To OrderBlock
FOLLOW PAFX & TRADE LIK E BANKS 💸


EURGBP Sell ProjectionSetup Contents:
1. Higher Time Frame OrderBlock
2. Lower type of refinement
3. Stop Hunt+Break of Structure

Swing failure pattern ideaMy next trade im looking for a Stophunt / Swingfailure pattern/ liquidity grab , enter with confirmation, Step 1 Trapped shorts Step 2 Demand showing up. enter with starting position. and step 3 market structure change now the swing faillure pattern is confirmed and i can add more to my trade to trade it up to one of the horizontals levels i marked out.
Any questions? i will awnser them in the comment Section!
