LTCUSD $65.00 major weekly supportLitecoin is struggling to move higher on Wednesday, as the sixth largest cryptocurrency by market capitalization failed to rally alongside Bitcoin on Tuesday. The LTCUSD pair is still trapped within a bullish descending triangle pattern on the daily time frame. Overall, the LTCUSD pair still has a bullish weekly trading bias above the $65.00 level, which is the neckline of the large inverted head and shoulders pattern.
The LTCUSD pair is only bullish while trading above the $65.00 level, key resistance is found at the $85.00 and $100.00 levels.
If the LTCUSD pair trades below the $65.00 level, key support is found at the $50.00 and $45.00 levels.
Litecoin (Cryptocurrency)

A trading opportunity to buy in LTCBTCMidterm forecast:
0.01315 is a major support, while this level is not broken, the Midterm wave will be uptrend.
Technical analysis:
While the RSI uptrend #1 is not broken, bullish wave in price would continue.
A peak is formed in daily chart at 0.01890 on 04/03/2019, so more losses to support(s) 0.01430 and minimum to Major Support (0.01315) is expected.
Price is below WEMA21, if price rises more, this line can act as dynamic resistance against more gains.
Relative strength index (RSI) is 40.
Trading suggestion:
. There is a possibility of temporary retracement to suggested support zone (0.01430 to 0.01315). if so, traders can set orders based on Price Action and expect to reach short-term targets.
Beginning of entry zone (0.01430)
Ending of entry zone (0.01315)
Entry signal:
Signal to enter the market occurs when the price comes to " Buy zone " then forms one of the reversal patterns, whether " Bullish Engulfing ", " Hammer " or " Valley " in other words, NO entry signal when the price comes to the zone BUT after any of reversal patterns is formed in the zone. To learn more about " Entry signal " and the special version of our " Price Action " strategy FOLLOW our lessons :
Take Profits:
TP1= @ 0.01500
TP2= @ 0.01620
TP3= @ 0.01730
TP4= @ 0.01890
TP5= @ 0.02015
TP6= @0.02380
TP7= Free
LLong

L

Potential Setup of #Mainframe #MFT Technical Analysis#Mainframe Looking good and Stay above Major Support.
Next ride of #MFT soon
We can Expect Big ride in coming days.
So guy you can Start Accumulate.
#DYOR
#BTC #LTC #EOS #BCHABC #ADA #XRP #TRX
MEducation

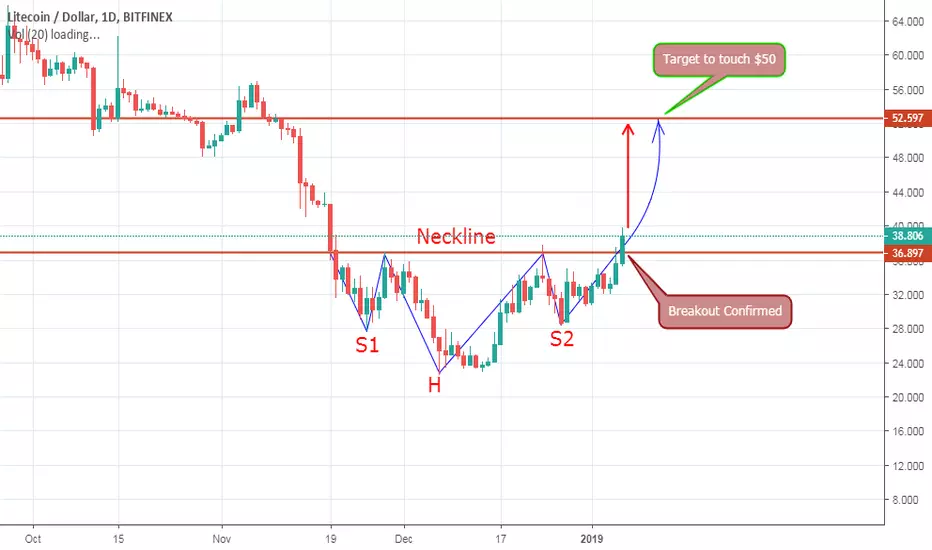
LTC Latest Chart Analysis Hello Everyone Hope you are doing good
In This Chart we can clearly see Breakout of Inverse H&S Pattern which is a Positive sign of Uptrend Current Price of Litecoin is $37.88 and it can move upto $50 as per this Chart Pattern. The area of $27.701–$29.349 is a critical support zone on the downside.
Hope this will help you
Thanks For watching Hit the like button if you like my work.
Litecoin (LTC) ready for the next leg up!LTC started to break out from the descending wedge earlier, however due to BTC movements the party was delayed. I feel LTC is ready to move up from here. Iam not a pro at charting, so this is what I could come up with.
LLong

LiteCoin (LTCUSD) buy setup - High risk high reward tradeBuy LTCUSD upon a close above 27 on day chart
Targets: Open
SL: 22


LTCBTC 1 Day Chart Analysis - Mid Term Analysis.You can see that the LTCBTC has broken the falling wedge pattern
and moving in Sideway, there is 7 Resistance Level and 4 support level.
1: Resistance Level 0.00999
2: Resistance Level 0.01161
3: Resistance Level 0.01291
4: Resistance Level 0.01442
5: Resistance Level 0.01566
6: Resistance Level 0.01784
7: Resistance Level 0.0200
Support Level.
1: Support Level 0.007539
2: Weak Support Level 0.006635
3: Last Year Support Level 0.005347
4: Strong Support Level 0.002994
Note: This is only for Educational Purpose this is not an Investment advice.
Please support the setup with your likes, comments and by following on Trading View.
Thanks
Adil Khan
LLong

A trading opportunity to buy in LTCBNBTechnical analysis:
. LITECOIN/BINANCECOIN is in a range bound and the beginning of uptrend is expected.
. The price is below the 21-Day WEMA which acts as a dynamic resistance.
. The RSI is at 41.
Trading suggestion:
. There is a possibility of temporary retracement to suggested support zone (5.50 to 4.70). if so, traders can set orders based on Price Action and expect to reach short-term targets.
Beginning of entry zone (5.50)
Ending of entry zone (4.70)
Entry signal:
Signal to enter the market occurs when the price comes to " Buy zone " then forms one of the reversal patterns, whether " Bullish Engulfing ", " Hammer " or " Valley " in other words,
NO entry signal when the price comes to the zone BUT after any of the reversal patterns is formed in the zone.
To learn more about " Entry signal " and the special version of our " Price Action " strategy FOLLOW our lessons:
Take Profits:
TP1= @ 6.50
TP2= @ 7.40
TP3= @ 8.30
TP4= @ 9.15
TP5= @ 10.00
TP6= @ 11.90
TP7= @ 14.15
TP8= @ 16.40
TP9= @ 19.60
TP10= @ 23.65
TP11= Free

There is a possibility for the beginning of an uptrend in LTCBTC Technical analysis:
. Litecoin/Bitcoin is in a range bound and the beginning of uptrend is expected.
. The price is below the 21-Day WEMA which acts as a dynamic resistance.
. The RSI is at 40.
. While the price downtrend in the Daily chart is not broken, bearish wave in price would continue .
Trading suggestion:
. There is a possibility of temporary retracement to suggested support zone (0.00814000 to 0.00736000). if so, traders can set orders based on Price Action and expect to reach short-term targets.
Beginning of entry zone (0.00814000)
Ending of entry zone (0.00736000)
Entry signal:
Signal to enter the market occurs when the price comes to "Buy zone" then forms one of the reversal patterns, whether "Bullish Engulfing" , "Hammer" or "Valley" in other words,
NO entry signal when the price comes to the zone BUT after any of the reversal patterns is formed in the zone.
To learn more about "Entry signal" and the special version of our "Price Action" strategy FOLLOW our lessons:
Take Profits:
TP1= @ 0.00945400
TP2= @ 0.01063810
TP3= @ 0.01141060
TP4= @ 0.01240100
TP5= @ 0.01333480
TP6= @ 0.01571755
TP7= @ 0.01762490
TP8= @ 0.02035380
TP9= @ 0.02381480
TP10= Free
LLong

BTC Making Descending Triangle & inide Symmetrical TriangleBitcoin Currently Making a Big Descending Triangle & inside making symetrical triangle .
if BTC Cross 6800 Level With Hevey volume and stable above 6800+ then e can see a bullish Movement is BTC & Altcoins .
if BTC Fail to current support line then BTC Can stay on 5800 Around and then BTC Can Bounce Back.
i hope BTC Soon will sure 6800 level and breakout both triangles.
Lern Here , Earn EveryWhere
Stay Tuned ... !!


Litecoin Chart Analysis (19th Sep 2018) #Shark #HarmonicsPatternLitecoin Chart Analysis (19th Sep 2018) #Shark #HarmonicsPattern $LTC

MACs - Advanced BOT Indicator for Swing and Scalp TradingMACs Indicator @ BTC - 4 Hour Time Frame:
We could not ask for more. Few of my Premium Members already Tripled their Money in last few days.
Indicator Signals:
L" --> refers Long/Buy.
S" --> refers Short/Sell.
Green Up Arrow --> refers Take Profits from last recent Sell Signal.
Green Down Arrow --> refers Take Profits from last recent Buy Signal.
Just look at the BUY & SELL Signals along with TAKE PROFITS Points. 100% Accurate.
Contact me for any help or queries or access @
1) Mail ID : cryptomac55@gmail.com
2) Telegram : cryptomac55
Thanks,
Mac

MACs EasyMoney - Advanced BOT VersionOur BOT Indicator @ BTC - 4 Hour Time Frame:
We could not ask for more. Few of my Premium members even Tripled their Money in last few days.
Indicator Signals:
L" --> refers Long/Buy.
S" --> refers Short/Sell.
Green Up Arrow --> refers Take Profits from last recent Sell Signal.
Green Down Arrow --> refers Take Profits from last recent Buy Signal.
Just look at the BUY & SELL Signals along with TAKE PROFITS Points. 100% Accurate.
Contact me for any help or queries or access @
1) Mail ID : cryptomac55@gmail.com
2) Telegram : cryptomac55
Thanks,
Mac

LONG LTCBTC Price action & vol analysisLong litecoin @demand and take profits @ supply
Take long positions in the box below the blue line

There is a possibility for the beginning of an uptrend in LTCUSDTechnical analysis:
. LITECOIN/DOLLAR is in a downtrend and the beginning of uptrend is expected.
. The price is below the 21-Day WEMA which acts as a dynamic resistance.
. The RSI is at 37.
. While the RSI and the price downtrend in the Daily chart are not broken, bearish wave in price would continue .
Trading suggestion:
. There is a possibility of temporary retracement to suggested support zone (57.70 to 49.50). if so, traders can set orders based on Price Action and expect to reach short-term targets.
Beginning of entry zone (57.70)
Ending of entry zone (49.50)
Entry signal:
Signal to enter the market occurs when the price comes to "Buy zone" then forms one of the reversal patterns, whether "Bullish Engulfing" , "Hammer" or "Valley" in other words,
NO entry signal when the price comes to the zone BUT after any of the reversal patterns is formed in the zone.
To learn more about "Entry signal" and the special version of our "Price Action" strategy FOLLOW our lessons:
Take Profits:
TP1= @ 66.00
TP2= @ 73.25
TP3= @ 81.10
TP4= @ 90.25
TP5= @ 111.00
TP6= @ 126.20
TP7= @ 173.75
TP8= @ 212.20
TP9= @ 250.60
TP10= @ 305.30
TP11= @ 375.00
TP12= Free

There is a possibility for the beginning of an uptrend in LTCETHTechnical analysis:
. LITECOIN/ETHEREUM is in a range bound and the beginning of uptrend is expected.
. The price is above the 21-Day WEMA which acts as a dynamic support.
. The RSI is at 59.
Trading suggestion:
. We opened 10 BUY trade(s) @ 0.18172 (day close price) based on a reversal candle ( Valley ) at 08.11.2018
. There is a possibility of temporary retracement to suggested support zone (0.17800 to 0.16600). if so, traders can set orders based on Price Action and expect to reach short-term targets.
Beginning of entry zone (0.17800)
Ending of entry zone (0.16600)
Entry signal:
Signal to enter the market occurs when the price comes to "Buy zone" then forms one of the reversal patterns, whether "Bullish Engulfing" , "Hammer" or "Valley" in other words,
NO entry signal when the price comes to the zone BUT after any of the reversal patterns is formed in the zone.
To learn more about "Entry signal" and the special version of our "Price Action" strategy FOLLOW our lessons:
Take Profits:
TP1= @ 0.2044
TP2= @ 0.2188
TP3= @ 0.2344
TP4= @ 0.2519
TP5= @ 0.2673
TP6= @ 0.2901
TP7= @ 0.3285
TP8= @ 0.3830
TP9= @ 0.4524
TP10= Free

A new trading opportunity to buy in LTCUSDTechnical analysis:
. LITECOIN/DOLLAR is in a range bound and the beginning of uptrend is expected.
. The price is above the 21-Day WEMA which acts as a dynamic support.
. The RSI is at 52.
. The price downtrend in the daily chart is broken, so the probability of the beginning of uptrend is increased.
Trading suggestion:
. If you missed our first HUNT, you have a second chance to buy above the new suggested support zone.
. There is still a possibility of temporary retracement to suggested support zone (75.00 to 66.00). if so, traders can set orders based on Price Action and expect to reach short-term targets.
Beginning of entry zone (75.00)
Ending of entry zone (66.00)
Entry signal:
Signal to enter the market occurs when the price comes to "Buy zone" then forms one of the reversal patterns, whether "Bullish Engulfing" , "Hammer" or "Valley" in other words,
NO entry signal when the price comes to the zone BUT after any of reversal patterns is formed in the zone.
To learn more about "Entry signal" and the special version of our "Price Action" strategy FOLLOW our lessons:
. We have already opened 9 BUY trade(s) @ 79.03 based on 'Two-day reversal candle (2-Day Hammer )' entry method at 2018.06.29 in our suggested support zone (72.50 to 57.50).
Total Profit: 8041
Closed trade(s): 1297 Profit
Open trade(s): 6744 Profit
Closed Profit:
TP1 @ 92.00 touched at 07.18.2018 with 1297 Profit.
Open Profit:
Profit for one trade is 87.46(current price) - 79.03(open price) = 843
8 trade(s) still open, therefore total profit for open trade(s) is 843 x 8 = 6744
All SLs moved to Break-even point.
Take Profits:
TP1= @ 92.00
TP2= @ 102.00
TP3= @ 125.00
TP4= @ 165.00
TP5= @ 183.00
TP6= @ 224.00
TP7= @ 252.00
TP8= @ 375.00
TP9= Free

A trading opportunity to buy in LTCBTCTechnical analysis:
. LITECOIN/BITCOIN is in a downtrend and the beginning of uptrend is expected.
. The price is below the 21-Day WEMA which acts as a dynamic resistance.
. The RSI is at 32.
. While the price downtrend in the Daily chart and the RSI is not broken, bearish wave in price would continue.
Trading suggestion:
. There is a possibility of temporary retracement to suggested support zone (0.01212 to 0.01157). if so, traders can set orders based on Price Action and expect to reach short-term targets.
Beginning of entry zone (0.01212)
Ending of entry zone (0.01157)
Entry signal:
Signal to enter the market occurs when the price comes to "Buy zone" then forms one of the reversal patterns, whether "Bullish Engulfing" , "Hammer" or "Valley" in other words,
NO entry signal when the price comes to the zone BUT after any of reversal patterns is formed in the zone.
To learn more about "Entry signal" and the special version of our "Price Action" strategy FOLLOW our lessons:
Take Profits:
TP1= @ 0.01350
TP2= @ 0.01483
TP3= @ 0.01570
TP4= @ 0.01816
TP5= @ 0.01997
TP6= @ 0.02223
TP7= @ 0.02511
TP8= Free
LLong
