Fair Value Gap, Chance Zone | Long BiasOn Week TF
Solana's in Fibo Channel and it's trading at $108 now
I found a #FairValueGap around in range $80 - $96 so I expect SOL will pullback and bounce back from this range
Besides, this range included #GoldenRatio
So I think the chance for long position
Time will tell
Longposition

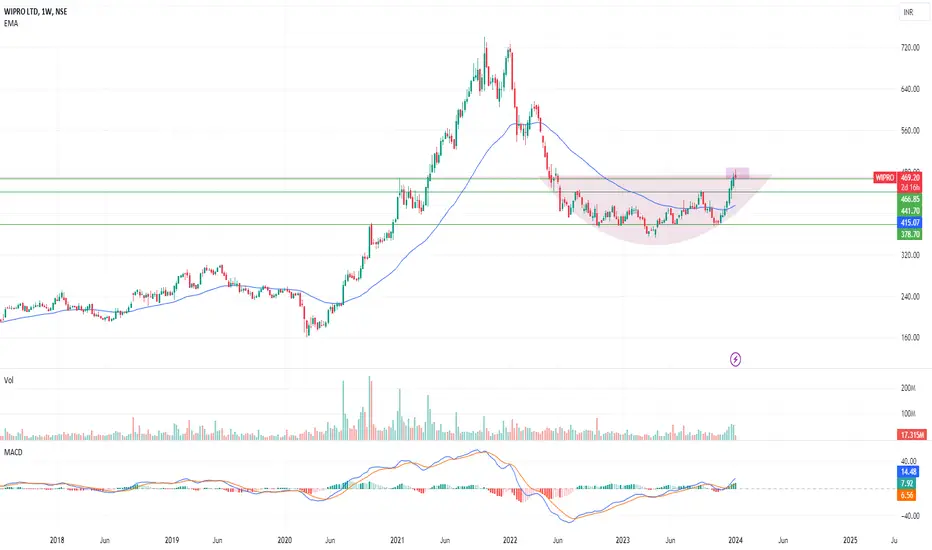
Right time to invest in WIPROIn weekly chart we can see after double top price was fall. And whole 2023 reate a strong support at 441.70.
Very Strong Support - 441.70
Now 464 resistance level is breaking. If we see this week creating a red candle but volume is good and as expected price will go higher and touch 500 within couple of month.
It Creating cup and handle pattern.
If we see very carefully couple 7 consecutive 7 week creating green candle with a good volume.
It's a good sign for investor.
Hindustan Institutional buying zone Similar to the HDFC analysis I gave, Hindustan Uni has approached its major support zone where it has had three previous 12% rallies from.
position Sizing is recommended...
What is position sizing?
It is when you first add half your position to check If the market is saying you are right or wrong, if the market moves in your direction, you will add your second half and tighten your stop loss. This way you add two positions but one only when the market shows you that you are correct.
Example: Suppose your risk is 100 per trade, You first buy enough Qt to risk only 50 ( Typically with a larger stop) and if the market forms a green candle or another bullish sign, you add another Qt to risk 50 more ( Total risk 100) and your second stop loss becomes tighter ( most probably at the breakeven of the first position) this way you minimise your loss but ur reward is the same and even more. If your first stop gets hit, you accept your mistake and move on.
Hence, if one does go long, I personally am buying as close to the zone as possible and then will be adding more as positive signs are shown.
One downside is that the overall market is taking a beating and a dead cross has formed on Hindustan Uni
Keep It simple

RVNL TECHNICAL AND FUNDAMENTAL ANALYSIS Today rvnl has done a bullish break out With a bullish singnal on it. I recommend you to buy and hold it at least a month or so. You Will get good results. In fundamental analysis in February government will announce the budget of the rail way sector.which will inventualy pump the price till then I recommend you to hold. NSE:RVNL

BRITANNIA: Forming Symmetrical Triangle PatternBritannia Industries Ltd is forming a Symmetrical Triangle Pattern as it is about to give a breakout from 4600. Based on the pattern, one can enter around 4600 after the breakout and target can be set around 6250-6300 with Stoploss to be set around 4200. This gives us risk to reward ratio of 3.99. Pattern is forming on weekly chart with horizon of 2-3 year.
Disclaimer:
This idea is only for education purpose, Please consult your financial advisor.
I am not SEBI registered.

Apollo Hospital 1 Hour Time Frame - 28th DECApollo hospital has been bullish in past 3 days after it formed a positive reversal in the Daily-Time-Frame and took support at 5275 close to the 50 SMA.
Today im observing a positive reversal once again in the 1Hr Time Frame.
My Entry in Apollo Hospital would be at 5688, with a stop loss at 5653 and a target at 5759.
Happy Trading!!

INFY Trendline SupportINFOSYS has shown some sort of demand on 1hr timeframe right at the lower trendline which has been forming since 6+ months. One can make long position in the same with a target of the upper band of trendline.
Stop Loss: SL has to be below 1,325
Entry: Entries can be made after formation of a strong candle on hourly timeframe which is also backed by strong volumes
Target: Upper trendline, 1,490 - 1,500

Ready for breakout - EID ParryEID Parry has made double bottom after about a year of consolidation. Now it is ready to give a breakout which will break its lower-high pattern and give a boost for new highs.
Stock has seen good volumes during past a few weeks, giving confidence for a breakout soon.
CMP: 565
Breakout level : Today's high (579)
SL: 560
Targets : 540 / 700
Disclaimer: I'm not a registered analyst. I'm just sharing my opinion on the platform for others to benefit in learning from my market understanding. Please do your due diligence before making a trade.

Great volume breakout in Balaji AminesBalaji Amines almost gave a long pending breakout today.
High level of volume seen today, adding to confidence for its breakout soon.
The stock can be considered for buy above today's close, 2208, with an SL of the trendline shown or simply 2295.
First target will be 2600 where resistance can be seen.
Disclaimer: I'm not a registered analyst. I'm only sharing my opinion on the platform for others to benefit in learning from my market understanding. Please do your due diligence before making a trade.

Weekly breakout with VolumeAdvanced Enzyme has made a consolidation breakout. Breakout is supported with high Volume, which is almost 4 times of its average volume.
The breakout is also made Cup & Handle pattern over a period of almost 2 years. This pattern is generally quite reliable for the further hike in stock price.
Breakout level : 350
CMP : 360
SL: 345
Targets : 410 / 480
Disclaimer: I'm not a registered analyst. I'm only sharing my opinion on the platform for others to benefit & learn from my market understanding. Please do your due diligence before making a trade.

Share to Double Pharma is Sector for 2023
This ha shown very good upmove from its support level.
Believe this will repeat the same

HDFC BANK Long Trade.Right Time to Invest in HDFC BANK.
Buying Range : 1615 to 1620
Stop Loss : @1595
Targets : 1650/1680/1725/1775/1840 ++++++
Reasons to Buy:
1: HDFC bank following a channel from past one year, and now again taking support from the channel low i.e. @1615.
So basis idea is that, we will follow the price up to channel high (i.e. @1775-1840).
2: RSI is about to oversold. As observed whenever RSI was found below 35 then the movement was shifted to upside.
3: Good fundamentals
4: Good Risk to Reward ratio.
Thanks
Disclaimer: This idea is only for the Educational purpose. Trade at your own risk.
If you like the idea kindly support.

GRINDWELL go longIf it crosses 2214
Entry price: 2214.10
Stop loss: 1949.95 (11.94% risk involved)
Target: 2745.40 ( reward of 24% with 11.94% risk)
Enter into the stock if one is able to take risk of 11.94%
I am entering this stock with 11.94% risk
I am not SEBI registered individual, please do your own analysis before taking a trade , this is only a trade idea

Cosmos Price Prediction : 10% gains on ATOM / USDT ATOM eyes 10% gains amid chatter about a fork
* Cosmos price remains above a crucial supply barrier extending from $6.161 to $8.966 with the potential for more gains.
* ATOM could climb 10% to tag the $10.218 resistance level, steered by bullish indicators and bullish speculation.
* Invalidation of the bullish outlook will occur once the cryptocurrency breaks and closes below the $8.545 critical support.

EUR/USD Price AnalysisThe EUR/USD pair is currently trading around 1.0970, facing slight losses in the early European session after pulling back from a four-month high of 1.1017. Traders are awaiting inflation data from Italy, France, and the Eurozone, with the Eurozone Harmonized Index of Consumer Prices (HICP) expected to show a 3.9% YoY growth in November.
From a technical standpoint, the EUR/USD maintains a positive outlook, staying above the 50- and 100-hour Exponential Moving Averages (EMA) on the four-hour chart. The Relative Strength Index (RSI) is in bullish territory, suggesting a favorable trend for the pair.
Immediate resistance is observed at 1.1000, marked by the Bollinger Band boundary and a psychological round figure. The next resistance levels are at 1.1017 and 1.1042, followed by a potential rally to 1.1150 if buying momentum persists.
On the downside, a key support level lies at 1.0930, indicated by the lower limit of the Bollinger Band and the 50-hour EMA. Further support is found at 1.0895 (low of November 24), 1.0867 (100-hour EMA), and 1.0825 (low of November 17). Monitoring these levels can provide insights into potential price movements.

ASHAPURAMIN looks good going ASHAPURAMIN looks good going
Hold this --- > Can touch its ATH
370>>400>>420 levels

HAL is Bullish 🐂HAL ( Hindustan Aeronautics Limited ) is Bullish as today it seems a high volume in buying side. It already broke its major resistance also.
The target price should be 2393.
Note : This is not any tip or recommendation it is just for learning purpose only. So be careful while investing.

policy bazarIn this chart we clearly see that one impulse wave is over ..we can see one big bullish uptrend on upcoming month. It is great stock for swing trading with minimum stoploss ..
Disclaimer:- Invest at your own risk,, i am not register with Sebi.. This chart is according to my technical analysis which i learnt from past years

ANALYSIS VIEW ON SEI / USDT PAIR Pair: SEI/USDT
Exchange: Binance
Trade Type: Buy Long (FUTURE)
Trade Parameters:
Entry Level: 0.2095
Target 1: 0.2160
Target 2: 0.2222
Stop Loss: 0.1970
Analysis:
The SEI/USDT pair, listed on the Binance exchange, presents a promising trading opportunity. The Relative Strength Index (RSI) indicates a bullish movement in the market, suggesting potential upward price momentum. Additionally, a bullish sentiment is observed in the short-term moving average, reinforcing the positive outlook.
Trade Rationale:
The decision to enter a long (future) position at the specified entry level of 0.2095 is supported by the bullish signals from both RSI and the short-term moving average. Target levels at 0.2160 and 0.2222. To manage potential risks, a stop-loss order is set at 0.1970.
DISCLAIMER : EDUCATIONAL PURPOSE ONLY

BHANSALI ENG POLYM Breakout prediction long opportunityBHANSALI ENG POLYM is a Process Industries/ Industrial Specialties stock that have been consoladating for past 7-Months. by looking the volume spike it seems bulls will be taking the stock to outside the channel now. once breakout is successful, after little consolidation it can give a very nice Risk:Reward :: 1:3 Approx.
Reasons:
RSI is crossing 60 to upside. (Bullish)
200 EMA have been providing a nice support for very long time. In History also it has been a nice support and resistance.
Rectangle Pattern breakout is about to happen. If it gives a popout candle then you may go long by putting a small stoploss.
Price > EMA(13,50,200) which shows bullishness. but as it has been a trendy momentum for past 2 weeks. I am expecting it to give little consolidation outside the channel and then bullish momentum.
Verdict:
Bullish Breakout is about to happen
Plan of action:
Entry after consoladition
BUY: 98-100 after consoladition
Stoploss: 96
Target: 111

Sequent swing bullish Prediction Sequent is performance based stock. It gave a breakout earlier and now after a nice consolidation it seems to move again in bullish direction.
Reasons:
Taking support at trendline near 200 EMA and VWAP.
Moving in Higher HIGH Higher LOW.
Important level are marked in the chart.
RSI breaking 50 to upside shows Bullishness.
Re-Breakout after 3 month of consolidaiton.
Verdict:
Bullish Movementum Continuous
Plan of action:
Buy: 101
Stoploss: 98
Target: 112-114

SOLANA updated move (SMC)As SOLANA continues to follow the chart pattern I previously shared, it has successfully mitigated the demand zone and is currently moving in line with it.
So far, this movement has resulted in approximately a 10% profit . Considering this positive development, it would be wise to start booking profits partially while implementing a trailing stop loss strategy.
Our next target should be the recent high that SOLANA reached. However, it is crucial to keep an eye on Bitcoin's price movement as well.
Bitcoin often influences the overall cryptocurrency market, so any significant changes in its value could impact SOLANA's performance.Additionally, it is important to note that the current market sentiment appears to be greedy. This means that investors may be more inclined to take risks and potentially overlook potential downsides.
Therefore, it is essential to exercise caution and manage your risk accordingly.
I will continue monitoring the situation and provide updates as necessary.

XTZ/USDT ( 30 min ) RSI is above its neutrality area at 50. The MACD is positive and below its signal line. The price is above its 20 & 50 period moving average.
0.87 is support level and look for 0.93. In case of downtrend breakout of 0.87 and it would look for 0.86 & 0.85
