BTCUSDT – Buying Resumes, Bullish Momentum Targets 120,000Bitcoin is flashing strong bullish signals as it continues to hold within a well-defined long-term ascending channel. After a technical bounce from the nearby support zone around 99,614, BTC has regained momentum and is now approaching a key resistance FVG cluster — a potential launchpad for a breakout.
The price structure shows a series of higher lows combined with healthy pullbacks, indicating accumulation and capital rotation back into BTC. A “break–pullback–continuation” pattern is forming, pointing to a likely move toward the psychological resistance level at 120,000 — a target highlighted by many professional traders since the start of the quarter.
Fundamental factors supporting the uptrend:
Large capital inflows are returning to U.S. Bitcoin ETFs, signaling renewed institutional confidence in the bull cycle.
Expectations that the Fed will hold rates steady are weighing on the USD, creating a favorable environment for risk assets like BTC.
Altcoin volatility is fading — often a sign that capital is rotating back into BTC as the market’s leading asset.
Longsetup

Titan - Keep On WatchCMP 3652 on 26.06.25
The chart itself is self-explanatory. The price has formed a Cup & Handle-like pattern since February 2025. This time, it is reaching the breakout levels.
MACD shows a likely reversal, too.
If it breaks out, it may go bullish to reach the levels of 3850, 4050, and potentially higher, depending on the market conditions.
In case of any correction, support levels are around 3510.
One may plan entry on different levels while considering risk management and position size.
All these illustrations are only for learning and sharing purposes; it is not buy or sell advice. Please do your research before taking any trade.
All the best.

Bitcoin is Coiling – Ready to Break Out Toward 112K?On the H8 timeframe, BTCUSDT is forming a clear bullish setup. After a strong rebound from the support zone around 104,489 — which aligns with a previous demand area and Fair Value Gap — price has broken above the descending trendline and is now retesting the resistance near 107,500. This structure is shaping into a broadening triangle pattern, signaling a potential breakout.
If BTC holds the 105,000–106,000 area during the upcoming pullback, there is a high probability of a bullish breakout toward the 112,000 level — a key previous high.
On the news front, market sentiment is improving as U.S.-based Bitcoin ETFs attract fresh inflows, coupled with growing expectations that the Fed will hold interest rates steady amid signs of economic slowdown. These factors are providing strong support for BTC’s medium-term bullish outlook.

GILLETTE BULLISH VIEW SWING🚨 Breakout Watch: Gillette 🚨
Bullish above ₹10,450 (Close)
📍 CMP: ₹10,400
🎯 Target: ₹13,000–₹16,500
❌ Invalid below: ₹9,500
📊 High Volatility — ATR%: 3.25 (Avg: 3.17)
📈 Golden Crossover: 50D > 200D
✅ Price above 50/100/200 MA
📈 RSI bullish — D: 65.36 | W: 66.9 | M: 71.3
📉 ADX: 47.62 | DMI spread: 56.72%
🔍 Donchian flat | Bollinger expanding (14.67%)
Watch ₹10,450 breakout for momentum!
(For Educational Purposes Only)
#Gillette

XAUUSD – Technical Pullback, Bearish Trend Remains DominantGold posted a mild recovery of around 650 pips on June 25, closing near 3,329.57 USD, marking a short-term rebound after a sharp decline. However, both technical structure and macroeconomic outlook suggest that the bearish trend remains in control.
On the H4 timeframe, XAUUSD has broken below a multi-week ascending channel and is now trading beneath the previous support trendline, which has turned into resistance. The price gap around 3,360–3,376 USD remains partially unfilled, making it a potential magnet for a short-term technical pullback.
The current price structure is forming a “lower high – lower low” pattern, confirming sustained bearish momentum. If price fails to reclaim the FVG zone near 3,376.5 USD, a decline toward the support area at 3,308—and possibly down to 3,270—remains likely. Upcoming U.S. Core PCE and Q1 GDP data will be key in determining gold’s next directional move.

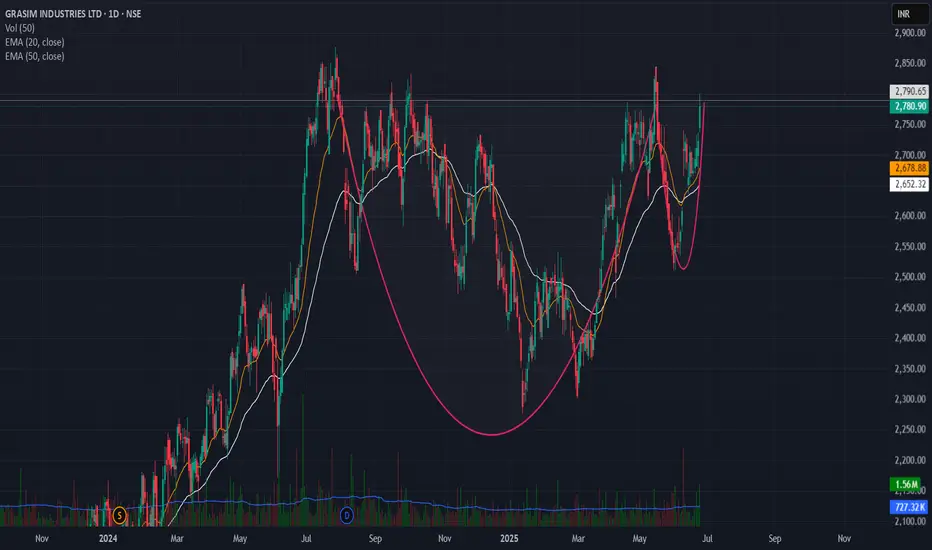
Breakout from cup and handle pattern Grasim Cup and Handle Breakout Setup
Grasim is forming a classic Cup and Handle pattern on the daily chart.
✅ Breakout Level: 2790
🛑 Stoploss: Below 2650 (handle low)
🎯 Target Zone: 3290 (based on depth projection and prior highs)
Pattern Logic:
Rounded cup base indicates accumulation
Handle pullback was shallow with declining volume
Breakout attempt with volume surge
Price above 20 EMA & 50 EMA
RSI > 55 and MACD nearing bullish crossover
GOLD – ONCE AGAIN AT A CROSSROADSThe gold scenario is becoming clearer: price is holding firmly at the key support zone around 3,300.900 and is gearing up to react to a series of “bombshell” U.S. data releases – including GDP and the Fed’s preferred inflation gauge, Core PCE. These two indicators are critical in shaping future Fed policy.
From a technical standpoint, buyers have halted the decline at a previous Fair Value Gap (FVG) – a zone that previously supported a bullish breakout. The recent rebound from this area opens up a potential move towards 3,368.700, where a new FVG exists and coincides with a long-term descending trendline. This is not only a technical target, but also a testing ground to assess whether the market has enough momentum to reverse the broader downtrend.
However, one must also acknowledge the risk: if upcoming U.S. data reinforces the Fed’s hawkish stance, gold is likely to face rejection at the trendline – and could once again slip below the 3,300 zone.

XAUUSD –Bounces from support, watching PMI & Powell for breakoutGold is recovering from the 3,357 zone – the lower boundary of the ascending channel on the H4 chart, with the FVG area around 3,365–3,375 acting as near-term support. The higher-lows structure remains intact, indicating the medium-term uptrend is still in play.
On the news front, the US Flash Manufacturing PMI is expected to decline, and Fed Chair Powell is set to testify before Congress. If dovish signals emerge, gold could see a strong push higher.
Strategy: Consider buying around 3,357–3,365 if confirmation appears, targeting 3,443.
Do you think gold has the momentum to break through this resistance zone?

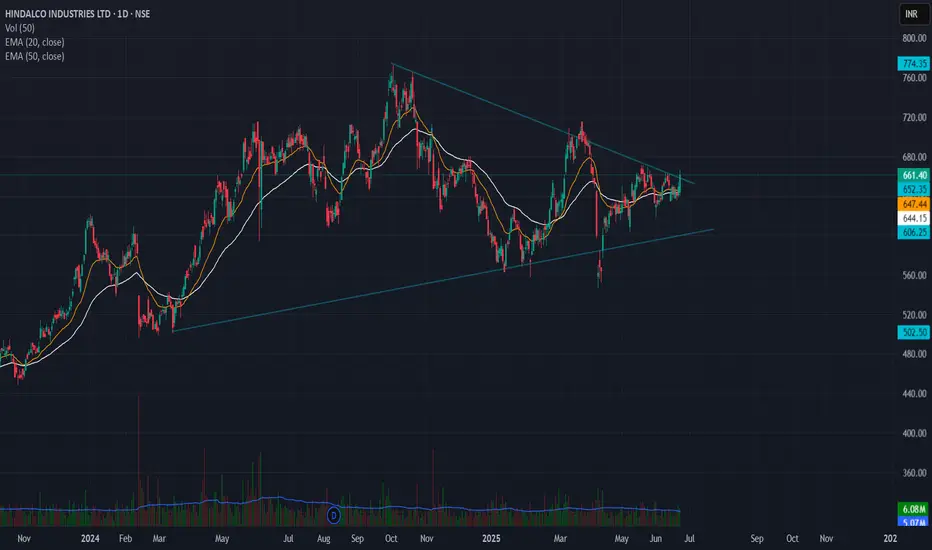
Hindalco Symmetrical Triangle breakout setup🔹 Pattern: Symmetrical Triangle
🔹 Breakout Level: ₹660
🔹 Stoploss: ₹635 (below swing low)
🔹 Target Zone: ₹850 – ₹900
🔹 Risk–Reward: 7.6 – 9.6
🔹 Timeframe: Positional (swing to medium term)
---
📊 Chart Analysis:
Hindalco has broken out of a well-defined symmetrical triangle on the daily chart, with strong price compression followed by bullish breakout confirmation.
The triangle height is ~₹200, projected from the breakout zone, giving a target range of ₹850–₹900.
🧠 Stoploss placed below the last swing low inside the triangle to avoid false breakdown traps.
BTCUSDT – Long-term uptrend intact, target 111,666 USDTBitcoin is maintaining a strong bullish structure on the daily chart, having successfully retested the long-term ascending trendline. The support zone around 93,932 USDT — which aligns with a Fair Value Gap (FVG) and trendline — continues to act as a key rebound level, as seen in late April.
The current chart suggests a “pullback–breakout–consolidation” pattern, with the potential for a higher low if price revisits the trendline and FVG once more. The base case: price consolidates around the 98k–100k zone before targeting the major resistance at 111,666 USDT.
On the news front, investor sentiment is stabilizing after the Fed signaled rate hold. Additionally, BlackRock’s ETF has seen three consecutive days of net inflows — a strong tailwind for the bulls.

BTCUSDT – Holding Support, Bullish Signs EmergingBitcoin remains within a descending channel but continues to defend the strong support area around 101,296 USDT — a level that previously triggered a sharp rebound. On the H4 timeframe, price is consolidating sideways, forming an accumulation range. If this support holds, a bounce toward the 105,356 USDT zone is likely.
As of June 19, Binance holds 41% of global BTC trading market share, providing deep liquidity and tight spreads. This market condition favors a potential short-term recovery in BTC.
A breakout above the key resistance zone at 105,000–106,000 USDT could open the door for a broader upside continuation.

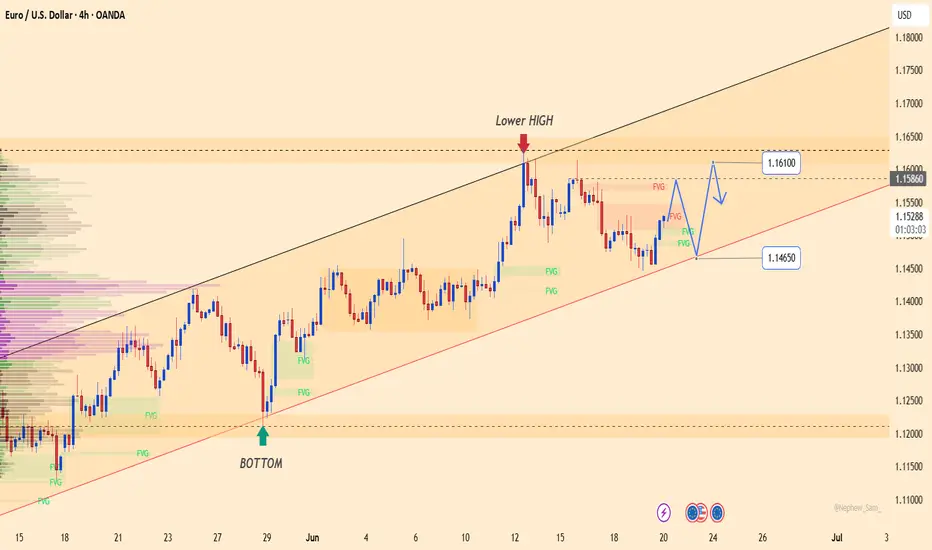
EURUSD – Rejected at Lower High, Bearish Bias BuildsEURUSD has printed a clear lower high near the 1.16100 resistance zone, failing to reclaim the previous swing high. Price is now retreating, approaching the dynamic trendline support intersecting with FVG zones around 1.14650. The structure suggests potential for a short-term bounce—but as long as price remains below the 1.15860–1.16100 resistance zone, the broader setup leans bearish.
On the macro side, the ECB’s dovish tilt—hinting at rate cuts due to subdued inflation—has weighed heavily on the euro. Meanwhile, the Fed maintains its hawkish stance, reinforcing dollar strength, especially amid renewed geopolitical tensions that are pushing USD further as a safe haven.
If the ascending trendline fails to hold, we may see an accelerated decline toward the 1.13800 area. Watch for a failed retest of 1.15860 as confirmation for short entries.
XAUUSD – Gold Wobbles, Breakdown Risk IntensifiesGold is currently testing the lower boundary of the ascending channel after pulling back from the 3,398 USD resistance zone. The recent breakdown from a triangle pattern signals growing bearish pressure.
If the price fails to reclaim the 3,397 USD area, a continued move down toward 3,307 USD becomes likely — a level that coincides with key technical support. The latest FOMC minutes reaffirmed a “hawkish” stance, boosting the USD and adding downside pressure on gold.
The bearish outlook will strengthen if gold fails to hold the current support zone.

GBPUSD – Breakout Confirmed, Downtrend Targeting 1.33170GBPUSD continues to display a clear bearish structure on the 4H timeframe after breaking below a key horizontal support and the pink trendline. The pair is now attempting a retest of the resistance zone near 1.34600, which aligns with the previous support-turned-resistance and a nearby supply area. If price gets rejected here with weak bullish momentum, a strong downward continuation is likely, with the next target around 1.33170 – a zone marked by a long-term diagonal support and previous swing lows.
On the news front, the British pound is under pressure after the Bank of England (BoE) disappointed markets by holding interest rates steady at 4.25%. Meanwhile, the Federal Reserve maintains its “hawkish” stance, boosting USD strength and increasing downward pressure on GBPUSD.

EURUSD – Weakening Trend, Risk of Deeper CorrectionThe EURUSD pair is gradually losing its bullish momentum after failing to hold above the 1.1510 level, forming a series of lower highs. The recent decline is dragging the price back toward the long-term ascending trendline. If buyers fail to defend the support area around 1.1380 — a confluence of the trendline and the most recent swing low — the previous uptrend structure could be invalidated.
On the news front, the euro is under pressure following cautious remarks from the ECB, while recent PMI and inflation data from the Eurozone suggest slowing economic growth. Meanwhile, the Federal Reserve in the US maintains a hawkish stance, reinforcing USD strength and applying double pressure on EURUSD.

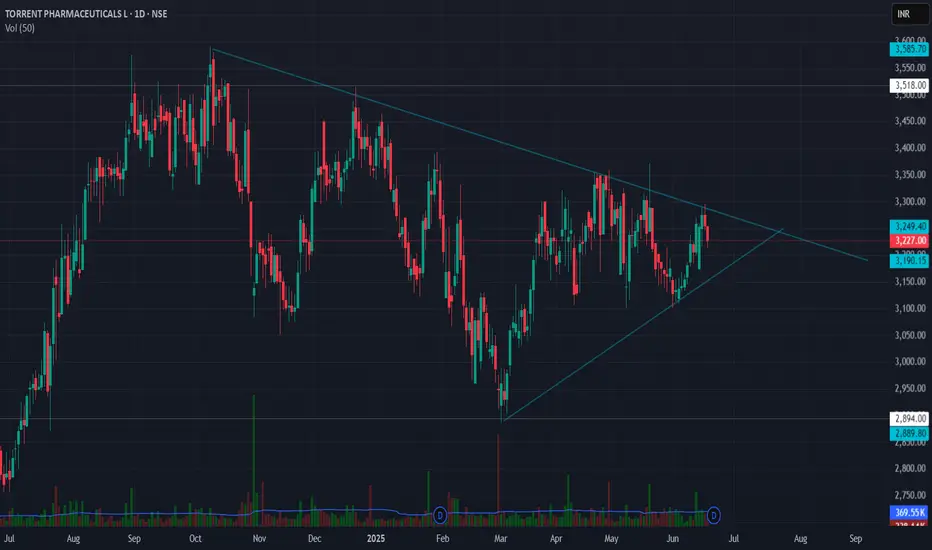
Symmetrical Triangle pattern in Torrent Pharma Symmetrical Triangle Breakout Setup
Torrent Pharmaceuticals Ltd (TORNTPHARM)
Breakout Level: ₹3,300
Stop Loss: ₹3,150 (below triangle support)
Target: ₹4,000 (based on height of triangle)
Risk:Reward: ~2.8:1
✅ Technical Confirmation:
RSI near 52 — momentum shifting bullish above 55.
MACD positive crossover, rising histogram — trend strength improving.
Volume: Awaiting breakout candle with above-average volume for confirmation.
EFI (Elder Force Index) turning positive — signals potential surge in buying force.
📌 Strategy Insight:
A breakout above ₹3,300, backed by volume and momentum, could lead to a sharp trend continuation toward ₹4,000. The symmetrical triangle represents consolidation after trend — a potential bullish continuation pattern.
XAUUSD – Gold rebounds hard, a breakout rally may be brewing!After a perfect touch of the trendline at 3,367 USD, gold has sharply bounced back within a solid bullish structure. Notably, the latest low is significantly higher than previous pullbacks — a clear sign that buyers are still in control. The short-term target? None other than the 3,479 USD resistance — a key level that has rejected price twice before.
If this barrier is broken, gold could quickly surge toward 3,520 USD.
On the news front, expectations that the Fed may pause rate hikes due to weakening U.S. consumer data are cooling the dollar, giving gold room to rally. At the same time, simmering geopolitical tensions are fueling demand for safe-haven assets. With both technicals and sentiment aligning, this could be gold’s golden moment to catch the market off guard!

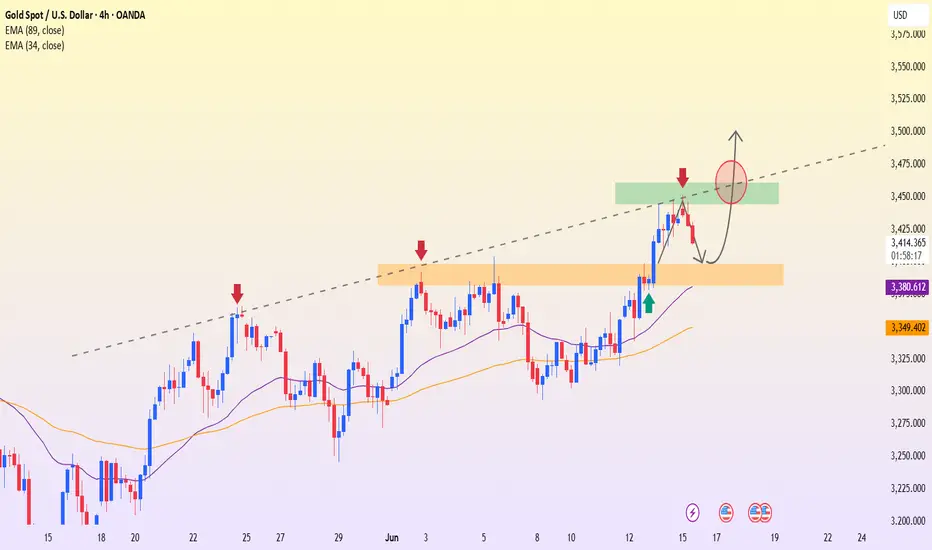
XAUUSD – Strong bullish momentum, but key resistance remainsGold on the H4 chart is maintaining a steady uptrend, consistently forming higher lows while respecting the ascending trendline and both key EMAs (EMA34 & EMA89). After a brief pullback, price is now approaching a major resistance zone around 3,441 USD — a level that previously rejected bullish attempts.
The market structure suggests two possible scenarios:
If price breaks above 3,441 USD with strong buying pressure, the uptrend will be confirmed and could extend toward higher levels.
Conversely, if rejected again, price may retreat toward the support zone at 3,347–3,356 USD for accumulation before resuming the upward move.
On the fundamental side, expectations of a Fed rate cut—driven by significantly weaker U.S. retail sales—are pressuring the USD, which in turn supports gold prices in the short term.

BDL | Long | Swing Setup | Wave AnalysisBDL is either in Wave C of abc
or Wave 3 of 1-5 as shown in chart
both cases suggest a bullish up-move towards target one in case of wave C and towards target 2 in case of wave 3.
SL would be 1090- 1130 zone. If looks weak in this zone we will exit.
Increasing volume suggests a good momentum long setup.
Just my 0.02$

BTCUSDT – Selling Pressure is IncreasingThe price is retesting a strong resistance zone around 110,464 USDT, where heavy selling pressure previously emerged.
The likely scenario is that the price forms a Lower High pattern and then breaks the uptrend line → confirming a bearish trend.
Potential support area: 101,236 USDT, where price previously reacted.
Strategy:
Priority is to wait for sell opportunities around the 110,000–110,500 zone if a clear reversal signal appears.
Target at 101,200 USDT. Stop-loss placed above the resistance zone at 111,700 USDT.
News Supporting the Bearish Outlook:
The SEC has delayed approval of the spot Ethereum ETF, triggering negative sentiment in the crypto market.
Capital is flowing out of the market due to expectations that the Fed will maintain high interest rates for a longer period.

XAUUSD – Bullish Signal Taking ShapeGold begins the week on a positive note, supported by:
U.S. inflation coming in lower than expected, raising expectations that the Fed will cut interest rates in the coming months.
Tensions between Israel and Iran, which are driving safe-haven flows into gold.
On the H4 chart, the price is pulling back toward the $3,397 support zone, which aligns with both the EMA and a previous accumulation area. The current structure suggests a potential W-shaped reversal pattern, which could propel gold toward the $3,501 resistance level.
Main strategy: Look for buy setups around $3,397 upon bullish confirmation.
Target: $3,500
Stop loss: Below $3,380
Gold remains in an uptrend. The $3,397 zone is the key level that could trigger the next upward move.
TVSSCS - Triangle into a flag!The following points are of note:
------------------------
1. A symmetrical triangle formed as a near-term bottom for the stock
2. After breaking out of the triangle, price is consolidating in a rectangular range
3. A pole and flag formation, when broken out can give targets of 143, 147, with SL of 123
Disclaimer:
This is NOT a trading recommendation, only my observation. Please do your own analysis before entering any trade.

Accumulate and then hit 3500 soonPlan XAU next week: 16 June - 20 June 2025
Related Information:
Recently, US President Trump told Axios that Israel’s attack could help him reach an agreement with Iran. He urged Iran to make a deal, adding, 'There has already been great death and destruction, but there is still time to bring this slaughter to an end, with the next planned attacks expected to be even more brutal.'
The University of Michigan (UoM) Consumer Sentiment report for June showed that households are becoming more optimistic about the economy. The Sentiment Index increased from 52.2 to 60.5, while inflation expectations declined for both the one-year and five-year outlooks—from 6.6% to 5.1%, and from 4.2% to 4.1%, respectively.
personal opinion:
Gold prices will tend to accumulate at the beginning of the week around 3400, news of Middle East tensions will push gold prices back to 3500 by the middle of next week.
Important price zone to consider :
sell point: 3500, 3536
buy point: 3410, 3376
Sustainable trading to beat the market
