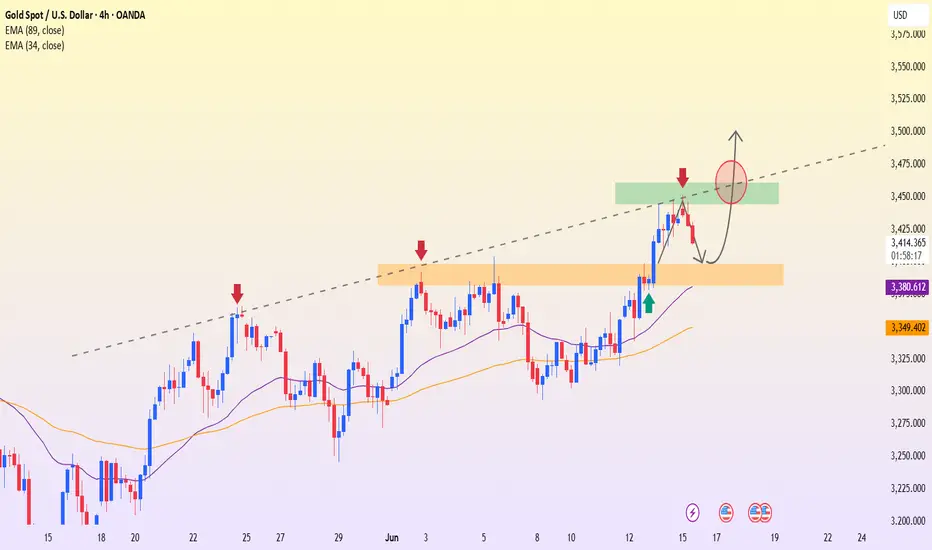
XAUUSD – Bullish Signal Taking ShapeGold begins the week on a positive note, supported by:
U.S. inflation coming in lower than expected, raising expectations that the Fed will cut interest rates in the coming months.
Tensions between Israel and Iran, which are driving safe-haven flows into gold.
On the H4 chart, the price is pulling back toward the $3,397 support zone, which aligns with both the EMA and a previous accumulation area. The current structure suggests a potential W-shaped reversal pattern, which could propel gold toward the $3,501 resistance level.
Main strategy: Look for buy setups around $3,397 upon bullish confirmation.
Target: $3,500
Stop loss: Below $3,380
Gold remains in an uptrend. The $3,397 zone is the key level that could trigger the next upward move.
Longsetup
TVSSCS - Triangle into a flag!The following points are of note:
------------------------
1. A symmetrical triangle formed as a near-term bottom for the stock
2. After breaking out of the triangle, price is consolidating in a rectangular range
3. A pole and flag formation, when broken out can give targets of 143, 147, with SL of 123
Disclaimer:
This is NOT a trading recommendation, only my observation. Please do your own analysis before entering any trade.

Accumulate and then hit 3500 soonPlan XAU next week: 16 June - 20 June 2025
Related Information:
Recently, US President Trump told Axios that Israel’s attack could help him reach an agreement with Iran. He urged Iran to make a deal, adding, 'There has already been great death and destruction, but there is still time to bring this slaughter to an end, with the next planned attacks expected to be even more brutal.'
The University of Michigan (UoM) Consumer Sentiment report for June showed that households are becoming more optimistic about the economy. The Sentiment Index increased from 52.2 to 60.5, while inflation expectations declined for both the one-year and five-year outlooks—from 6.6% to 5.1%, and from 4.2% to 4.1%, respectively.
personal opinion:
Gold prices will tend to accumulate at the beginning of the week around 3400, news of Middle East tensions will push gold prices back to 3500 by the middle of next week.
Important price zone to consider :
sell point: 3500, 3536
buy point: 3410, 3376
Sustainable trading to beat the market

Apollo Micro-Do not miss this Volume breakout!Apollo Microsystems has given a breakout of consolidation with a strong weekly closing, almost forming a bullish marubozu candle
Stock will look good only when it retest level of 110 and bounces.
Levels mentioned on chart. I will not buy at CMP.
Stock has potential to fly at least towards 200 according to fib extension.
It is too good of breakout to miss. I have hardly seen such a bullish weekly candle recently when Nifty has been slight bearish.

XAUUSD – Uptrend, waiting for pullback to enterGold is moving within an ascending channel on the 3-hour timeframe. After touching the resistance zone at 3,445–3,460, XAUUSD shows signs of consolidation and is likely to correct down to the support zone at 3,390–3,400 — aligning with the trendline and EMA34.
Strategy:
Watch for buying opportunities around the 3,390–3,400 zone when there are confirmation signals.
Target: 3,445–3,460, and potentially up to the 3,480–3,500 zone.
Stop loss if price falls below EMA89 (3,352).
Supporting news:
U.S. CPI data for May came in lower than expected (0.0% vs 0.1%) → Raises expectations of an earlier Fed rate cut → Supports the gold uptrend.

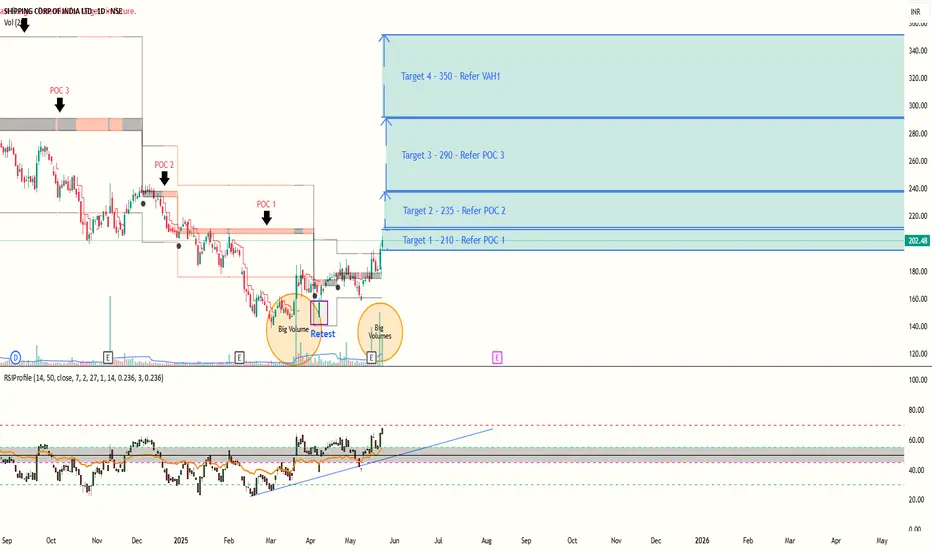
Shipping Corporation of India - Value Buying and Bullish trendShipping Corporation of India had retraced almost 61.8 % from highs near the lows, after a period of accumulation where there were continous responsive buyers at lows. The price started moving up.
Volumes : Volumes can be confirmed with the circles plotted on chart.
Retest : The retest of price happened highlighted by the rectangle.
Initiative Buyer : we can see big volumes coming after the retest happened and price started moving above POC - Point of control of current range. This suggest a strong support zone below even if the price retraces a bit eventual trend is up.
From the previous point of controls and value area highs we can set targets for upcoming upmoves :
Targets :
1)210
2)235
3)290
4)350
There should be strong support around Point of control and value area low of current range, in case of SL hunting of weak hands.
Still shows a relatively low risk opportunity with potential for high reward.
PS : Post is educational in nature and doesn't constitute any financial or buy sell advice. Do your own research. The publication is made with the intention to explain the concepts of RSI Hybrid Profile.
Indicator
BTCUSDT – Rebound from 104,200, recovery opportunity emergingBTCUSDT has bounced back from the 104,200 support zone with a potential double bottom pattern, signaling the return of buying pressure. The price is consolidating around the 106,000–107,000 area. If this zone holds, the probability of retesting the previous high at 110,500 is high.
The EMA34 and EMA89 are narrowing – a sign of weakening selling pressure.
Supporting news:
The Fed kept interest rates unchanged, U.S. CPI slightly declined, and capital inflows from ETFs like BlackRock are returning to the market, creating momentum for recovery.

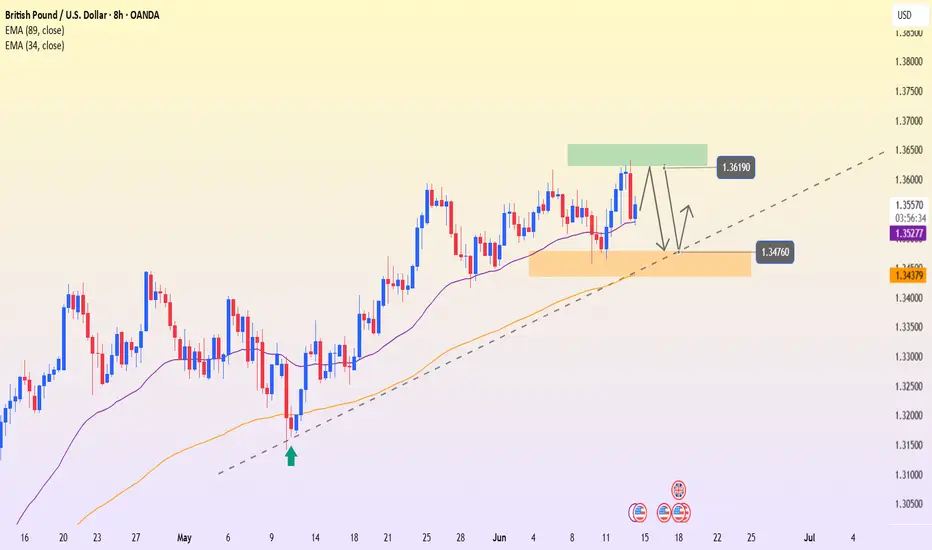
GBP/USD: Continuation or Correction?GBP/USD is in an uptrend, with support at 1.34760 and resistance at 1.36190. EMA (34) at 1.35277 and EMA (89) at 1.34379 are supporting the uptrend.
UK inflation data dropping has strengthened GBP, while USD remains volatile due to expectations of Fed rate hikes. If GBP/USD stays above 1.34760, the uptrend will likely continue.
However, if the price breaks below this level, a deeper correction may occur. The strategy is to buy on a pullback to 1.34760 and sell if support is broken. Manage risk by placing stop-loss orders around key support levels.
EURUSD – Buyers Remain in Control, Awaiting Confirmation SignalThe EURUSD pair posted a slight pullback after reaching the upper resistance zone of the ascending channel around 1.16130 on June 12. However, the bullish structure remains intact, with higher lows and clear respect for the upward channel on the 8H chart.
Technically, the 1.14590 zone — which aligns with both the trendline and the EMA34 — will act as a key support area. If the price holds this level and rebounds, the likelihood of retesting the 1.16130 high is strong. Conversely, a break below 1.14590 could trigger a deeper correction.
On the fundamental side, the euro is supported by expectations that the ECB will maintain its current interest rates, while cooling U.S. CPI data has weakened the dollar.

Gold Surges After FOMC, Eyes Breakout Above 3,515Gold prices surged sharply on June 12 following positive FOMC and CPI results, closing at 3,429 – up more than 1.2%. The technical structure remains firmly within an ascending channel on the 8H chart, with higher lows consistently supported by the EMA34 and trendline.
The 3,488–3,515 resistance zone will be a key test in the coming sessions. If price breaks and holds above this level, the next target will be new highs. Conversely, a minor pullback toward the 3,348 area – aligned with the trendline and EMA – may offer a trend-following buy opportunity if confirmed by price action.
Gold is receiving strong support from cooler U.S. CPI data, which has boosted expectations that the Fed may cut interest rates soon. Additionally, geopolitical tensions in the Middle East and bullish outlooks from major institutions continue to reinforce gold’s safe-haven appeal.

GBPUSD – Resistance Pressures, Downside Risk EmergingAfter rebounding from the EMA89 area near 1.3500, GBPUSD recovered to approach the 1.3600 resistance zone but was quickly rejected. The H4 chart shows weakening bullish momentum as price retests the previous distribution area without managing a close above it.
The current technical structure leans toward a potential pullback, especially since the EMA34 and trendline support zone has not been broken. If the price breaks back below 1.3500, the next target would be around 1.3440 – the previous key support.
Recent news shows a slight decline in US CPI, temporarily weakening the USD, but the market is now focused on the upcoming FOMC meeting to determine the rate direction. If the Fed maintains a hawkish stance, GBPUSD is likely to come under renewed downward pressure.

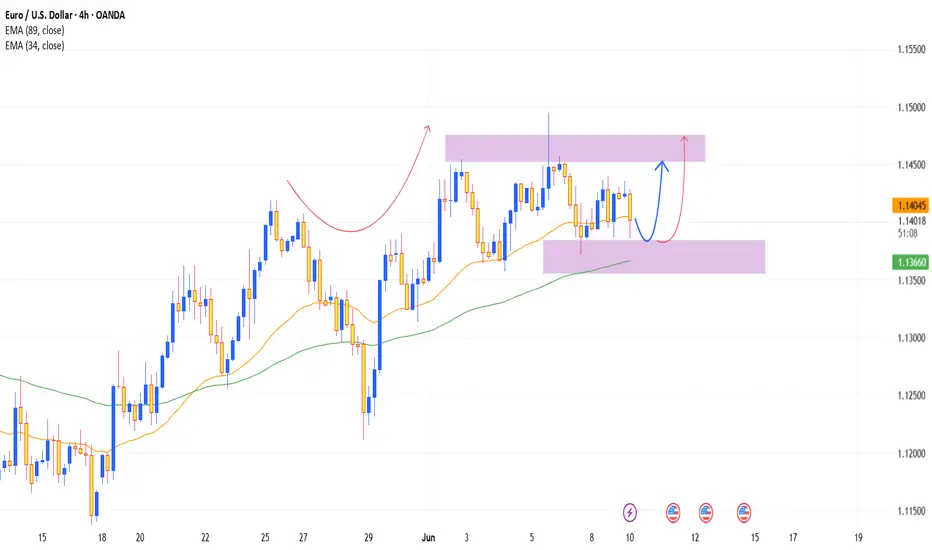
EURUSD – Price Holds Uptrend, 1.145 Zone Is the Key to BreakoutOn the H4 timeframe, EURUSD continues to move within a clearly defined ascending channel, consistently bouncing off the trendline and EMA34–89 cluster. Price is now approaching the 1.14500 resistance zone, which previously rejected bullish attempts twice. However, this time, price is consolidating just below resistance, indicating that buying pressure may be building.
If 1.14500 is breached with strong momentum, the next target will be 1.15000. Conversely, if price gets rejected again, the 1.14100 support zone will be crucial to watch for a reaction.
Meanwhile, news from the ongoing US–China trade talks is keeping gold highly volatile, creating a risk-on sentiment and weakening the USD—this may provide additional support for EUR’s bullish trend.

XAUUSD – Testing the Descending Trendline, Awaiting FOMC SignalsGold has rebounded to the 3,371 zone after U.S. CPI data showed cooling inflation, putting pressure on the USD. The price is now approaching the descending trendline and the 3,400 resistance zone – a level that marked the top on June 5.
If this area fails to break clearly, gold is likely to pull back toward the 3,327 support – the confluence of the EMA89 and a recent low. On the other hand, if the FOMC delivers a dovish signal, price could break out and aim for 3,457.
Trade Setup:
SELL near 3,400 if rejection candles appear
BUY near 3,327 if bullish reversal signals show
BUY breakout above 3,405 if FOMC supports further gains

EURUSD – Pressure at the Top, Correction Likely AheadThe EURUSD pair posted strong gains during the June 11 session, breaking through the 1.1480 resistance zone and reaching the top of the ascending channel near 1.15460. However, price action is showing signs of slowing down as it approaches the upper trendline that previously rejected price on June 3.
Currently, if the price fails to decisively break above the 1.15460 area, a technical correction toward the support zone at 1.14180—where the EMA 34 and lower channel line intersect—is highly likely. This zone will be key to monitor for potential trend-following buy opportunities if a clear recovery signal emerges.
Latest data shows U.S. CPI is easing, putting pressure on the USD. However, markets are now focused on tonight’s FOMC decision, which will play a crucial role in determining the next direction for the dollar.

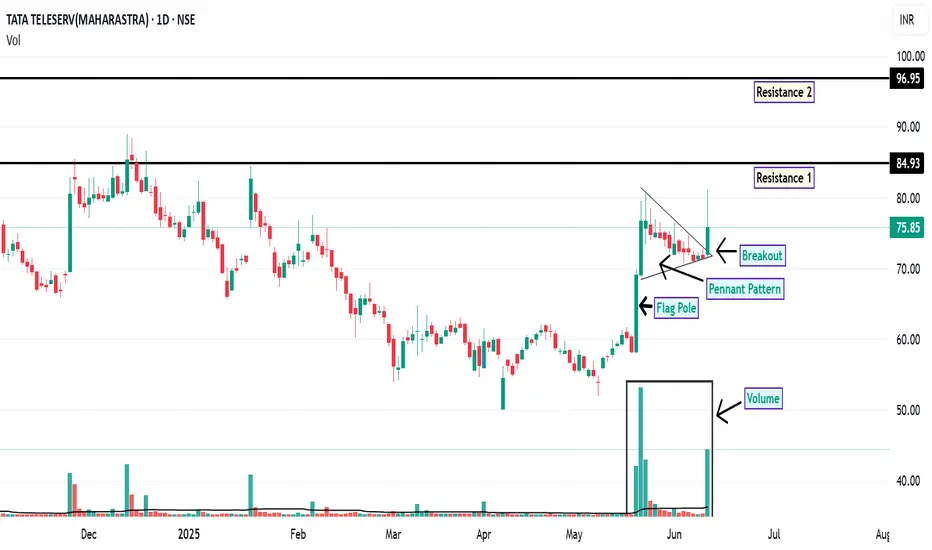
TTML: Pennant Breakout Signals Potential Upside
On the daily chart, TTML has recently exhibited a breakout from a pennant formation , a pattern often associated with potential continuation of the prevailing trend. This breakout is accompanied by a notable increase in trading volume, which may indicate growing market interest and participation.
Additionally, the price action has shown support at the 200-day EMA, a widely observed long-term trend indicator. This confluence of technical signals may suggest a strengthening bullish sentiment.
From a momentum perspective, both the RSI and MACD indicators are currently positioned in bullish territory on both the daily and weekly timeframes. This alignment across multiple timeframes can be interpreted as a sign of potential trend continuation.
Looking ahead, the price may revisit the ₹75 level, which could act as a demand zone. Should the stock manage to close and sustain above ₹76.40 , the next potential resistance levels to monitor are around ₹84.93 and ₹96.95 . For risk management, a suggested stop-loss level could be considered below ₹62 , based on recent support structures.
Disclaimer: This analysis is intended solely for informational and educational purposes. It does not constitute investment advice or a recommendation to buy or sell any financial instrument. Market participants are encouraged to conduct their own research or consult with a licensed financial advisor before making any investment decisions.
USDJPY – Momentum Fades Near 146 BarrierUSDJPY is approaching the significant resistance level at 146.020 following a parabolic rebound. This area previously triggered a sharp sell-off, and a minor double top pattern may be forming. If price gets rejected here, the support zone around 144.470 (EMA89 + demand zone) becomes a likely target for a pullback.
The recent upside was supported by hawkish comments from BoJ Governor Ueda, but the main market focus remains on the U.S.–China trade talks. If tensions ease, the USD could weaken, supporting the bearish scenario for USDJPY.

XAUUSD – Weak Rebound, Downside Pressure RemainsGold is currently testing the 3,339 resistance zone – a confluence with the EMA34 and EMA89, which has rejected price multiple times before. The current rebound is weak, suggesting that buyers are struggling. The bearish structure is becoming clearer with lower highs. If gold fails to break this resistance, it could retreat to 3,303; a break below that would likely open the way down to the 3,264 support level.
On the news front, the gold market is being heavily influenced by the ongoing U.S.–China trade negotiations in London. This major event could spark unpredictable volatility. If tensions ease, safe-haven demand for gold may fade, further supporting the short-term bearish outlook.

BTCUSDT – Strong rebound, waiting to break previous highsBitcoin is maintaining a fairly positive uptrend after bouncing from the support zone around 105,245 USDT – a confluence area of the EMA89 and previous lows on the 8H chart. Currently, the price has approached the key resistance area between 110,192 and 111,931, which has previously rejected bullish attempts twice.
Price action suggests that BTC may temporarily pull back to gather momentum before continuing to test the green resistance zone around 113,331. A short-term accumulation pattern is forming with a higher-low structure – a good sign for buyers as long as the price holds above the 106,000 area.
On the news front, investor sentiment has improved following weaker U.S. jobs data, reinforcing expectations that the Fed may cut interest rates sooner. This has prompted a return of safe-haven flows to the crypto market, adding fuel to BTC’s upward momentum.

GBPUSD – Choppy Below Resistance, Risk of Renewed WeaknessOn the H4 chart, GBPUSD is trading within a narrow range, fluctuating between 1.35740 and 1.34880. Each upward attempt toward the resistance zone has been quickly rejected. The price structure shows lower highs forming, while support areas are gradually moving lower.
The EMA34 and EMA89 are starting to flatten out, indicating the main trend is becoming increasingly unclear. If the price breaks below the 1.34880 level, a clear downtrend will be confirmed, and the scenario of a return to the long-term trendline becomes more plausible.
The key upcoming event is the U.S. CPI report, expected within the next 24 hours. If the data shows inflation remains high, the Fed will have less incentive to cut interest rates, potentially boosting the USD and putting downward pressure on GBPUSD.

EURUSD – Steady accumulation, ready for a fresh breakout?After a slight correction, EURUSD is trying to stabilize around the support zone of 1.13840 – which coincides with the EMA89 and a historically strong price reaction area. Although there hasn’t been a clear breakout yet, recent price action still shows an effort to maintain the bullish structure as the higher lows remain intact.
If buyers can take advantage of this support and build momentum, the next target could very well be the 1.14780 zone – an area that has rejected price multiple times and now serves as a key resistance level for the bulls.
Beyond the technical picture, the market is also awaiting this week's CPI, PPI, and NFP data. If these numbers come in weaker than expected, the likelihood of the Fed cutting rates sooner will rise – a positive signal for EURUSD. Moreover, with ongoing geopolitical risks, defensive capital flows may continue to exit the USD, giving the euro an edge in the coming sessions.
XAUUSD – Holding support, eyeing breakout aheadGold has paused its decline after falling out of the ascending channel and is now testing the support area around 3,279 USD. This zone is a confluence of a key demand area and recent swing lows. If this level holds, XAUUSD may rebound to retest the resistance near 3,358 USD – where the EMA34 and EMA89 are also positioned.
Notably, the long-term bullish structure remains intact, and price action may be forming a consolidation phase before a potential upward move. If upcoming CPI, PPI, and NFP data come in weaker, expectations of a Fed rate cut could rise – a factor that typically supports gold. Additionally, ongoing geopolitical tensions continue to bolster gold’s safe-haven appeal.

XAUUSD – Breaks Support Line, Risk of Deeper CorrectionOn the H4 timeframe, gold has officially broken below the ascending trendline formed since mid-May, after several successful retests. This is a clear sign that the short-term uptrend is losing momentum.
Following the trendline breakdown, price is currently making a mild pullback, retesting the confluence zone of EMA34–EMA89 around 3,323 to 3,336 USD. However, if this zone continues to act as resistance, the pullback pattern will complete and open up the possibility of further decline toward the next support area around 3,264 USD – which previously held price well.
Moreover, gold remains under pressure due to the US dollar’s strong rebound amid expectations that the Fed will maintain high interest rates. Hot CPI and PPI forecasts are delaying rate cut hopes, further weighing on gold prices.

XAUUSD – Shaky below resistance, clear bearish signal formingGold is showing signs of weakness after retesting the resistance area around 3,394 USD. The current price structure indicates a failed minor rebound – most likely a false breakout, suggesting the potential for another leg down.
On the H4 chart, price has slipped below the EMA34 and is heading toward the EMA89 zone. If selling pressure continues, the next target will be the strong support around 3,167 USD. A break below this level could trigger a deeper decline toward the 3,114 USD zone.
Notably, price action is forming a short-term “lower high” – a classic characteristic of a downtrend. The strategy now is to closely monitor the retracement zone around 3,320–3,330 USD for reversal signals, rather than trying to catch a bottom too early.
