USDJPY – Buying momentum builds, uptrend in sightUSDJPY has just bounced strongly from the key support zone around 142.510 – a level that has acted as a “fortress” over the past two weeks. Price action is gradually regaining momentum, forming a potential double bottom and heading toward a retest of the long-term descending trendline.
Currently, the 144.800–145.000 area is the nearest resistance, aligning with both the EMA and the descending trendline. If buyers maintain control, a breakout above this zone could pave the way for the next leg up toward 145.750 and beyond.
In terms of news, the latest U.S. ISM Services data came in weaker than expected, reducing rate hike expectations. While this puts mild pressure on the USD, the reaction from USDJPY suggests the market is leaning toward a rebound rather than a breakdown.
Longsetup

SILVER (MONTHLY- BULLISH )Price has given a proper breakout and restet of zone of
27.9156-30.2570
and again given a breakout of 27.9156-30.2570
Point To Note
- EMA 21.50.200 Lined Up Bullish
- Breakout And Retest
Next Resistance
-41.8665--44.2079
Till Then, Keep Learning

EURUSD – Strong uptrend, Non-farm could trigger breakoutEURUSD continues to maintain a steady uptrend within a well-defined ascending channel. Each pullback has been well absorbed around the EMA 34–89 and the dynamic support zone near 1.13650, signaling that buyers remain in control.
Currently, price is approaching the key resistance area around 1.14840 – a level that previously triggered a rejection. If it fails to break through again, a minor pullback toward the support zone followed by a bounce, as shown in the chart, is a likely scenario.
What’s worth noting is that the Non-Farm Payroll report is due later today – a potential catalyst that could either fuel a breakout or break the current channel. If U.S. job data comes in weaker than expected, the USD may face selling pressure, providing a strong boost for the euro.

XAUUSD – Awaiting Non-Farm, will gold hold its ground?The H8 chart shows gold retesting a key resistance zone around 3,426 USD after an impressive recovery run. Price action remains solid above the rising trendline and is supported by the EMA 34–89, indicating that the bullish structure is still well intact.
However, the upper resistance zone is causing some hesitation in the market. If gold fails to break through immediately, a minor pullback toward the 3,330 – 3,290 USD area is highly possible. If this zone holds, it would present a good opportunity to rejoin the uptrend.
On the news front, today’s spotlight is the U.S. Non-Farm Payrolls report. If the jobs data comes in weaker than expected, expectations for a Fed rate cut will likely increase – a scenario that could benefit gold significantly as a non-yielding asset.

USDJPY – Downtrend Continues, 143.500 Is the Key ZoneUSDJPY is moving within a clear descending channel and is now approaching the strong resistance area at 143.500 – where the EMA 34, EMA 89, and the upper trendline all converge.
Historically, each time price touched this zone, a strong rejection followed. If the same happens again, we could see a move back down to 142.000 and potentially 140.500.
On the fundamental side, the recently released U.S. ISM Services data disappointed, fueling expectations that the Fed might cut rates sooner – adding bearish pressure to the USD.
Preferred scenario: watch for price reaction around 143.500 to enter a short position in line with the downtrend.

EURUSD – Lower highs emerging, bearish signal in sight?Although the lower-than-expected jobless claims forecast could support a mild USD recovery, EURUSD is still holding above the EMAs in the short term. However, signs of weakness have begun to appear as price continues to get rejected around the 1.14800 zone – which aligns with a descending trendline that has been tested multiple times.
Currently, EURUSD is forming a lower high pattern on the H4 chart, indicating growing selling pressure. If this pattern continues and price breaks below the 1.13800 area, a deeper correction toward the 1.13600 support zone could be triggered. This level has repeatedly supported price in the past and coincides with the confluence of the 34 and 89 EMAs.

EURUSD – Strong push but might run out of steamEURUSD has just bounced nicely off the 1.13400 support zone. Price is now climbing back toward the previous high around 1.14500 – which looks promising, but also comes with some risk. This is a level that previously triggered a strong reversal, so if price fails to break through again, a pullback toward the lower EMA region is quite possible.
On the chart, I can see price approaching the upper boundary of the ascending channel, while buying momentum seems to be fading. If we see a reversal candlestick pattern or long upper wicks forming in this area, it might be an early sign of a short-term drop.
What about the news? The latest JOLTS report shows job openings in the US are slowing down, raising concerns about the labor market. At the same time, US–China trade tensions are flaring up again, and President Trump's unclear remarks on tariffs are making investors more cautious with the USD.

BTCUSDT – Squeezed enough, ready to explode?Bitcoin is currently trading within a converging triangle pattern – a setup every trader knows often signals an imminent breakout. The price is sitting between the EMA 34 and EMA 89, consolidating right above the long-term ascending trendline, indicating that buying pressure is still quietly in control.
The 105,000 – 106,000 USDT area is the key resistance zone to watch. If BTC breaks through this level decisively, it could trigger a new bullish wave aiming for 110,000+.
On the news front, market sentiment has turned optimistic again after the SEC Chairman hinted at the possibility of approving more Bitcoin ETFs in the upcoming quarter. This has given a strong psychological boost to the buying side.

EURUSD – In a tough spot as USD regains momentumThe sharp rise in ADP and ISM PMI forecasts is shifting market expectations: the Fed is now less likely to cut interest rates soon. This immediately supports the USD recovery and puts pressure on major currency pairs – EURUSD included.
Looking at the H4 chart, we can see price being rejected around the 1.14480 resistance zone, right when the EMA 34 and 89 lines are starting to tighten – a sign that the bullish momentum is fading. At this point, price appears to be heading back toward the 1.13300 support zone, which has held several times before. If this level breaks, the bearish move could extend toward 1.12890.

Inside Bars After High Volume – CERA Setting Up Near Key CT📌 Timeframe: Weekly (WTF)
📌 Type: Technical Observation / Swing Structure
📌 Concept: Counter Trendline Breakout Setup
CERA is currently navigating a highly constructive zone from a swing trading lens. Here's what's developing technically:
🔹 Higher Low Formation:
The stock has established a higher low structure, with the white internal trendline offering visible support across recent weeks. Interestingly, this aligns perfectly with the 200-period EMA on the weekly timeframe, enhancing its significance as a dynamic support layer.
🔹 Volume Clues:
Two of the highest volume candles on the weekly chart have now been followed by inside bars, a potential sign of absorption or base building. This tightening within volume zones signals institutional interest and a possible buildup phase.
🔹 Supply Zone Identified:
An overhead supply (marked in orange)
🔹 EMA Context: The blue 200 EMA further reinforces the idea of Supportive price behavior around this line validates its role.
🔍 This post is for educational discussion only. No recommendation or forecast is implied. Please conduct your own due diligence.

RITES LTD - Bullish Flag & Pole Breakout (Daily T/F)Trade Setup
📌 Stock: RITES LTD ( NSE:RITES )
📌 Trend: Strong Bullish Momentum
📌 Risk-Reward Ratio: 1:3 (Favorable)
🎯 Entry Zone: ₹295.00 (Breakout Confirmation)
🛑 Stop Loss: ₹260.00(Daily Closing Basis) (-12% Risk)
🎯 Target Levels:
₹309.90
₹326.15
₹338.05
₹355.90
₹374.25
₹392.35 (Final Target)
Technical Rationale
✅ Bullish Flag & Pole Breakout - Classic bullish pattern confirming uptrend continuation
✅ Strong Momentum - Daily & Weekly RSI >60 (Bullish zone)
✅ Volume Confirmation - Breakout volume 10.67M vs previous day's 1.06M (Nearly 10x surge)
✅ Multi-Timeframe Alignment - Daily and weekly charts showing strength
Key Observations
• The breakout comes with significantly higher volume, validating strength
• Well-defined pattern with clear price & volume breakout
• Conservative stop loss at recent swing low
Trade Management Strategy
• Consider partial profit booking at each target level
• Move stop loss to breakeven after Target 1 is achieved
• Trail stop loss to protect profits as price progresses
Disclaimer ⚠️
This analysis is strictly for educational purposes and should not be construed as financial advice. Trading in equities involves substantial risk of capital loss. Past performance is not indicative of future results. Always conduct your own research, consider your risk appetite, and consult a financial advisor before making any investment decisions. The author assumes no responsibility for any trading outcomes based on this information.
What do you think? Are you watching NSE:RITES for this breakout opportunity? Share your views in the comments!

GBPUSD – Stalling at resistance, correction ahead?The market is reacting to a series of strong US economic data, especially the rising expectations for ADP and ISM PMI figures. This has boosted the USD, putting pressure on major currency pairs, including GBPUSD.
Looking at the H4 chart, GBPUSD is trading near the resistance zone around 1.35959 while also testing a long-term descending trendline – a level that has previously rejected price multiple times. Notably, although price is still holding above the EMA 34 and 89 support zone, recent candles reflect clear hesitation, suggesting the pair is “stuck at a crossroads.”
A reasonable technical scenario: if the price continues to be rejected at 1.35959 and breaks below the EMA confluence and support area at 1.34994, a short-term downtrend may resume. The nearest target would be around 1.34530 – a strong technical support that has held up price in the past.

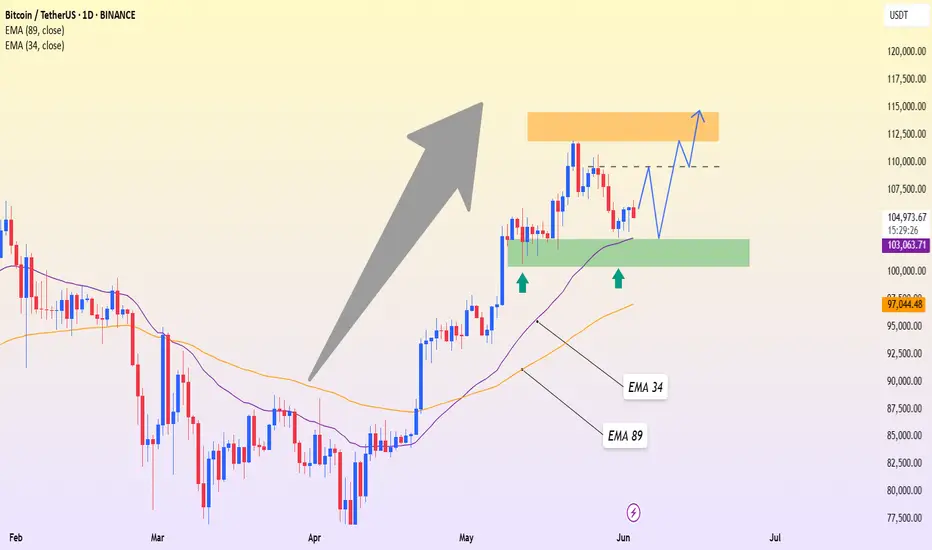
BTCUSDT – Still Has Upside Potential, as Long as Support HoldsBitcoin is showing strong signs of recovery after retesting the support zone around 102,574 – which also aligns with the 34 EMA on the D1 chart. This bounce suggests that buying pressure remains intact and the market continues to respect the overall bullish structure.
If BTC can hold this area over the next few sessions, a breakout toward the resistance zone at 114,461 is a realistic scenario. With enough momentum, price might even break above the previous high and head toward the 118,000+ region.
That said, the 102,500 – 103,000 area is now the “make-or-break” zone. If it gets breached, the uptrend could be in jeopardy, and BTC might correct deeper toward the 89 EMA.
XAUUSD – Pullback ahead of potential breakout above 3,433The latest forecasts show that both ADP and ISM PMI data in the US are rising, reflecting a stronger-than-expected economic recovery. This has led the market to scale back expectations of an imminent Fed rate cut. As a result, the dollar is gaining strength, putting short-term downward pressure on gold.
On the H4 chart, XAUUSD is trading within a consolidation range between two key levels: support at 3,346 and resistance at 3,433. Price was recently rejected at the previous high but has not shown any clear reversal signal. The 34 and 89 EMAs are acting as a technical cushion, keeping the broader bullish trend intact.
The scenario to watch: if price continues to stabilize around the 3,346 zone without breaking below, a clean consolidation structure could form. In that case, a breakout above 3,433 would be a confirmation signal for another bullish wave—opening the door to higher targets ahead.

USDJPY – Rebounding from Support after Positive PMI DataIn the latest session, USDJPY is gradually regaining its upward momentum after the US released a better-than-expected manufacturing PMI. The data suggests that the US industrial sector remains strong, reducing pressure on the Fed to ease policy. As a result, the US dollar benefited, lifting USDJPY off its recent technical bottom.
On the H4 chart, the pair is trading within a sideways range between 142.200 and 144.800. Each time it approaches the 142.200 level, buying pressure returns, forming a solid support zone. Although EMA 34 and EMA 89 are slightly sloping downward, the signals are not strong enough to break the current accumulation structure.
Expected scenario: if the price continues to hold above the 142.200 support zone and forms a solid accumulation pattern, USDJPY is likely to bounce toward the 144.800 area – which may act as the next short-term resistance. On the contrary, if the support breaks, the structure could shift into a more bearish outlook.

Gold: Signs of exhaustion after the surge?We’ve just witnessed a fairly impressive rally in gold at the start of the week — not too surprising given that the latest JOLTS data showed a slowdown in U.S. job openings, coupled with a sudden escalation in U.S.–China trade tensions. With growing risk aversion, it’s no wonder investors are turning to gold as a “safe haven.”
But here’s the catch: is this rally sustainable?
On the H4 chart, gold has just revisited the old resistance zone around 3,384 — a level that previously pushed prices sharply lower. As price approached this zone, we started seeing upper wick rejections, signaling that buying momentum is fading.
A possible scenario: If price fails to decisively break above 3,384 and continues to get rejected on subsequent retests, there’s a high chance gold may pull back toward the support area around 3,288. This is also the “lifeline” zone near the EMA 34–89, which may act as short-term support.

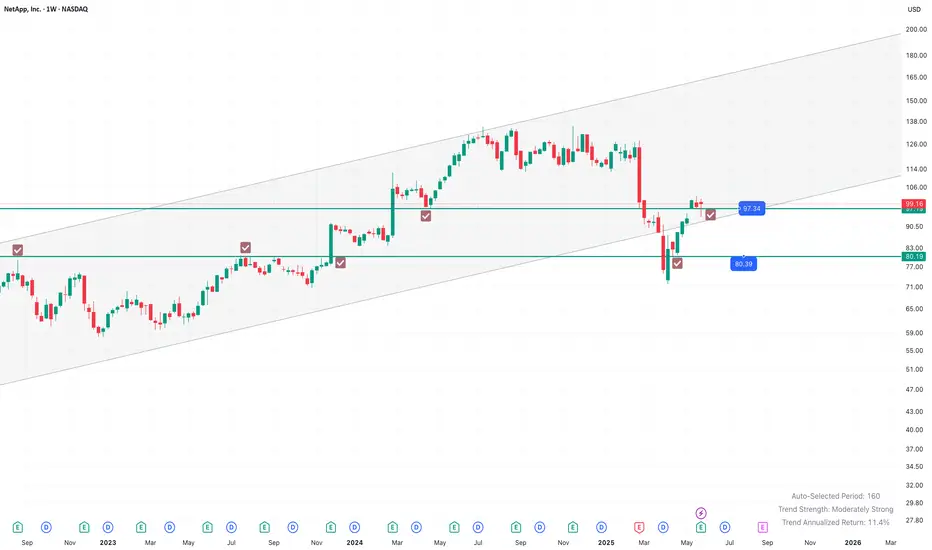
NetApp Inc shows bullish candlestick in larger timeframeNASDAQ:NTAP price action shows bullish candlestick pattern in the Monthly Chart. As well as in Weekly chart, it shows steady rejection and showing a sideways consolidating trend.
Lets analyze first weekly timeframe:
We can see during April'25 (Tariff Trauma weeks) the price made a low of $74, breaching down the $80 mark.
But within one week it again regains back the strong, historical demand zone of $80 and continue it's upsurge towards $100. It made a recent weekly high of $102.
Last 3 weeks was a consolidating around $97 to $100 level, keep on honouring the support of $97.
Last week, during timid FY24-25 Q4 earnings, we can see it falls back to $94. And seen a rejection there during last trading session of Friday, 05/30 and close the week with a Dragronfly dozi candlestick pattern (albeit the body color is red). Still the bottom rejection wick and holding back $97 is a sign of 'don't give up so easily'.
Whereas in monthly timeframe, it shows absolute bullishness:
The April month candle was a book-perfect Dragronfly doji.
This May month candle is a super bullish (sort of) Marubozu candle, even the low is above the last monthly close.
It's indicates a confirmative bullishness in monthly
Verdict:
This NASDAQ:NTAP counter is expected to be sideways-to-bullish in coming weeks.
Immediate Support levels are: $97, $89 (200 WSMA), $80.
There is no reason of it getting close below $80. That's becomes the new normal Low of the counter.
It's going through a typical consolidation and distribution phase for gathering new energy to resume it's upmoving in coming medium terms.
Stay Invested or Keep on accumulating , specially on every dips.
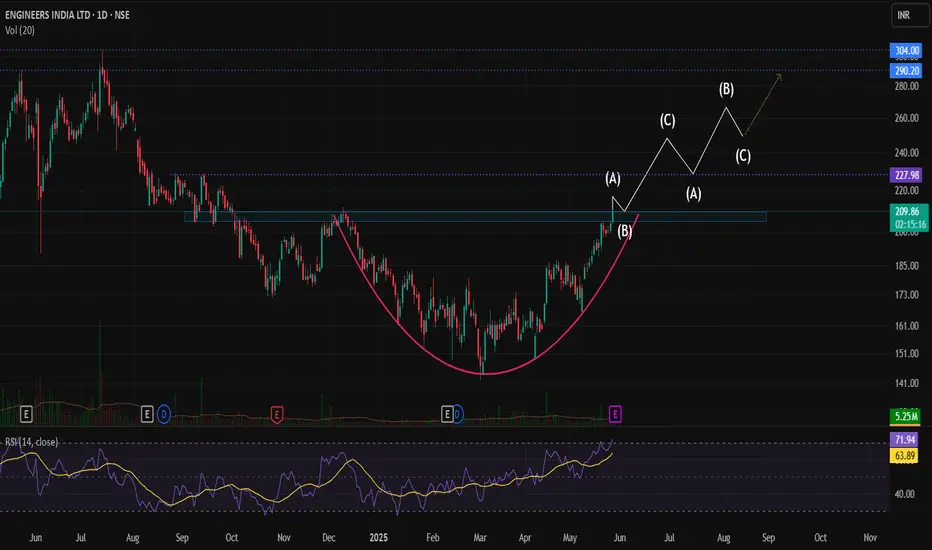
Engineers India – Technical Analysis & Trade SetupEngineers India Ltd has recently formed a rounding bottom pattern on the chart, a classic bullish reversal pattern that suggests a shift in momentum from bearish to bullish. The key resistance level lies at ₹210-212 price zone, and a breakout above this level with strong volume will confirm the pattern.
📈 Breakout Confirmation & Retest Zone :
A decisive close above ₹212 will mark a technical breakout, putting the stock at its 8-month high. Post-breakout, a retest of the ₹205–₹210 zone is likely. If the stock takes support and consolidates in this zone, it will indicate strength and readiness for the next upward leg.
📅 Fundamental Trigger – Q4 Results :
Investors and traders should closely monitor the Q4 results scheduled for 29 May. A strong earnings report could serve as a catalyst to support the technical breakout and sustain the uptrend. Conversely, a weak result may delay or invalidate the breakout momentum.
🎯 Targets & Price Action Outlook:
- Short-term buying range: Between ₹210 and ₹215.
- Immediate target: ₹250
- Next targets: ₹290 and eventually ₹300, which may take 3–4 months to achieve if the trend sustains.
- Stop loss can be placed at ₹185.
⚠️ Key Points to Watch:
- Volume confirmation on breakout above ₹212.
- Retest and support around ₹205–₹210.
- Q4 earnings impact on price action.
- Keep a disciplined stop-loss strategy based on risk appetite.
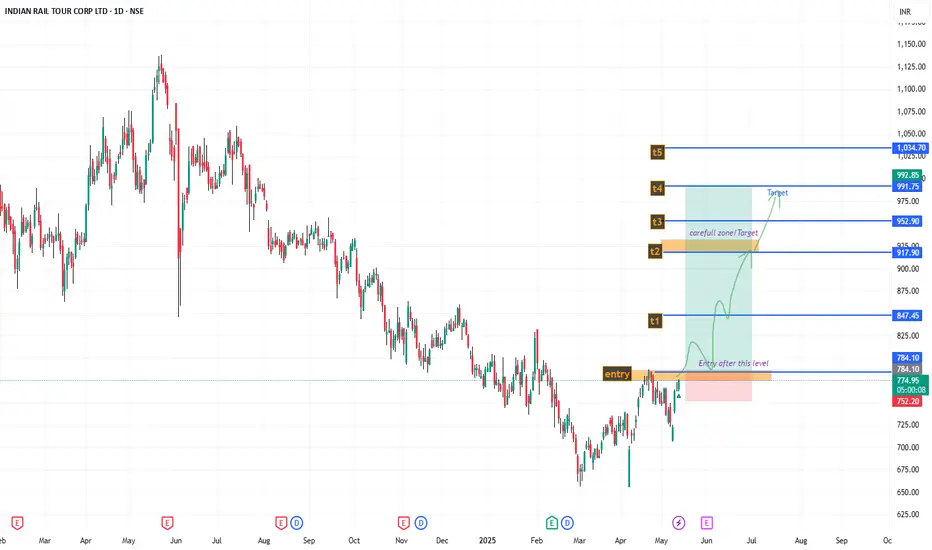
IRCTC , Looking good ; min 25% Roi ; swing For short term investment ;
Leave a " Like If you agree ".👍
.
Wait for small retracement & daily candle to close above - "785".
Trade carefully untill ENTRY level.
.
Entry: 785
Target: 850-917-991
sl: 745
major stoploss/ support: 700.
.
Enter only if market Breaks
"Yellow box" mentioned.
.
.
Don't make complicated trade set-up.📈📉
Keep it " simple, focus on consistency "💹
Refer our old ideas for accuracy rate🧑💻
Follow for daily updates👍
.
Refer old posted idea attached below.
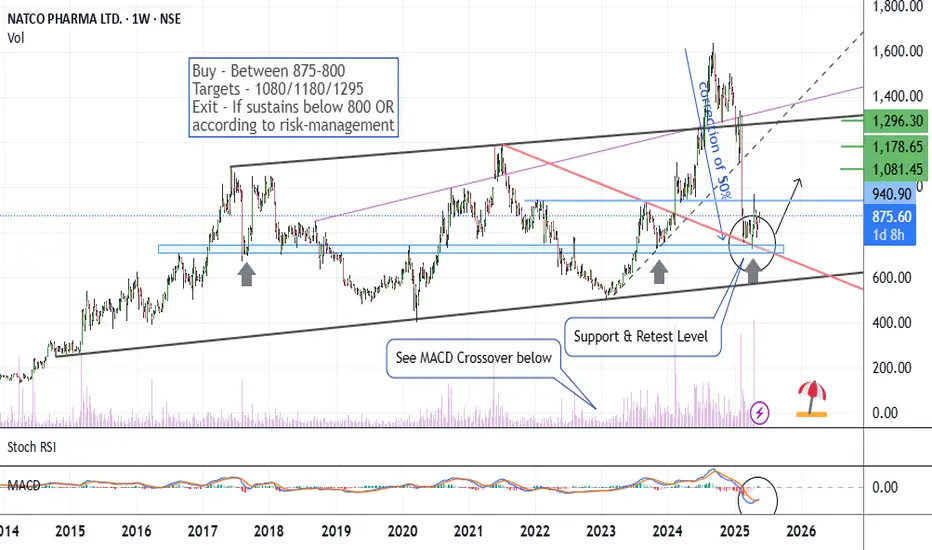
Natco Pharma - Enough CorrectionCMP 875 on 22.05.25
The stock price dropped 50% between September 2024 and March 2025. In recent days, it has been consolidating near the 800 levels, which is acting as a support zone, as shown on the chart.
MACD shows a likely crossover, too.
If it gives an upside move, further targets may be 1080/1180 or more.
One has to keep the position size according to the risk management.
The setup will go weak if it sustains below 800-775 levels.
All these illustrations are only for learning and sharing purposes, not a piece of trading advice in any way.
All the best.
Credit rating downgrade and weak US economic data weaken the USD🔔🔔🔔 Gold news:
➡️The US dollar is attempting to stabilize following a previous decline, driven by a resurgence of the "Sell America" narrative, which triggered a broad sell-off in US assets across global financial markets. On Friday, Moody's downgraded the US sovereign credit rating by one notch from the pristine "Aaa" to "Aa1", undermining the "US brand."
➡️ Investors remain wary of the country's long-term fiscal outlook. According to Reuters, analysts have warned that Trump's sweeping tax cut proposals could add an additional $3 to $5 trillion to the nation's $36.2 trillion debt over the next decade. In response, risk-off flows dominated on Monday, boosting demand for the traditional safe-haven gold.
Personal opinion:
➡️ Gold prices remain in the 3190 – 3250 range and await the results of potential US trade agreements with India, South Korea and Japan.
➡️ Analysis based on resistance - support levels and EMA combined with trend lines to come up with suitable strategies
Personal Plan:
🔆Price Zone Setup:
👉Buy Gold 3189 - 3192
❌SL: 3185 | ✅TP: 3196 - 3200 – 3205
👉Sell Gold 3203 - 3206
❌SL: 3199 | ✅TP: 3210 - 3215 – 3220
FM wishes you a successful trading day 💰💰💰

AHL -Bottom FishingThe stock price has dropped around 60-70% in the last 6 months. From an all-time high to an all-time low in just 6 months.
This time, it is consolidating at the lowest prices for a month.
If it gives a bounceback, it could be a good trade setup with a good risk-reward ratio.
The projected targets are 260/350 or more.
The setup remains active above the price of 180. It loses significance if sustained below 160.
All these illustrations are only for learning and sharing purposes. not a buy or sell recommendation.
All the best.
ALong

PI Industries looking up to reach 4200 in short to long termPI industries has broken the resistance level after a solid consolidation for more than one month. The bullish engulfing candle has come past the resistance level. It should come down to test the same level and progress towards 4200 in short to long term.
