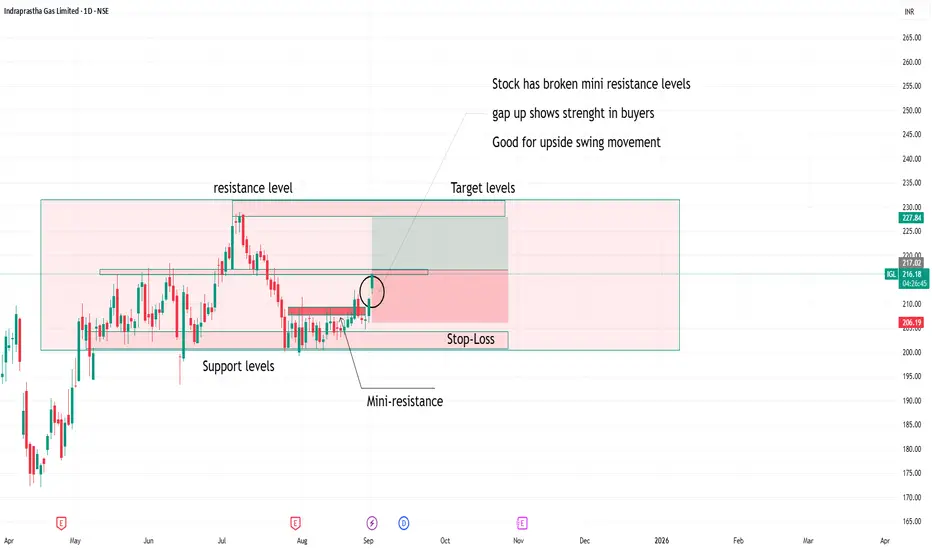
Igl good for upside swing movementstock has broken mini resistance levels
gapup shows strength
with strict stoploss and targets one can watch or observe this stock for upside
Longsetup
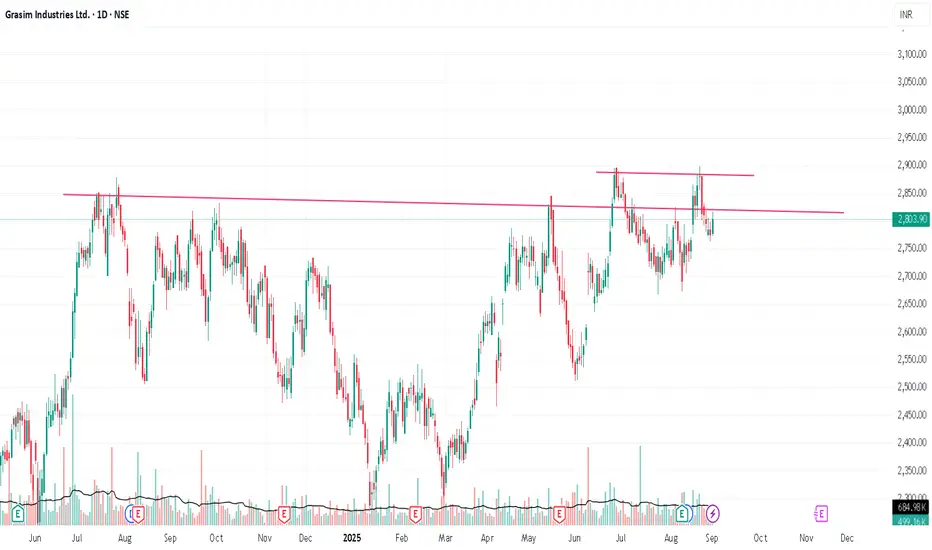
Flexing at All Time HighGrasim broke a cup & handle pattern and came down, again trying to break another trendline at top of the cup & handle pattern. if it breaks and sustain above the latest breakout with good volume, it'll move up for sure.
***This is only for educational purposes***
Btc long 1H TimeframeKey Observations:
1. Chart Type & Indicators:
• Timeframe: 1 Hour (1H)
• Indicators: EMA 9 (yellow), EMA 20 (blue) for short-term trend tracking.
2. Price Action:
• Current Price: 109,260 USDT
• Recently bounced sharply after a strong dip, showing bullish recovery.
3. Pattern:
• There’s a visible ascending triangle (orange lines), which usually indicates bullish continuation if price breaks upward.
• Price has broken out of the small ascending trendline with momentum.
4. Trade Setup (Long):
• Entry Zone: Around 109,260 USDT
• Target (TP):
• First resistance near 111,998 USDT
• Next major resistance around 113,217–113,431 USDT
• Stop Loss (SL): Around 107,200–107,386 USDT
5. Volume:
• Noticeable increase in buy volume at the breakout, confirming bullish pressure.
⸻
✅ Summary:
This is a long position setup based on breakout from an ascending structure. If BTC holds above the 109,000–108,500 support zone, it has potential to test 112k–113k levels. Stop loss is placed below the recent swing low (~107.2k).

Dixon Inverted HnSDixon Technologies is making a inverted Head n shoulder in the daily timeframe.
One can look for taking an entry at the retest of 17300-17320. Support can be considered at todays low. Keep a Check on the Chart and you will get to see how a head n shoulder is made.
Usually the Support for a HnS is right shoulder low so mid term traders can consider that level.
Follow for such more Analysis.
Jai Shree Ram.

Uptrend in OLA. broken resitance1.) Resistance has broken with huge buying volume
Good for swing upward move
2.)Follow strict stop loss with targets
3.) technically good if fundamentals get strong then good for long term with 130 to 140 levels.

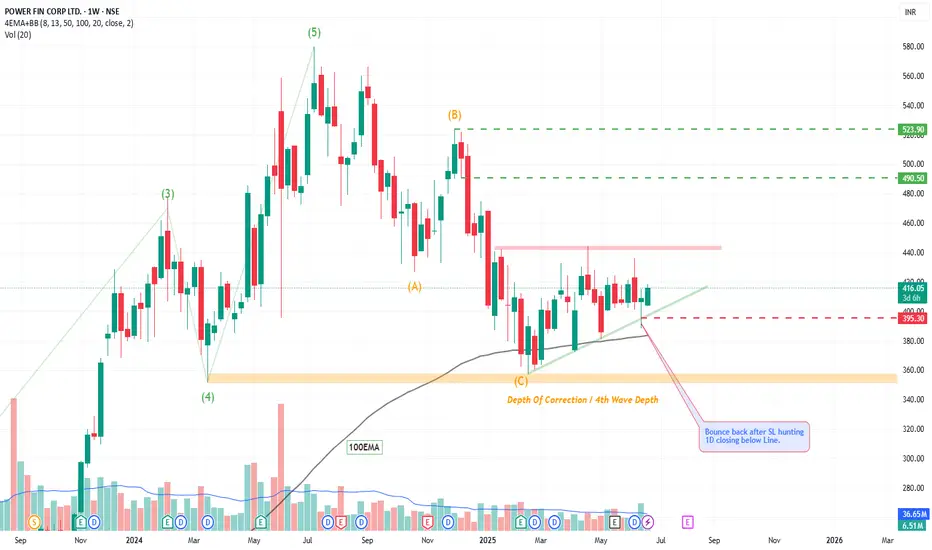
PFC By KRS Charts24th June 2025/ 9:40
Why PFC?
1. Fundamentally Good Company + Regular Dividend Payouts.
2. Technically, Feb 2025 low depth was equals to impulse Wave 4 , which shows correction got its full depth from wave theory perspective .
3. After Depth of Correction , it gave fake sell entry from 100EMA also and bounce back in Feb- Mar 2025 and sustaining above 100EMA currently.
4. Recently price action was making some sort of sideways pattern Flag or Triangle but most imp. is that I have noticed in mid-June in 1D TF it gave closing below support zone and from next day it enters back above the zone. which denotes SL hunted and Sellers got fake entry.
Note: Market do shakeout before breakout just to shake early investors and to hit SL of Breakout Traders. Can happens both sides Buy and Sell.
SL & Targets are mentioned!!
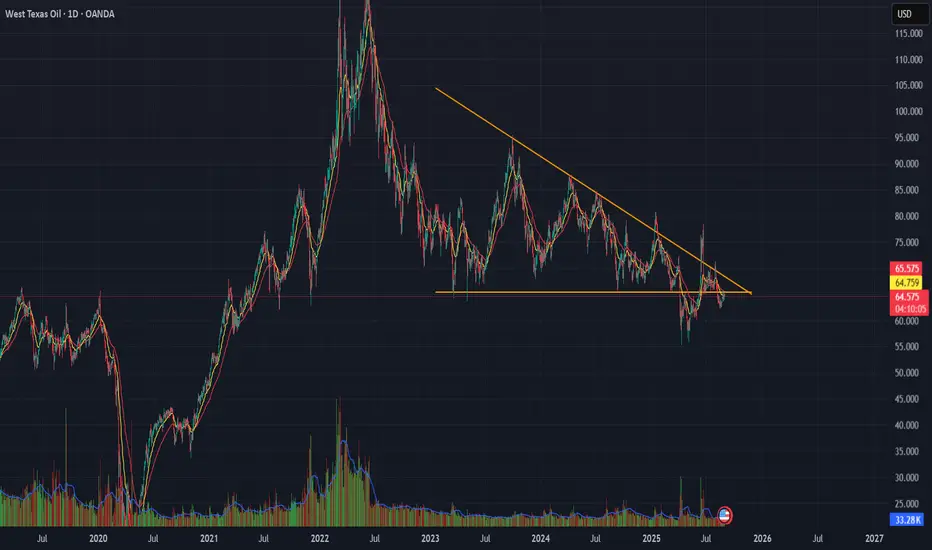
WTI Crude Oil Descending Triangle Pattern
WTI is forming a Descending Triangle pattern near recent support.
📊 Technicals : Flat base with lower highs compressing price action.
🔎 Key Levels: Breakdown below support 65 Leads To bearish continuation;
bounce above resistance 71 Leads To reversal setup.
⚠ Risk View: Energy fundamentals remain mixed — confirmation with volume is essential.
👉 Tactical takeaway: Wait for a breakout from the triangle before committing directionally.
A strong ~1:10 RnR XAUUSD/Gold trade idea.Gold has created a good price action which may lead to a very high RnR price movement.
Here are signals identified for the trade.
1. It is breaking trend inline after and earlier fake out. Which is a strong signal for upside move.
2. Taking reversal at golden zone of 4H last swing.
3. Rejection candle at 1H.
4. Bullish diversanse is already observed in RSI
5. Taking support from bullish trend line.
6. 5m W pattern is created and breakout done.
7. Price is taking pull back to broken resistance.
8. It may 1:10 trade if everything goes as plan.
9. Price rejection should be observed at the pullback level before taking further upside movement.
P.S.- This is jut an idea not trade recommendations.

BTCUSD Long Setup – Trend Continuation Play📌 Trade Details
Entry: 113,256.5
Target: 115,317.7
Stop Loss: 111,874.4
📊 Trade Rationale
✅ Trend Continuation: Price has respected the ascending trendline multiple times, indicating strong buyer interest.
✅ Break of Structure: Recent higher highs and higher lows confirm bullish momentum.
✅ Support Flip: Zone around 113,050 acted as resistance earlier and is now being retested as support.
✅ Volume Confirmation: Rising volume supports the bullish continuation bias.
✅ Clean Risk–Reward: With SL below structure and TP near major resistance, this setup offers a favorable RRR.
🎯 Target Zone
The target aligns with the next strong supply zone at 115,300+, where sellers may re-enter.
⚠️ Risk Management
Always size positions wisely, as crypto remains highly volatile. Protect your capital first.
Disclaimer:
This idea is for educational purposes only and not financial advice. Do your own research before entering any trade.

ETH Long🔎 Chart Breakdown:
1. Trendline Support (Orange Line)
• You’ve drawn an ascending trendline starting from Aug 26.
• Price just touched and bounced from this trendline around $4,490, showing it’s acting as a dynamic support.
2. EMA Indicators (15 & 35)
• Blue = EMA 15
• Yellow = EMA 35
• Currently, EMA 15 is below EMA 35 → short-term bearish bias, but if price holds the trendline, EMAs may start crossing bullish.
3. Support & Resistance Zones (Red & White Levels)
• Immediate support: $4,467 → just below current price.
• Major support: $4,370 → strong horizontal demand zone.
• Resistance levels:
• $4,570 (short-term resistance)
• $4,656 (next target/resistance)
• $4,854 (higher resistance).
4. Trade Setup on Chart (Green & Red Box)
• Looks like a long trade setup (buy position).
• Entry: Near $4,490 (trendline bounce).
• Take Profit (TP): Around $4,656.
• Stop Loss (SL): Below $4,370 zone.
• This gives a good risk-to-reward ratio if price respects the ascending trendline.
5. Volume
• No huge volume spike at the bounce, meaning confirmation is still weak.
• Need a strong bullish candle close above $4,570 for more conviction.
⸻
📌 Summary:
• ETH is bouncing from the ascending trendline at $4,490.
• If it holds, next upside targets are $4,570 → $4,656 → $4,854.
• If the trendline breaks, ETH could retest $4,370 support (and even $4,310 low).
This setup is a long position based on trendline support, but caution: if price closes below $4,467–$4,370, the bullish setup fails.

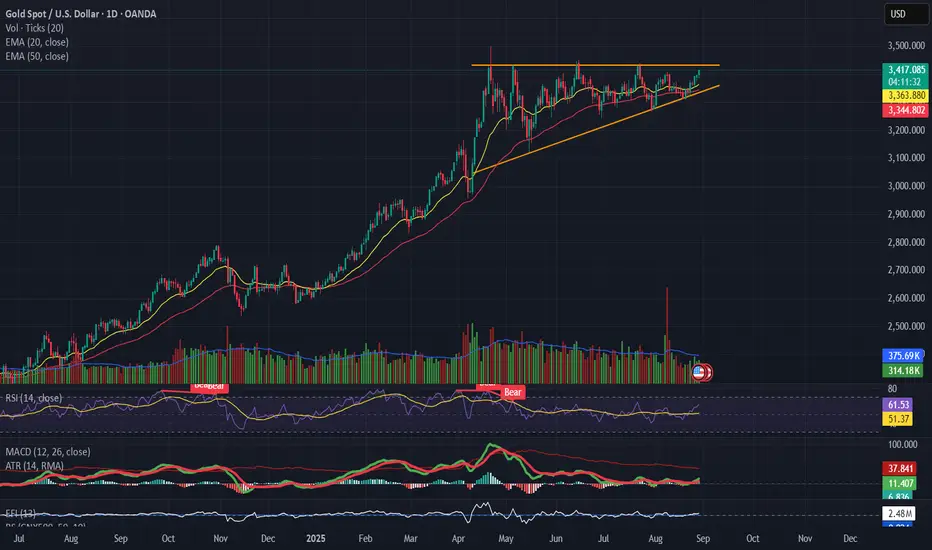
GOLD(XAUUSD) Forming a pennant / ascending triangle 📌 Gold (XAUUSD)
Forming a pennant / ascending triangle with strong resistance near $3,390 – 3,400.
Volume is declining, suggesting indecision.
RSI holding above 50 but not powering higher → momentum is slowing.
MACD flatlining, no fresh bullish impulse yet.
👉 Breakout above $3,400 needed for continuation. Breakdown below $3,340 risks correction.
BNB/USDT – Bullish Breakout Trade Idea✅ Entry: 871.564
🎯 Target: 890.455
⛔ Stop Loss: 862.304
🔎 Trade Rationale:
Ascending Triangle Breakout – Price has respected the rising trendline and finally broken above the neckline resistance, signaling bullish continuation.
Volume Confirmation – A notable increase in buying volume supports the breakout strength.
Resistance Flip – The previous supply zone around 870 has turned into support, adding confluence.
📊 With a strong bullish structure and favorable RRR, this setup aims to capture the next push towards 890 zone.
⚠️ Disclaimer: This is not financial advice. Always do your own research and manage risk before trading.

XAUUSD: Maintaining Support, Gold Aims for New Highs!Based on the latest data and chart for XAUUSD, it can be seen that gold is in an uptrend after holding strong above the key support level at 3,373.70. The chart indicates that if gold maintains above this support zone, the next target will be 3,413.00, with the potential to continue rising higher if the current support area is not broken.
Technical Analysis: XAUUSD is currently trading near the support zone at 3,373.70 and resistance at 3,413.00. If the price remains above 3,373.70, the uptrend will continue with the target at 3,413.00. The nearest support levels are 3,373.70 and 3,362.00.
Fundamental Signals: Weaker economic data from the U.S., especially the higher-than-expected PCE index and lower-than-expected jobless claims, have increased expectations that the Fed will cut interest rates. This has put pressure on the USD and supported gold’s recovery.

BTC 1H Long1. Current Price
BTC is trading around 110,879 USDT at the time of the chart.
2. Trendline
• An ascending trendline is drawn from the recent bottom, showing short-term bullish momentum.
• Price is testing support at this trendline.
3. Entry Zone
• Marked slightly above 110,500 USDT.
• Idea: enter long position as price holds above support & trendline.
4. DCA (Dollar-Cost Average) Zone
• Around 109,383.5 USDT.
• If price dips here, it’s a secondary buy zone to improve average entry.
5. Stop Loss (Invalidation)
• “1H Closing Below” ~108,534 USDT.
• If BTC closes below this level on 1H, the long setup is invalid.
6. Targets
• TP1 (Take Profit 1): 114,658 USDT
• TP2 (Take Profit 2): 115,980 USDT
• These are resistance levels where partial or full profits can be booked.
7. Risk-Reward Setup
• Entry around 110,500 → Stop below 108,534 → TP1 at 114,658, TP2 at 115,980.
• This gives a good Risk-to-Reward (RRR > 2) if the setup plays out.
8. EMA Levels
• Multiple EMAs (20/50/100/200) are shown.
• Price is still trading below the EMAs, meaning trend is bearish overall, but this setup is a counter-trend long scalp.
⸻
📌 Summary
• Bullish Scenario: If BTC holds above the entry and trendline, it can push toward 114,658 (TP1) and 115,980 (TP2).
• Bearish Scenario: If BTC breaks below 108,534 on 1H close, the long setup fails, and price may revisit lower supports.

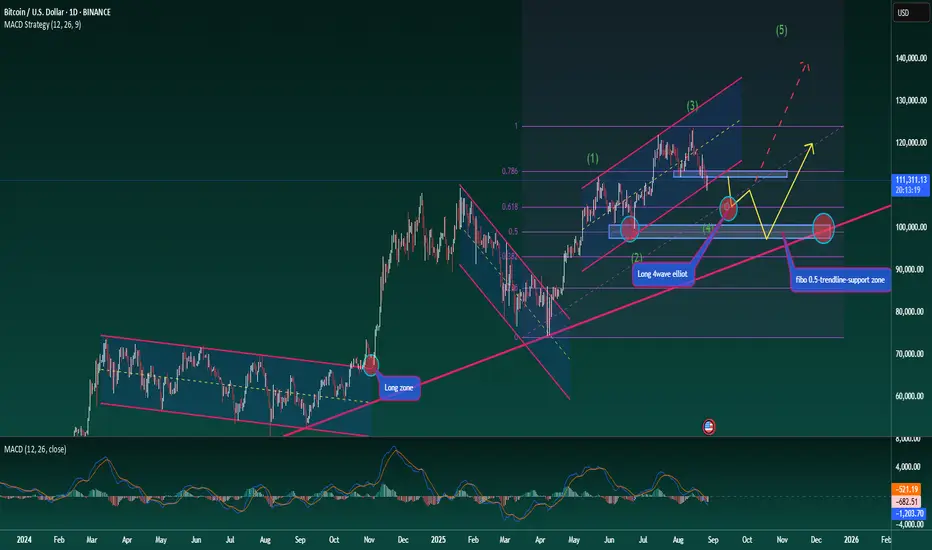
Bitcoin – Long-Term View with Elliott Wave StructureBitcoin – Long-Term View with Elliott Wave Structure
Hello traders,
Let’s take a medium- to long-term look at BTC. The broader trend is clearly bullish, but for any uptrend to be sustainable, healthy corrections are necessary. At present, BTC is moving through a corrective phase, identified as wave 4 in the Elliott Wave structure.
To gauge how far this correction may extend before wave 5 begins, we can apply Fibonacci Retracement. Two key levels stand out: 0.618 and 0.5.
At 0.618, we see a strong support zone, but it may not yet be the decisive level for confirming the wave count. If BTC reacts positively here and rallies into wave 5, the Elliott structure remains clean and valid.
At 0.5, the level aligns with an ideal Fibonacci retracement ratio and also shows up as an important structural support on the chart. A break below this could trigger deeper downside, as highlighted by the ascending trendline.
Long-Term Trading Plan
Entry 1: Around Fibonacci 0.618 at 105k
Entry 2: Around Fibonacci 0.5 at 99k
This outlook fits a medium-term plan, but if the second zone (99k) provides a strong reaction, it could also become the base for a longer-term bullish structure.
Stay disciplined, monitor these levels closely, and trade with proper risk management.
What’s your view on BTC’s long-term structure? Share your thoughts in the comments.
Is Gold's Bullish Trend Here to Stay?On the chart, gold has broken through the previous small downtrend channel, opening up new opportunities for a rally. The $3,360 level has become a key support, while the nearest resistance targets are at $3,430 and $3,458. The current price structure shows a clear "break & retest" scenario, with buying momentum dominating as gold stays above key EMA levels.
Supporting News for Gold's Bullish Trend:
The weakening USD, declining U.S. bond yields, rising geopolitical tensions, and the potential for a Fed rate cut have created favorable conditions for gold's upward movement. Fed Chairman Jerome Powell's comments at Jackson Hole signaled that the Fed could ease tightening if the labor market weakens, strongly supporting gold's bullish trend.
Trading Strategy:
Buy on dip around $3,360–$3,365.
Target at $3,430 and $3,458.
Stop-loss below $3,350 to manage risk.
If the Fed maintains its dovish tone and the USD remains weak, gold is likely to continue its upward momentum in the short term, opening the door for higher price levels in September.

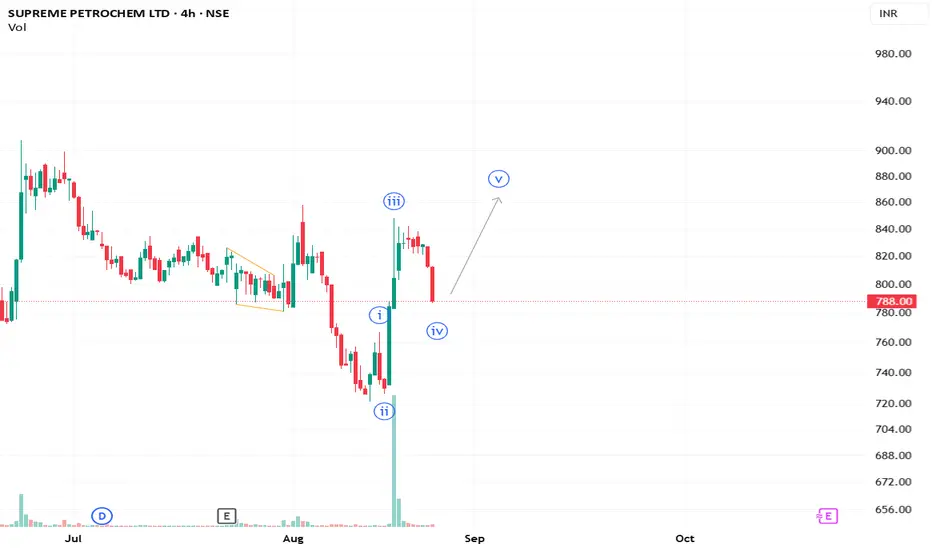
Supreme Petrochem Ltd – Possible 5-Wave StructureThe chart is forming a 5-wave pattern. After the Wave (iii) rally and current Wave (iv) correction, the next move could be an upward push into Wave (v).
**This is an educational market outlook, not investment advice. Please consult a SEBI-registered advisor before taking any investment decisions.**
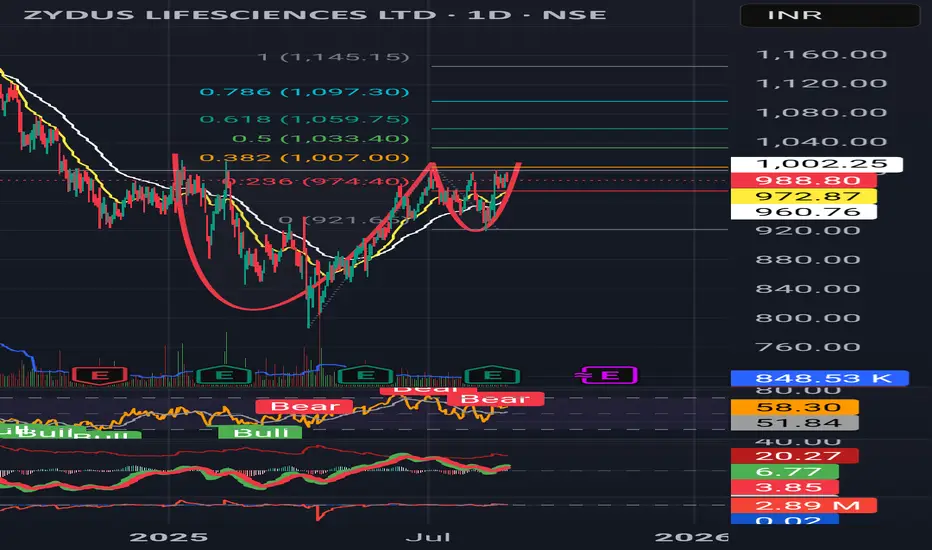
Zydus Lifesciences – Cup and Handle Breakout SetupThe stock has formed a classic Cup and Handle pattern, with a breakout zone around ₹1,010–1,020. A successful breakout above this level indicates bullish continuation, with a projected upside target of around ₹1,235.90 (21.5% potential).
The daily RSI (67.49) and weekly RSI (61.78) are both rising, signaling strong bullish momentum with room for further upside. The MACD also remains in positive territory, reinforcing the bullish trend.
A sustained breakout above ₹1,010–1,020 can be used as an entry point, with an upside target of ₹1,235, while maintaining a stop loss at ₹919 to manage risk below the handle low.
Disclaimer: The information provided in this analysis is for educational and informational purposes only and should not be considered as financial or investment advice.

XAU/USD: Rally Strengthened by News FlowGold remains in a positive stance after the “dovish” signals from the Fed at Jackson Hole, with expectations of a September rate cut gaining traction. As a result, the US Dollar has weakened, providing additional support to XAU/USD.
On the chart, price has rebounded from the 3,313 support zone and is now eyeing the key resistance around 3,405. A decisive break above this level could extend the rally towards 3,440 – an area that has previously attracted heavy selling pressure. On the other hand, any minor pullback would likely be seen as a “buy-the-dip” opportunity within the current uptrend.
With alignment between fundamentals and technicals, XAU/USD is flashing a clear bullish signal, making it favourable for traders to ride the upward momentum.

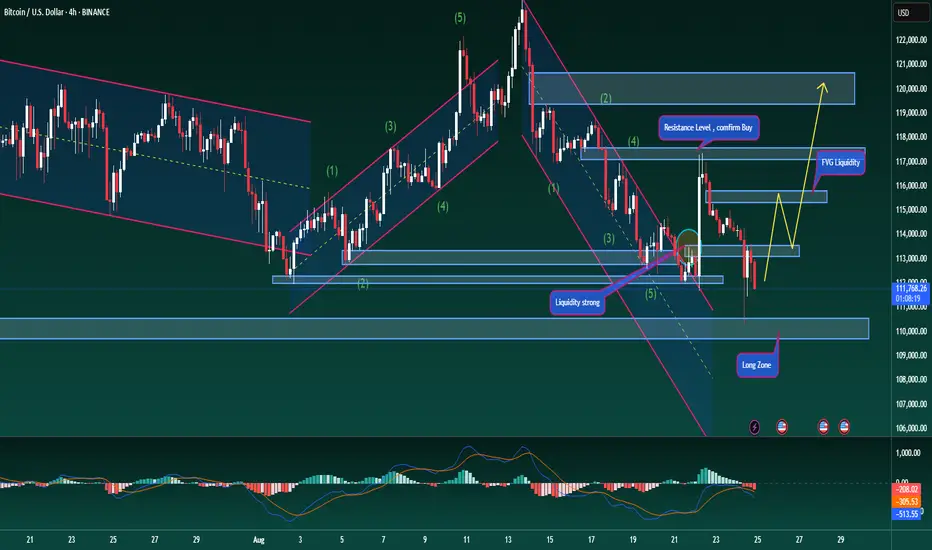
Bitcoin – Trading Plan Update Bitcoin – Trading Plan Update
Hello traders,
The BTC scenario has played out well, with price reacting strongly at 110.4k and bouncing higher. This level has cleared much of the short-side liquidity, while the H4 candle could not close below the 111.8k support. As a result, long entries around 110k can still be expected to target higher levels, at least towards 115.5k.
The primary focus remains on the long side as long as price does not confirm a sustained bearish move. Long positions will remain valid until price breaks decisively below 110k.
For traders who already closed longs or missed the earlier entry, wait for a retest of the FVG zone near 111.5k. If price reacts higher, fresh longs around 113k can be considered.
Short-term selling opportunities may also appear near 115.5k and 117.2k, where price could face resistance.
My BTC strategies are still aligning well with current price action. That said, this is my personal outlook based on my trading method. Please trade responsibly, stick to your own plan, and manage risk carefully.
What’s your view on BTC right now? Share your thoughts in the comments below.
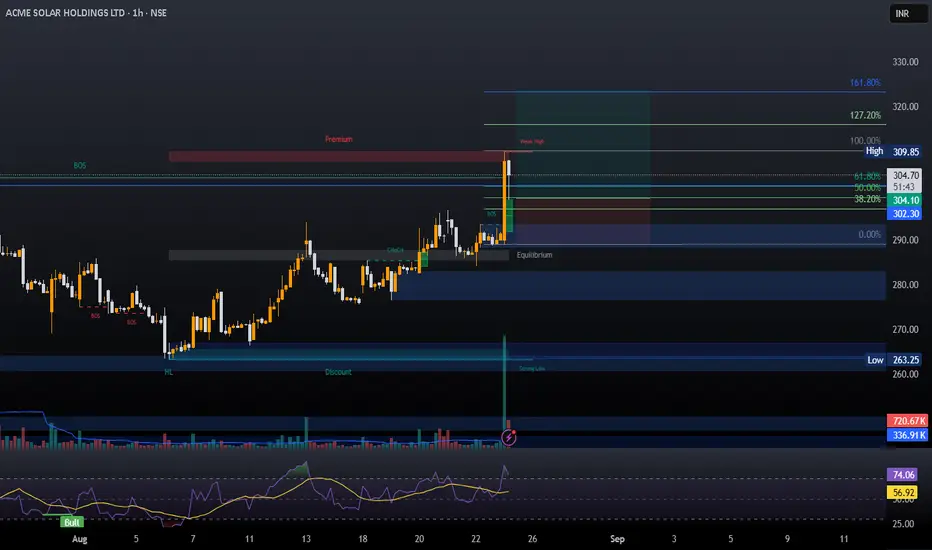
ACME SOLAR IPO BASEEntry- 300-302
Target- 315, 325, 340
Support- 285
Reason- Acme Solar has given a IPO base breakout. One can take a long here with todays low as a SL. It has given a strong closing above its IPO base high. IPO base breakout trade usually has great win ratio. One can also hold it for 25 to 30 percent returns. Keep Check.
Disclaimer- This is just for educational purpose.
Jai Shree Ram.
Zydus is ready to breakout from cup and handle pattern Zydus Lifesciences
✅ Cup & Handle shaping up on weekly.
✅ Price consolidating just under resistance at ₹1005.
🚩 Needs strong breakout candle with volume.
🎯 Target zones: ~₹1060
, ₹1097, ₹1145.
🛑 Stop-loss: ₹984.
Drreddy is forming a diamond pattern Dr. Reddy’s
⚖️ Diamond/symmetrical triangle pattern visible.
✅ EMAs rising on daily, RSI ~60.
🚩 Weekly chart still consolidating → needs close above ₹1280.
🎯 Target zones: ~₹1317
, ₹1359, ₹1400.
🛑 Stop-loss: ₹1255.
Macro tailwinds: weak dollar, lower inflation, stable growth → supportive for emerging markets and defensive/healthcare plays.
