EURUSD: The Rally Was Just a Trap – Bears Are Ready to Strike!After a strong rebound toward the 1.18400 zone driven by short-term optimism, EURUSD is now facing a potential reversal as price stalls within multiple Fair Value Gap zones. The chart reveals weakening bullish momentum, with lower highs forming inside a key resistance area.
Fresh U.S. data: Jobless claims dropped more than expected, giving the USD a solid boost. Meanwhile, the ECB remains hesitant, showing little conviction as Eurozone inflation cools.
A bearish scenario is unfolding: price forms a flag pattern → breaks the ascending channel → targets 1.17300. A break below this level could send EURUSD toward 1.16500 or even lower.
Bulls, beware! This could be a bull trap — and the bears are gearing up for a counterattack.
SELL setup: Look for bearish reversal signals around 1.18300–1.18400. Stop-loss above the high, first target at 1.17300.
Longsetup

XAUUSD: collapse brewingU.S. data keeps hammering gold: Jobless claims dropped sharply, and manufacturing PMI beat expectations — giving the Fed even more reason to keep rates elevated. This weakens gold’s safe-haven appeal.
On the H4 chart, XAUUSD is hovering just above weak support with a clear distribution pattern. Price has been repeatedly rejected near the FVG zone at 3,390 and is trading below the previous high. If it breaks down from this confluence zone, strong selling pressure could drive it down to 3,311 — where the major trendline intersects a previous green FVG zone.
Strategy: Look to SELL if price fails at 3,390 and confirms a breakdown. Target a failed retest and a drop toward 3,311.
One sharp drop could trigger a deeper wave — are you ready?

Sbilife Getting ready for the rally ahead?!!!Chart patterns suggest me the above titled opinion
1. Weekly time frame shows a three white soldiers (month of april 2025) with good volume support....now the consolidation happening
2. In daily time frame, it is travelling in a expanding channel pattern , currently at the support line at the bottom
3. We need a confirmation for the rally with a Breakout candle....which we can expect during the result release.
4.If we make our entry now, we can make our stoploss as daily candle close out of the channel
5. Best entry is to wait for the Breakout and enter with SL below the breakout candle
6.Target levels as mentioned in the chart.
With strong fundamentals and decent valuations, Sbilife is one of the best options for long term bet in the insurance sector!!!
This is just my opinion ....not a tip nor advice..
Thank you!!!!

XAUUSD – Is a Deep Correction Just Around the Corner?Gold just took a brutal hit, plunging over 3,728 pips in a single session — down 1.10%, marking the sharpest drop in weeks.
Why?
Jobless claims dropped → Labor market too strong
Flash Manufacturing PMI beat expectations → U.S. economy remains resilient
The Fed is likely to keep rates higher for longer → USD strengthens → Gold gets dumped hard.
Currently, price is testing the FVG zone and the channel support. If it fails to hold above 3,363, the next target could be 3,344.5 or even lower.
Strategy: Look for SELL opportunities if price fails to reclaim 3,402.4, followed by a potential break of support and deeper drop.

BTCUSDT – Charging Ahead in an Ascending Channel, Eyes on 120K!Bitcoin is gliding steadily within a rising channel, consistently printing higher highs and higher lows. After tagging the 120K psychological zone, price made a healthy pullback to key support and bounced back swiftly — reaffirming buyer dominance.
Price action reveals sustained bullish momentum, especially with key U.S. economic data on the horizon. If risk-on sentiment holds, BTC is well-positioned to break past psychological resistance and unlock the next leg higher.
This pullback? It’s not weakness — it’s a setup. And the market is gearing up for another breakout move.

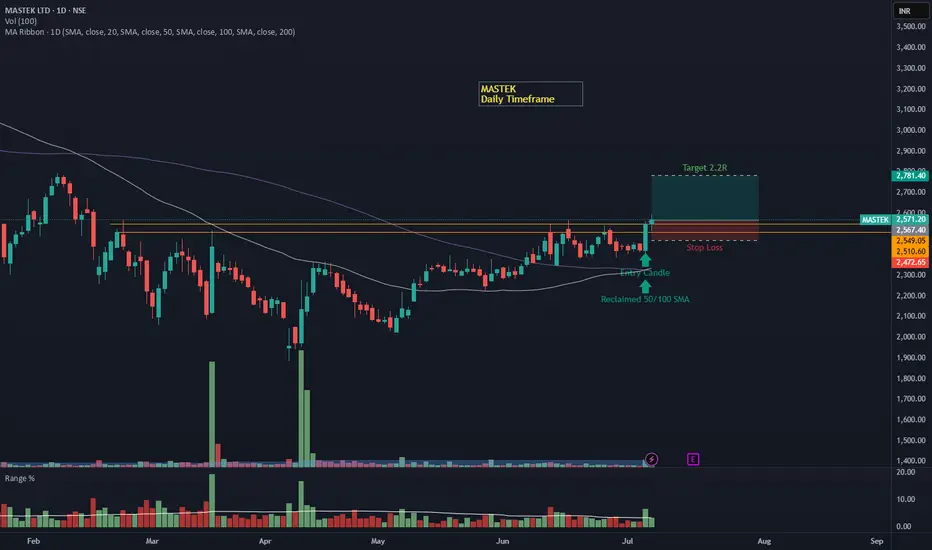
MASTEK – Daily Timeframe Breakout Idea (Resistance Zone Break)MASTEK has broken above a key resistance zone on the daily timeframe, backed by a strong bullish candle and a significant volume surge.
📌 Breakout Context:
The stock consolidated near the ₹2460–2480 zone for several sessions, forming a horizontal resistance zone.
On July 4th, the price broke out with strong bullish momentum, closing above the resistance with a wide-range green candle and a volume spike.
The breakout candle also closed above both 50- and 100-day Simple Moving Averages, confirming a bullish bias.
💡 Trade Setup:
Entry: ₹2550–2570 (near breakout)
Stop Loss: Below the breakout zone at ₹2472
Target: ₹2780+ (2.2R setup)
Risk-Reward: ~1:2.2 (ideal for swing trades)
🎯 Why This Setup Stands Out:
Volume on the breakout day is notably higher than average, confirming institutional interest.
Clean horizontal breakout from a multi-week range.
SMA structure is bullish, with the price reclaiming key MAs.
⚠️ Disclaimer: This post is for educational purposes only and not financial advice. Always consult your financial advisor before making trading decisions.
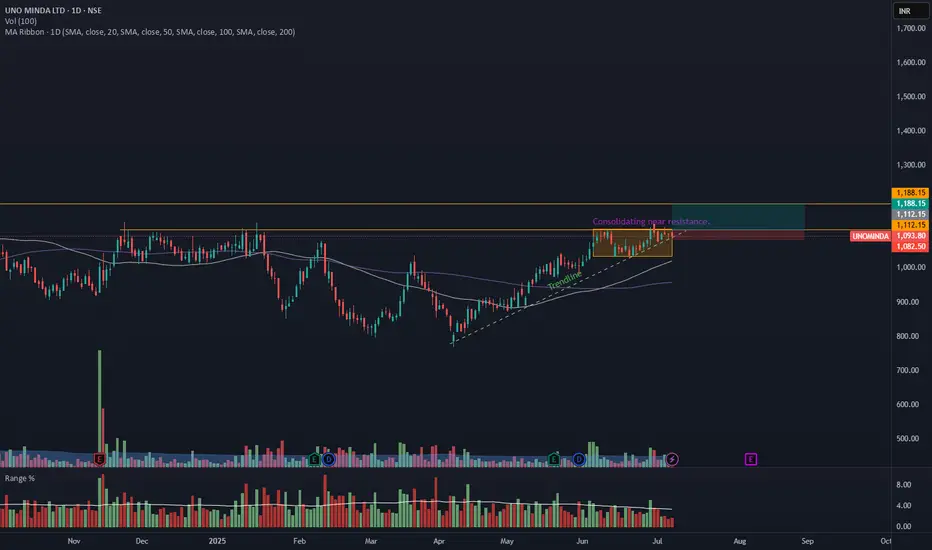
UNOMINDA – Daily Timeframe Breakout Idea (Resistance Zone Break)UNO MINDA LTD. has shown a breakout above a key horizontal resistance level on the daily chart, accompanied by a nearly 1.5 times volume surge near the breakout, as seen earlier, supported by strong momentum.
🔍 Breakout Context:
- Price might break above the ~₹1110 horizontal resistance, which had held for over 6 months.
- Breakout supported by more than average volume and just above average range near the resistance zone.
- The price is also trading above both the 50- and 100-day SMAs, indicating strong trend continuation.
- This aligns with a bullish continuation setup.
📉 Trade Plan:
- CMP: ₹1093
- Entry: Near ₹1112
- Target: ₹1188 (~7% upside from CMP)
- Stop-Loss: ₹1082
- Risk-Reward Ratio: ~1 : 2.0
📌 Note:
- Look for a confirmation candle to enter the trade.
- Avoid chasing the extended move unless confident in intraday momentum.
⚠️ Disclaimer: This post is for educational purposes only and not financial advice. Always do your research or consult a financial advisor before trading.
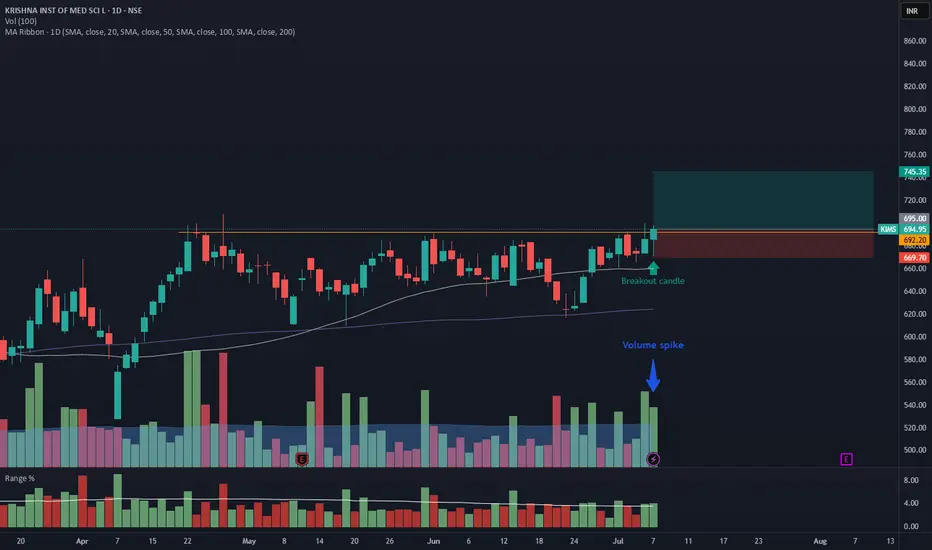
KIMS – Daily Timeframe Breakout Idea (Resistance Zone Break)
KRISHNA INSTITUTE OF MEDICAL SCIENCE has shown a breakout above a key horizontal resistance on the daily chart, accompanied by a ~2x volume surge, supported by strong momentum.
🔍 Breakout Context:
- Price broke above the ~692.20 horizontal resistance, which had held for over 2 months.
- Breakout supported by <2x average volume and just above average range on the breakout candle.
- The price is also trading above both the 50- and 100-day SMAs, indicating strong trend continuation.
- This aligns with a bullish continuation setup.
📉 Trade Plan:
- CMP: ₹694
- Entry: Near ₹695
- Target: ₹746 (~7.25% upside from CMP)
- Stop-Loss: ₹669
- Risk-Reward Ratio: ~1 : 2.0
📌 Note:
- Avoid chasing the extended move unless confident in intraday momentum.
⚠️ Disclaimer: This post is for educational purposes only and not financial advice. Always do your research or consult a financial advisor before trading.
BAJFINANCE looks bullish for swing and long-termMajor trend is clearly up - this has been a long-term outperformer. After a sharp rally, BAJFINANCE entered a corrective phase, but something interesting unfolded:
- The price respected the higher timeframe structure and did not make a lower low, indicating strength.
- A demand zone has now been established, from where price is showing signs of reversal.
- We’ve also seen a break above key lower highs, suggesting a shift in structure back to bullish.
- The consolidation and breakout pattern in the highlighted zone reflects a typical bullish continuation setup after a healthy correction.
This could very well be the early stage of a powerful bullish leg, and is good for both swing trades and long-term positioning.

XAUUSD – When Buying Pressure FadesGold attempted to break above a key resistance zone but quickly lost momentum, signaling that bullish strength is weakening. Meanwhile, strong U.S. economic data continues to support the dollar: the labor market remains robust and manufacturing activity is expanding — giving the Fed more reason to keep interest rates high for longer. This has put downward pressure on gold.
Currently, the market is approaching a critical support area. If this zone breaks, the bearish trend could accelerate further. Price structure no longer shows clear bullish momentum, and any pullbacks appear to be merely technical corrections.
Given this outlook, I favor a SELL setup if price breaks below support. The downside could expand significantly if buyers fail to return. Gold is now standing on the edge — either it holds the range, or a sharp drop may follow.

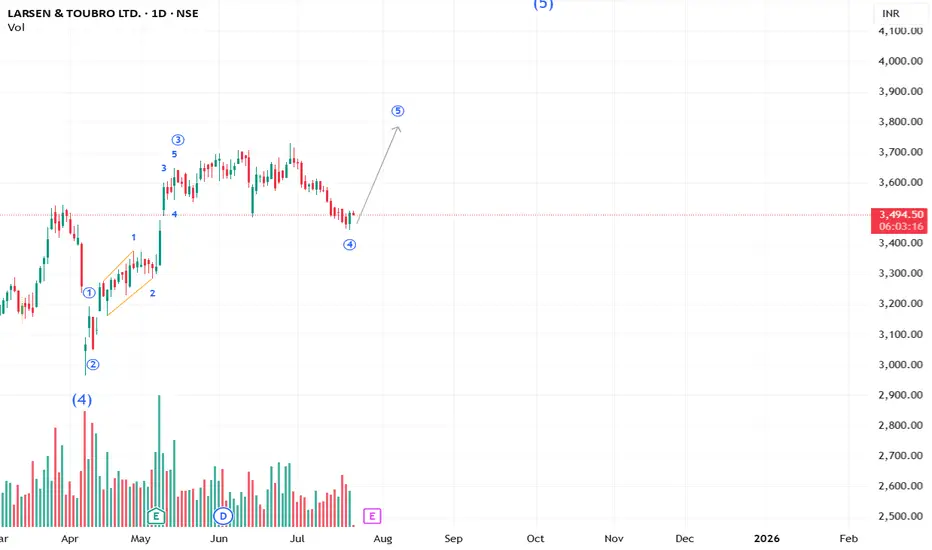
The last move on the way in LT? #LT We may see an upside in LT to finish the last wave 5 to go above 3732. Don't risk more than 2% of your capital on any trade.
**This analysis is based on the Elliott Wave Principle.
This analysis is for educational purposes only and not investment advice.
Please consult your SEBI-registered advisor before making any investment decisions. Markets are subject to risk.**
XAUUSD – The bullish surge isn't over yetGold just delivered an impressive breakout of nearly 500 pips on July 21, fueled by a weakening USD as U.S. housing and manufacturing data showed signs of slowing down. With a bleaker economic outlook and growing expectations that the Fed may cut interest rates in Q4/2025, investors are flocking back to safe-haven assets – and gold is shining bright.
Technically, XAUUSD remains firmly within a clearly defined ascending channel, with price action bouncing sharply off dynamic support. The metal is currently consolidating around the 3,400 zone – if buyers can hold this ground, the door toward 3,440 and beyond could swing wide open.
As long as gold holds above 3,347, bulls remain in full control. This might just be a healthy pullback before the next leg up – don’t miss out as the market gains momentum!

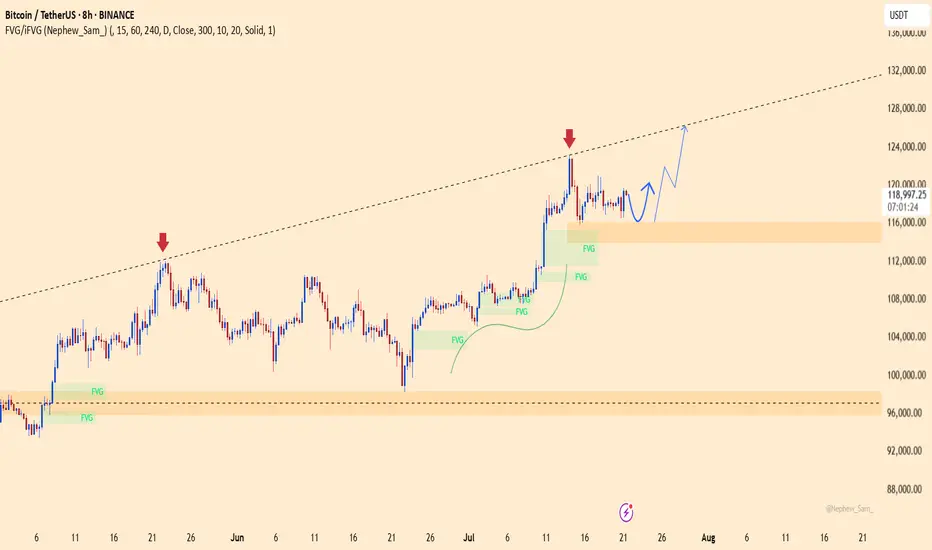
BTCUSDT – Rebounding from Fair Value Zone! Is the Bull Run Back?Bitcoin is building a strong base around the FVG support zone after rejecting the resistance trendline twice in a row. The current price structure is a textbook bullish setup: pullback – retest of liquidity zone – accumulation – and now prepping for a strong breakout.
Fair Value Gaps have been consistently filled and are acting as dynamic support, signaling that buyers are still in full control. RSI remains steady and not overheated – creating perfect conditions for a breakout.
Target: The 125,910 USDT area is the next clear price objective if BTC holds above the 116,082 USDT support zone.
Fundamental Catalyst: The crypto market is regaining strength after BlackRock officially confirmed its plan to expand its crypto ETF products – investor sentiment is back on the bullish side.
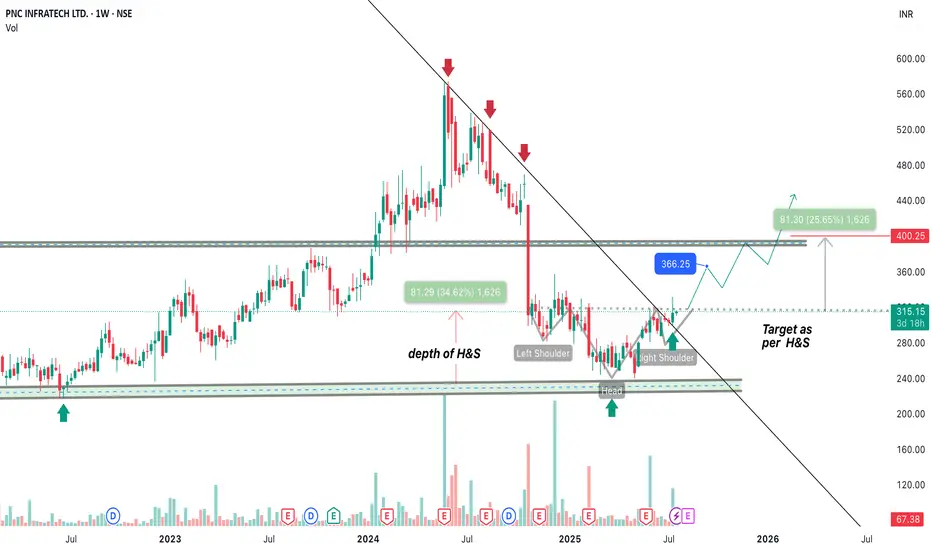
PNCINFRA INVERTED HEAD & SHOULDER - LONGThe stock has given a very good breakout of 1 year long TL. moreover it has formed INVERTED H&S pattern which gives us an upside target of 400.
moreover it has completed its long time fibonacci retracement of 61.8% which gives us another point of its future bullish momentum.
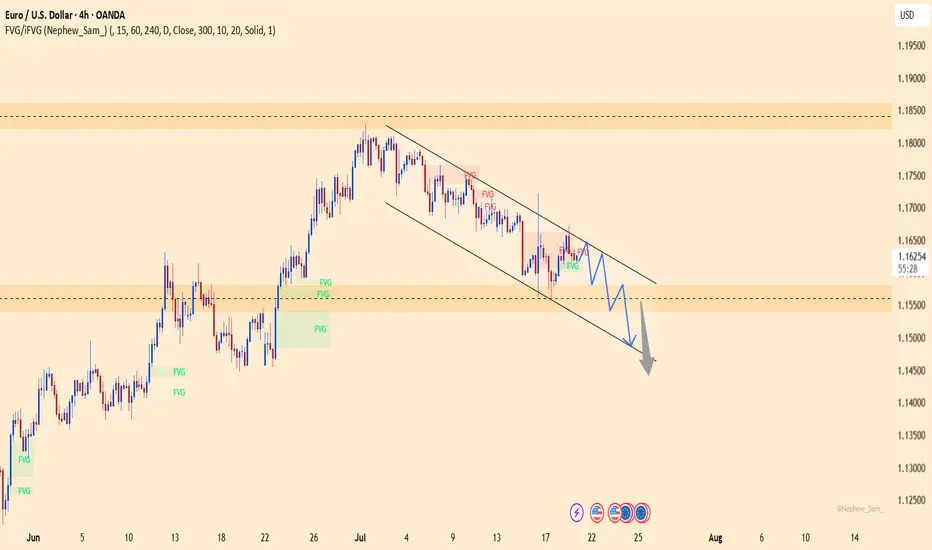
EURUSD – Trend broken, bearish momentum accelerating!EURUSD is maintaining a clear downtrend structure within a well-defined descending channel, with consistently lower highs forming. Fair Value Gaps (FVGs) keep getting rejected, signaling that sellers are firmly in control. The current scenario points to a technical bounce toward the 1.164 zone, followed by a likely rejection back down to the lower boundary near 1.148.
Technical signals confirm the bearish bias as price respects both the trendline and the supply zones, failing to break above recent resistance levels.
On the fundamental side, the ECB has recently struck a more dovish tone due to cooling inflation, while the USD is regaining strength amid expectations that the Fed will keep rates elevated longer — all of which continue to pressure the euro lower.
XAUUSD – Breakout or Continued Accumulation?Gold continues to respect a solid bullish structure within an ascending price channel. After a healthy pullback from recent highs, the price has retested a key technical support area and is showing signs of a strong rebound.
Current price action reveals that the market is respecting both the FVG zone and the rising support line—clear signals that smart money is still leaning toward the buy side. The next bullish targets lie around the upper resistance zone.
From a macro perspective, weaker-than-expected U.S. retail sales have placed downward pressure on the dollar, fueling speculation that the Fed may soon pivot toward easing. This adds momentum to gold’s upside potential.

EURUSD on the verge – a trap waiting for the carelessThis pair has just completed a classic rounding top, with a sharp rejection near 1.16500. Buying momentum is fading, RSI is dropping, and the recent retest of the broken trendline might have been the final warning – the “kiss of death” could already be in play.
On the fundamental side, the U.S. keeps fueling the dollar: consumer spending is rising, jobless claims are falling, and the Fed shows no sign of easing up. Meanwhile, the ECB is still searching for direction, leaving the euro exposed and vulnerable.
If the current support level breaks, EURUSD could slide quickly to lower zones. This is no longer a time for hope – it’s time to choose a side and act.

XAUUSD: breakout risk is approachingXAUUSD has been consolidating in a tight range since early July. Despite multiple bounces from support, price has failed to deliver a clear breakout, signaling weakening buying pressure. The current structure leans bearish, with momentum turning increasingly negative.
On the news front, the U.S. economy continues to show strong recovery: rising consumer demand, falling unemployment, and surging USD and bond yields. This puts significant pressure on gold – a non-yielding asset in a high-interest environment.
If price breaks below the bottom of the range, the downside could accelerate sharply in the near term. Buyers should remain extremely cautious in this setup.

EURUSD under pressureEURUSD is moving within a well-defined descending channel, forming consistent lower highs and lower lows. The price has recently rejected the resistance zone near 1.16100, showing signs of continued bearish momentum.
On the fundamental side, stronger-than-expected U.S. retail sales—especially in the core figure—have boosted the U.S. dollar, putting downward pressure on the euro. Coupled with ongoing concerns about Eurozone economic growth, the pair is likely to continue its decline toward the 1.15400 support area. RSI remains below the neutral zone, confirming short-term bearish bias.
Traders should watch closely for reactions at support to assess further short opportunities.

Gold wavers under pressure from strong U.S. retail dataXAUUSD is currently fluctuating within a price box, showing weaker bullish attempts and failing to break above the nearest resistance zone. Selling pressure is mounting as price continues to be rejected at the top and is approaching the medium-term ascending trendline — a key support level.
On the news front, U.S. core retail sales surged, boosting expectations for a stronger USD, which in turn weighs on gold prices. However, a slight uptick in unemployment claims may help slow the dollar’s momentum.
If buyers fail to defend this critical support, the bullish structure risks being broken, potentially signaling a shift toward a clearer downtrend. On the flip side, the price box could still act as a consolidation phase before another bullish leg.

XAUUSD – The Bullish Wave Emerges, Target Closer Than Ever!Gold has broken out of its previous descending channel, confirming a trend reversal. Current price action is forming higher lows while consistently filling Fair Value Gaps (FVGs) – a clear sign that institutional money is flowing back in.
The next key target is the previous high near 3,399, where some short-term profit-taking may occur. However, if buyers can defend the support zone around 3,348, the chances of breaking above resistance will increase significantly.
On the news front, the U.S. dollar is weakening as housing and industrial production data show signs of slowing, fueling speculation that the Fed may pause further rate hikes this year.

Powergrid - 10% Upmove possible?!!!Chart patterns suggest me the above titled opinion
1. Monthly chart shows a Mother baby candle (feb and march 2025)
2. Weekly chart too shows a good inside bar candle with good volume support and Breakout visible (shown below)
3. In daily time frame, there is an expanding channel pattern... . Higher high formed indicates a bulls edge .
4.Let's wait for the Breakout and enter the trade
5.Target levels mentioned @ chart.
This is just my opinion...not a tip nor advice...
Thank you!!!!

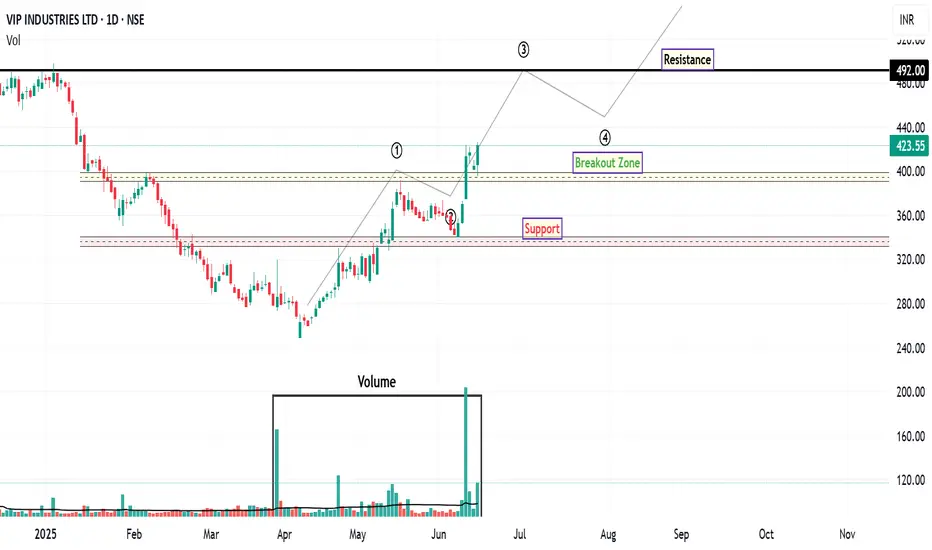
VIPIND: Unlocking Potential After Downtrend
VIP Industries has demonstrated robust bullish momentum over the past few trading sessions, signaling a notable shift in market sentiment. This upward trajectory is particularly significant given the stock's prolonged downtrend since October 2024.
From an Elliott Wave perspective, the recent price action suggests the potential completion of a corrective phase. The retracement from what appears to be Wave 1 to Wave 2 aligns closely with the 61.8% Fibonacci retracement level, which often precedes the initiation of a strong Wave 3 impulse. This potential wave structure, if confirmed, could indicate further upside potential.
A key development supporting this bullish outlook is the stock's recent decisive close above its 200-day EMA, accompanied by a significant surge in trading volume. This confluence of price action and volume confirms strong buying interest and suggests a potential long-term trend reversal. The increased volume further validates the strength of the breakout, indicating broader market participation.
While the immediate outlook appears constructive, traders should be mindful of potential profit-taking around the ₹446 level. This area may present a temporary resistance zone where some short-term corrections or consolidation could occur. However, should the stock successfully navigate this level, the next significant upside resistance target to monitor is ₹492 . This level aligns with prior price highs and could represent a more substantial challenge for further upward movement.
For risk management purposes, a prudent approach would involve considering a stop-loss order positioned below the identified support zone, as depicted on the chart. This strategy aims to mitigate potential downside risk in the event of an unexpected reversal in market sentiment.
Disclaimer: The information provided in this technical analysis is for informational and educational purposes only and should not be construed as financial advice. It is based on observations from the provided chart and commonly used technical indicators. Market conditions can change rapidly, and past performance is not indicative of future results. Always conduct your own comprehensive due diligence and consult with a qualified financial advisor before making any investment decisions.