GLENMARK PHARMA LONG SETUP FORMATIONKeep eye on Glenmark Pharma closing above 1845 than make long position with small stoploss and wait for the reward. No guaranteed return assured. Do your analysis from your side than made an entry.
Longsignal

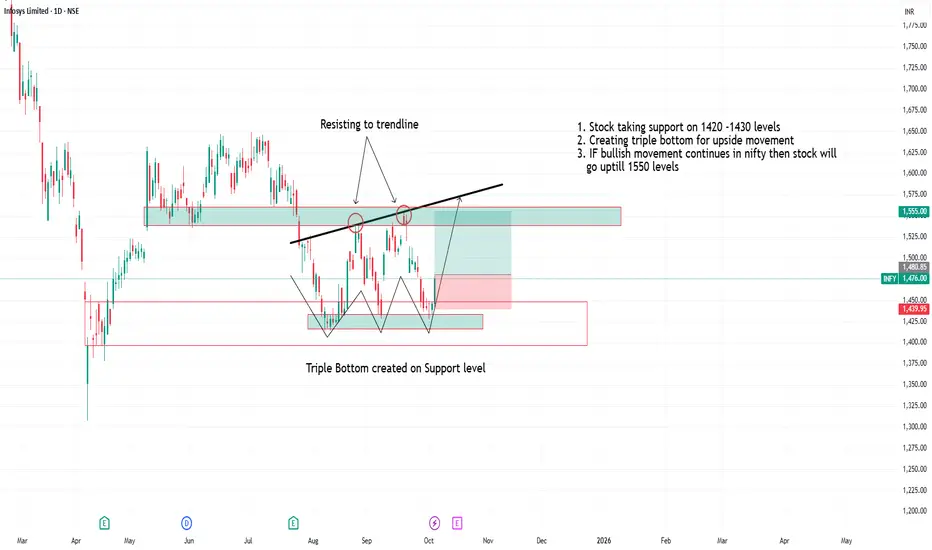
Infosys creating triple bottom on 1420-1430 level1. Stock taking support on 1420 -1430 levels
2. Creating triple bottom for upside movement
3. IF bullish movement continues in nifty then stock will
go uptill 1550 levels
GMR Airports Ltd – Bullish Bounce from Support ZoneThe chart of GMR Airports Ltd (Daily timeframe) is showcasing a well-respected ascending channel pattern, where price is currently bouncing off the lower support trendline, indicating a continuation of the bullish structure. This setup provides a compelling long opportunity if confirmed with price action.
• Uptrend Channel Structure Remains Intact
GMR Airports has been moving within a clearly defined uptrend channel with multiple touches at both resistance and support zones. The current bounce is happening near the support line, which has previously acted as a strong reversal point — suggesting that buyers are stepping in again.
• Twizzer Bottom Candlestick at Support
A key bullish candlestick pattern, the Twizzer Bottom, has formed right at the trendline support. This candlestick combo is known for reversal potential, especially at critical zones like this. The confluence of support + reversal pattern adds strong conviction to the bullish setup.
• EMA Support Alignment
The price also aligns closely with the 50-day EMA (blue line) and is above the 200-day EMA (red line) — a typical bullish sign in trend-following strategies. This alignment reinforces the uptrend bias and increases the odds of an upside continuation.
• Upside Targets Clearly Marked
- The initial target is placed at ₹93+, which corresponds to the last swing high.
- Target 2 is marked at ₹97+, aligning with the 52-week high.
- If price breaks through the upper resistance channel with momentum, the final target may extend higher, potentially entering price discovery mode.
• Risk Management is Well Defined
- The stop-loss is marked below ₹85, just under the previous swing low and trendline support.
- A close below this level will indicate a long setup failure, and the structure will need re-evaluation.
- This gives a favorable risk-reward ratio for swing traders entering at current levels.
• Conclusion – Watch for Momentum Confirmation
If follow-through buying occurs in the coming sessions, this could lead to a sharp upward move back toward the upper channel resistance. Traders should wait for volume expansion and strong candle closure above ₹88 for further confirmation. The overall bias remains bullish until the lower channel is broken convincingly.

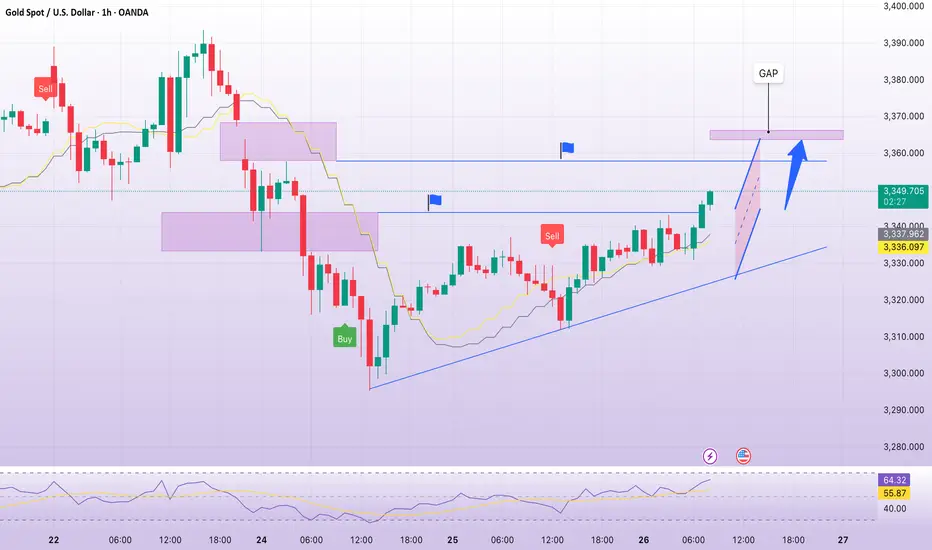
maintain uptrend, buy gold 3350Plan XAU day: 04 August 2025
Related Information:!!!
Gold prices (XAU/USD) retain a subdued tone during the first half of the European session on Monday, although the absence of sustained selling pressure keeps the metal within reach of the one-week high recorded earlier in the day. The US Dollar (USD) begins the new week with a modest recovery, partially retracing Friday’s decline triggered by softer-than-expected US employment data, supported in part by a rebound in US Treasury yields. This recovery exerts downward pressure on demand for the precious metal.
Nevertheless, the USD's upside remains limited amid increasing expectations that the Federal Reserve (Fed) will resume interest rate cuts as early as September. This anticipation continues to provide support for the non-yielding yellow metal. In addition, a broadly cautious market mood—driven by persistent trade uncertainties and heightened geopolitical tensions—reinforces the appeal of Gold as a safe-haven asset and advises restraint among bearish market participants
personal opinion:!!!
Accumulated price zone around 3350 - 3364, buying power maintained. Gold buying point following the uptrend line today
Important price zone to consider : !!!
Support zone point: 3350 zone
Sustainable trading to beat the market

Gold price stabilizes above 3300Plan XAU day: 10 July 2025
Related Information:!!!
Gold prices (XAU/USD) have pared a portion of their modest intraday gains but continue to maintain a positive bias for the second consecutive day, trading around the $3,320 level during the early European session on Thursday. Ongoing uncertainties surrounding US President Donald Trump’s trade policies and their potential implications for the global economy are keeping investors cautious. In addition, expectations that the Federal Reserve (Fed) will lower interest rates later this year continue to lend support to the non-yielding precious metal.
Meanwhile, the minutes from the Federal Open Market Committee (FOMC) meeting released on Wednesday indicated limited support for a potential rate cut as early as this month. This has provided a boost to the US Dollar (USD), which—alongside a broadly positive tone in equity markets—is capping the upside potential for gold as a safe-haven asset. As such, it would be prudent to await confirmation through sustained buying interest before anticipating further gains, as market participants turn their attention to upcoming US Weekly Jobless Claims data and speeches from Federal Reserve officials for near-term trading cues
personal opinion:!!!
Market accumulates, sideways above 3300 waiting for US unemployment news today
Important price zone to consider : !!!
support zone point: 3307 zone
Sustainable trading to beat the market

Gold price recovered break 3340, price increasedPlan XAU day: 02 July 2025
Related Information:!!!
Gold Demand in China Expected to Rise Further
"Gold prices (XAU/USD) fluctuated between modest gains and slight losses during the first half of the European session on Wednesday, remaining below the one-week high reached the previous day. The US Dollar has regained some positive momentum, appearing to break a seven-day losing streak that had brought it to its lowest level since February 2022. This renewed strength in the greenback is acting as a headwind for the precious metal. Additionally, a broadly positive risk sentiment in the market is seen as another factor limiting the upside potential for the safe-haven asset.
personal opinion:!!!
Gold price continues to recover after breaking the 3340 price zone, buying power maintained before ADP-NF news today
Important price zone to consider : !!!
SELL point: 3366 zone
Sustainable trading to beat the market

Policy instability, DXY falls sharply, gold recoversPlan XAU day: 01 July 2025
Related Information:!!!
Gold Demand in China Expected to Rise Further
"In the first quarter of the year, China recorded a net export of 36 tons of gold to Hong Kong, reflecting a growing domestic demand for gold despite elevated prices. The uncertainty surrounding U.S. tariff policy has likely been a significant contributing factor. As a result, gold has seen increased appeal among Chinese investors as both an investment asset and a safe-haven store of value. In contrast, demand for gold jewellery likely remained subdued due to persistently high prices."
"China aims to expand its exploitable gold reserves by 5 to 10 percent by 2027, potentially in response to rising domestic demand, according to a statement from the Ministry of Industry and Information Technology released early last week. The country also plans to boost gold production by more than 5 percent over the next two years. While China is already the world’s largest gold producer, it continues to rely on imports to satisfy internal demand.
personal opinion:!!!
Trump administration's policy instability caused the dollar to lose value and gold to fall sharply. Gold is on the way to recovery, returning to the price range of 3366.
Important price zone to consider : !!!
SELL point: 3366 zone
Sustainable trading to beat the market

Bears up 3366 , waiting for GDP ! XAUUSDPlan XAU day: 26 June 2025
Related Information:!!!
Gold price (XAU/USD) attracts some buyers for the second consecutive day on Thursday and maintains its positive momentum during the first half of the European session. The US Dollar (USD) continues to face strong selling pressure amid reports that US President Donald Trump is considering replacing Federal Reserve (Fed) Chair Jerome Powell, raising concerns about the central bank’s future independence. Additionally, growing expectations that the Fed may resume its rate-cutting cycle as early as July have pushed the USD to a more than three-year low, which supports demand for the non-yielding yellow metal.
personal opinion:!!!
European session buying pressure helped gold price successfully break 3340, continuing the upward trend 3366
Important price zone to consider : !!!
SELL point: 3367 zone
Sustainable trading to beat the market
Gold price short growth: price zone 3345Plan XAU day: 25 June 2025
Related Information:!!!
US President Donald Trump criticized both Israel and Iran for violating a full ceasefire agreement shortly after it was announced. Moreover, media reports indicated that the recent US airstrikes on Iran’s nuclear facilities likely did not destroy the core components but only delayed Tehran’s program by a few months. Trump, however, reiterated that Iran’s nuclear sites were completely destroyed.
Nonetheless, the ceasefire between Israel and Iran appears to be holding for now, with both sides declaring victory in the conflict and warning that they are prepared to resume hostilities if attacked. This keeps the geopolitical risk premium in play and is likely to continue supporting the safe-haven appeal of Gold ahead of key US macroeconomic data releases later in the week.
personal opinion:!!!
Accumulation price zone: 3300 - 3335 is being maintained in the Asian and European sessions. Pay attention to selling pressure in the liquidity zone 3345.
Important price zone to consider : !!!
SELL point: 3345; 3367 zone
Sustainable trading to beat the market

Fibonacci extension, sell gold 3375Plan XAU day: 23 June 2025
Related Information:!!!
Gold price (XAU/USD) maintains its bearish tone during the first half of the European session, although it lacks strong momentum due to mixed fundamental signals. The US attack on Iran’s nuclear facilities on Sunday increases the risk of a wider conflict in the Middle East and reinforces the US Dollar's (USD) position as the global reserve currency. In addition, the Federal Reserve’s (Fed) hawkish stance is seen as another factor supporting the greenback and putting downward pressure on the non-yielding yellow metal.
personal opinion:!!!
Gold price recovered and continued to accumulate, using extended fibonacci to find selling points to adjust wave 4 on H1 frame
Important price zone to consider : !!!
SELL point: 3375 zone
Sustainable trading to beat the market

Accumulate and then hit 3500 soonPlan XAU next week: 16 June - 20 June 2025
Related Information:
Recently, US President Trump told Axios that Israel’s attack could help him reach an agreement with Iran. He urged Iran to make a deal, adding, 'There has already been great death and destruction, but there is still time to bring this slaughter to an end, with the next planned attacks expected to be even more brutal.'
The University of Michigan (UoM) Consumer Sentiment report for June showed that households are becoming more optimistic about the economy. The Sentiment Index increased from 52.2 to 60.5, while inflation expectations declined for both the one-year and five-year outlooks—from 6.6% to 5.1%, and from 4.2% to 4.1%, respectively.
personal opinion:
Gold prices will tend to accumulate at the beginning of the week around 3400, news of Middle East tensions will push gold prices back to 3500 by the middle of next week.
Important price zone to consider :
sell point: 3500, 3536
buy point: 3410, 3376
Sustainable trading to beat the market

BUY VEDANTA LTDBUY signal for VEDANTA, as it has broken the trendline also moving average cross cover signaling a strong buy for VEDANTA.

BUY LONG AUDUSDLong position of AUDUSD as its at important support level touching the trendline where market has previously rejected and also having multiple wicks rejection making a strong support near trendline. Giving a buy/long opportunity on AUDUSD

BUY LONG GBPUSDLong position of GBPUSD as its at important support level and there is a rsi divergence and there is low volume in market near this support level also market has previous rejected this level and Fibonacci golden level and now market has again reached this level meaning a reversal in GBPUSD.

GODREJPROP // Levels // 1hFor Godrej Properties (GODREJPROP) on the 1-hour timeframe, here are the key support and resistance levels:
Support Levels:
First Support (S1): Around ₹1,450
Second Support (S2): Around ₹1,440
Resistance Levels:
First Resistance (R1): Around ₹1,470
Second Resistance (R2): Around ₹1,480

Natco Pharma Ltd: - A Prescription for Profits!Natco Pharma Ltd: From Cup to Breakout - A Prescription for Profits!
Technical Analysis:
Cup and Handle Formation: Natco just completed a textbook cup and handle pattern. It's like the stock was preparing a perfect cup of bullish tea, complete with a handle for easy holding!
Breakout: Hold onto your stethoscopes! Natco has broken out above resistance with more energy than a kid on a sugar rush.
Trend: The uptrend is so strong, it could probably cure the common cold (disclaimer: it can't, but wouldn't that be nice?).
Volume: Rising volume confirms the breakout. Traders are piling in faster than hypochondriacs at a pharmacy during flu season.
Support: Previous resistance at 959.80 now likely to act as support. It's like the floor and ceiling just played musical chairs!
Fundamental Factors:
Pharmaceutical sector seeing increased interest. Natco's producing more buzz than a beehive near a coffee plantation.
Potential new drug approvals or pipeline developments could be fueling this healthy rally.
Risks:
After such a strong move, a pullback is possible. Even the best medicines have their side effects!
Keep an eye on broader market sentiment and sector-specific news.
Trade Idea:
Consider long positions with a stop loss below the breakout level. Target the psychological 1,500 level - let's see if Natco can join the 1.5K club!
Remember, traders, timing in the market is like timing your antibiotic doses - crucial for the best results!
Key Levels to Watch:
New support (old resistance): 959.80
Next psychological resistance: 1,500.00
Stop loss consideration: Below 1,150.00
Disclaimer: This analysis is for educational purposes only. Always do your own research and manage your risk. Remember, the stock market, like the pharmaceutical industry, requires careful study and a strong stomach for volatility!

Stock Market Analysis Report: Cochin Shipyard Limited All aboard the Cochin Shipyard Limited stock, because this ship is ready to sail to new heights! 🚢💹 We’ve spotted some thrilling price action and technical patterns that promise a profitable voyage. Let’s dive into the details.
Price Action Overview
Chart Analysis
Current Price: ₹2,679.95
Daily High: ₹2,679.95
Daily Low: ₹2,405.05
Volume: 13.027M
Key Technical Indicators
Breakout Point Entry: The chart shows a breakout above the previous resistance level, signaling a strong upward trend.
Volume Spike: There is a notable increase in volume, confirming the breakout and indicating strong market interest.
Detailed Analysis
Breakout Point Entry
Formation: The stock has been steadily climbing, breaking through key resistance levels marked as A, B, and C. The latest breakout point entry is a clear indicator of bullish momentum.
Significance: This breakout suggests that the stock has the potential to continue its upward trajectory, as it has overcome significant resistance.
Volume Spike
Volume Increase: The recent volume spike is significant, as it demonstrates heightened trading activity and investor interest. This adds credibility to the breakout and suggests sustained momentum.
Implications: High volume during a breakout typically indicates that the new price levels are supported by strong buying pressure, reducing the likelihood of a false breakout.
Price Targets and Support Levels
Immediate Resistance: ₹2,800.00 - This is the next level to watch for potential profit-taking.
Support Levels:
Primary Support: ₹2,438.25 - This level should act as a strong support if the price retraces.
Secondary Support: ₹2,200.00 - A more conservative support level that aligns with previous
consolidation areas.
Why did the shipyard stock bring a life jacket to the market? Because it’s ready to float above the rest! 🛟📈
Conclusion
Cochin Shipyard Limited is exhibiting a strong bullish trend with a confirmed breakout and significant volume spike. Keep an eye on the resistance level at ₹2,800.00 and monitor the volume to ensure the breakout sustains. Happy trading, and may your investments be as sturdy as a ship's hull! 🌊⚓
Disclaimer
This analysis is based on historical data and chart patterns. Always do your own research and consider your risk tolerance before making any investment decisions

DMART - Is 20% upside from current levels probable?Hi Traders,
This morning my screener filtered 'DMart' among few other stocks. When I looked at it on the weekly charts I found some key info that might be pointing that this stock will likely be heading up.
10 Weeks Volume Analysis
Up volume is over 6 times down volume (more buying than selling)
8 weeks closing Green and only 2 weeks closing Red
Buying Trades Value Rs.9000Cr. Selling Trades Value under Rs.1500Cr. (Less investors are selling at current prices.)
PA operating above 3 months range.
Observation
Usually when a stock's data shows such information most of which is positive, then it is very likely to be heading up. My set up shows it can attempt 5600 level which would be 20% from current level.
While I am documenting this information for my own personal reference and study, I am indeed taking a position in this stock based on the above reasoning.
TradingView strongly recommends that you do your own research when it comes to investing. That is my advice too because you and you alone are responsible for your actions in the Market and in life.
I would be happy to hear any views on this stock or any other and you can feel free to reach me.
All the best
PriceCatch

Dr Reddy is Ready for Big rally The Doctor is Ready ( Dr Reddy )
Based on Monthly chart with the Parabolic Upside trend ( Purely based on my New STUDY ) ,
Dr Reddy is Ready for the rally.
Tgt 1 : 8412 - 8568±
Tgt 2 : 8823±
Tgt 3 : 9825 - 9952±.
Shared it for EDUCATIONAL/ REFERENCE PURPOSE ONLY.
IT'S NOT A BUY OR SELL RECOMMENDATION.
DO YOUR ANALYSIS FROM YOUR SIDE ALSO.
Don't get biased by my view. I may be wrong too 🙏

EICHERMOT: Bullish Momentum Indicates Potential Rally AheadEICHERMOT, as of now, exhibits a promising trend with its stock trading within a rising channel pattern. Targeting the first milestone near the all-time high resistance of 4200. If the stock maintains its position above this resistance level, there is a possibility of witnessing a more substantial rally in the future. Investors may find this development intriguing and could keep a close eye on the stock's performance.

Ashok Leyland: Bullish Momentum SignalsAshok Leyland, based on the analysis using the Stock Navigator by FnOGyan Indicator, presents a compelling long signal on the daily time frame. The indicator suggests a positive outlook, supported by strong volume building up. The stock has demonstrated resilience by repeatedly finding support near the trendline support area, indicating a robust underlying trend.
Chart patterns, such as the rectangle or flag pole, further contribute to the bullish sentiment. The formation of these patterns often implies a potential continuation of the current uptrend.
Investors are advised to keep a close eye on the stock as it approaches the all-time high resistance level. Sustaining above this resistance could trigger a more significant rally, offering potential opportunities for traders. However, it's essential to monitor the market closely and consider other factors before making any investment decisions.

ICICI PRUDENTIALStock P/E: 87.4
ROCE: 10%
Company has been maintaining a healthy dividend payout of 17.0%
Rs. 244 Cr Net Profit during last quarter.
Symmetrical Triangle Patterns are awaiting on Daily and Weekly time frame.
Entry: 554
Targets: 584, 615, 645, 676 ++
SL: 522 DCB
Remark: Short Term
Disclaimer: Strictly for educational and learning purpose.

CHOLAFINCholamandalam Investment and Finance Company Limited (CHOLAFIN) is engaged in providing vehicle finance, home loans, and loans against property. The analysis below combines technical indicators and fundamental aspects to provide a comprehensive view.
Shareholding Pattern:
Total Shareholders: 1,46,815
Promoters: 51.43%
FIIs: 21.51%
DIIs: 20.04%
Public: 7.03%
The company has demonstrated a robust profit growth of 23.8% CAGR over the last 5 years. Net Profit: ₹2,665 crore.
Considering the positive profit growth, anticipated good quarter, and potential technical indicators, there is a long signal for CHOLAFIN.
Entry: 1183, Targets: 1280, 1377, 1474, 1571 ++ SL: 1085 DCB
Disclaimer: Strictly for Educational and Learning purpose only.
