put it as a long term trade deep falling will apear
put it as a long term trade deep falling will apear
wait and watchh
take profit at 3x for longterm
Longterm

Cup n Handle Pattern Lovable Weekly Chart : Cup and Handle Pattern formation,
CMP 158.85
Target : 399.15
SL : 110
Risk is yours and Reward is too yours totally.
Reward : Risk Ratio = 6.17 : 1,
Time Frame : 1 to 3 years.
View is educational purpose only.

Nifty PredictionA small pullback is expected from the current price and the level around 20,000 will serve as a pivotal support during this pullback phase. This corrective movement is projected to extend until May, coinciding with the declaration of the Lok Sabha election results. The outcome of these elections may potentially act as a catalyst, triggering a breakout and heralding the inception of a promising new bull market.

Wipro New run is startingWipro is at cloud support on monthly charts & this could be taken as a great support for a big move. Can keel stop loss near 388 levels for target of 470 -540 & further new highs in long term.

POLYCAB laga dala life jhingalalaTrade Wisely. We Can Just Predict.
Disclaimer: I am not a SEBI registered advisor , so before entering on my view please ask your SEBI Registered Advisor . Profit is your and loss is your.
If you love my analysis Like And Share wherever you want..

AXISBANK Break trendline and bullishIn 1 day time frame trendline breakout was done and not at 1136.95 with a good volume.
For now volume support zone 1119.15.
If price break 1151 with good volume then a big move we can see here. Be alert.
support zone 1119.15-1109
Support 2: 1081
if price consolidate between 1109-1136 it's for intraday .
after break 1151 it's a good for long for investor.

JSW Energy : right time for investment;Fundamentally good stock.
don't be aggressive to enter.
.
entry: 300
target: 325 / 375/ 395 / 410
stoploss: 280 / 250
.
.
right time for Long term INVESTING.
.
.
" better wait for this weekly candle to close above 300 "
.
.
yellow boxes mentioned above are major levels.
.
Refer old ideas.
reset chart for better view.

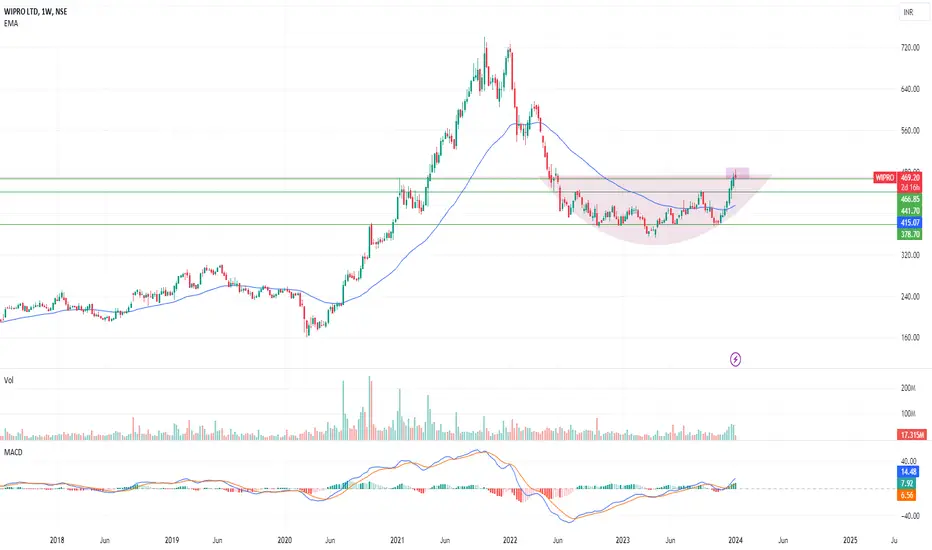
Right time to invest in WIPROIn weekly chart we can see after double top price was fall. And whole 2023 reate a strong support at 441.70.
Very Strong Support - 441.70
Now 464 resistance level is breaking. If we see this week creating a red candle but volume is good and as expected price will go higher and touch 500 within couple of month.
It Creating cup and handle pattern.
If we see very carefully couple 7 consecutive 7 week creating green candle with a good volume.
It's a good sign for investor.
SABOOSOD :Higher Timeframe Breakout Setup BSE:SABOOSOD
Company Infirmation
Saboo Sodium Chloro Ltd. engages in the manufacturing and sale of salt. The firm also focuses on the hotel industry, FMCG and hospitality. It produces surya, saboo, and tota iodized salts. The company was founded on November 22, 1993 and is headquartered in Jaipur, India.
Recent News
04- DEC -2023
Saboo Sodium Chloro Ties Up with Thailand's Dusit Thani for Resort in Rajasthan, India; Saboo Shares Climb 5%
The project involves the development of 350 villas or 700 guest rooms and wellness facilities, according to a Monday filing.
Technical Analysis
1.Trading above E M A 200
2. A tight compression near 24.5 rupees from the last 2.5 years and the level has not broken since 2011.
3. Volume supporting the up move.
4. RSI and stochasti are not overbought.
Entry should be above 24.50 of the breakout zone and the targets are mentioned on the chart.
You can keep the stop loss below the previous swing low.
Trade with proper position sizing and strict stop loss.
Keep learning,
Happy trading.

INOX WIND LTDINOXWIND
1) Time Frame - Monthly.
2) IPO Base ALL TIME HIGH MULTI YEAR breakout in monthly with good volume.
3) It is a Cup Pattern breakout. So, As per the cup pattern target It would be around (972) in the long term.
4) Recommendation - Strong buy

#GLS long term breakout trade setup (25/12/23)Greetings Folks,
today I have prepared a setup of NSE:GLS
on NSE
the analysis is as follows-
- the price is consolidating in a 160+ day structure
- the price is very contradictory, it can breakout either side, and it may even go sideways further
- i am bullish overall, but still due to the current fall in the index i am not confident in entering this trade right away
don't play with fire, always use a predefined stoploss

GREENPANEL LONG TERM BET Any one who want to make long term portfolio can go with this share as this shows reversal and if you add this share , you have higher chances of making good return in long term....and hence this share is only for long term... so analysis this share , and this sector also because this share sector looks also very strong in long term. ... . . . . . ...
stop loss and target is totally depend on yours risk taking capacity...
DISCLAIMER:- This is not my buy sell recommendation , please consult your financial advisor before taking any entry in to it... ANd below and above mentioned share which i share in all share i recommend i am not resposible for any loss and profit as well. so only , solely you are only responsible for that ....

1800-1900(minimum) by April As per financial statements growth rate EPS of TATATECH should be 22++ and at EPS of 22 and current PE its price would be around 1800-1900.
So if we believe on holding stocks with support of its fundamentals. TATATECH is a must hold company.

Century Plyboards (India) Ltdif your vision is for long term or for swing also you can buy this share because as shown in charts. buy this share. on 26 th of december becuase as shown in charts this share. start upward journey after 1 weeks . so you can go with share for quick profit , and hence quick loss , ha ha ha ha ha ha ha ha ha ha ha ha ha
This share is for long term and short term also .
For long term:-you can add postition in it when this share comes across the 750 to 790 zone. target and stop loss is totally depend on your profit and loss taking ability (Mentioned share , sector do very very good in future ) so for long term hold , hold hassle free........
For short term(swing trader):-You can add this share tommorow also there is no problem but if you want to play safe than make entry make on 26 DEC. 2023 and stop loss is around 790. this share is for quick return so please make proper quantity for that.
if you earn good return is swing so please do comment
IF YOU THINK I AM DOING GOOD WORK THAN YOU CAN FOLLOW ME ....
DISCLAIMER:-I am not responsible for any profit or loss or whatever ..trade i mentioned below and above . only you are resposible for that i am not SEBI REGISTERED consult your financial advisor before taking entry in any share. only you respobile for your loss and profit also...
THANKS...
See you in profit days ...

UNION BANK Long positionif you want you add this union bank share for outshine your portfolio, this share came to demand zone as you seen in chart also that , that distline i mentioned above, union bank seems to be good zone if he doesnt breake distil line, this share can give a handsome return, in my terms short term target means almost 3 to 4 pecent in share swing in cash....
Previously i publish idea on trading view and almost all are doing good, as you can also i previously publish idea about the kalyan jwellers and i also metioned that i also taken position in it and hence after 1 day kalyan jwellers is blasted with amost close to 7 percnet. please comment if you earn profit from this share.
This share is for short term and long term for both
Short term:-3 weeks holding time in cash only, swing , target for union bank 5 percent , stop loss is close to 112
Long term:-1.5 years to 3 years , FOR LONG TERM TARGET IS 300-400, i knew this is insane but
yeah its true , come after 3 years and see this publish idea , ha ha ha ha ha ha For long term there is no stop loss , but if you want to add than keep stop loss of close and approx to 100 , by the way if you dont add stop loss for long term than there is no problem. Hold hassle free.
You can also check my previous publish idea and analyze yourself that how accuracy i met in my trading view publish trading idea.
Thanks for reading my all long message because i believe that if you take trade than you has a all knowlede about their purchase share.
If you THINK THAT I AM DOING GOOD WORK THAN FOLLOW ME , IF YOU DONT MIND,,, it gives me motivation to publish great stock chart from you earn a handsome return , and increase lifestyle of yours,,,
if you earn good earn good profit than please comment down below i will be happy and if loss occurs than also please comment for the same as well,
DISCLAIMER:-I am not responsible for any loss or profit occurs in my all published idea. only you solely responsible for your losses, my job is to share my idea with you hence , final decision is only and only taken by you only, and also i am not SEBI registered.......
THANKS
KEEP IN TOUCH SEE YOU ALL RIGHT

DIVISLAB looks good for long term investmentDIVISLAB looks good for long-term investment. Technically speaking, it has broken the major downtrend(solid white line) and it has also failed to make a new lower low by breaking minor downtrend(dotted white line). This resilient performance signals a bullish trend, suggesting favorable conditions for potential long-term gains.

3i Infotech- c&h, flag pattern, RB3I infotech- After a small cup and handle breakout in weekly. it formed a flag pattern and today this breakout is happening for the initial target of 60.. then in the longterm bigger targets until 220 is there which will take time and will be shared later once it reaches 120.
Note: This is for educational purpose only.

INFY Trendline SupportINFOSYS has shown some sort of demand on 1hr timeframe right at the lower trendline which has been forming since 6+ months. One can make long position in the same with a target of the upper band of trendline.
Stop Loss: SL has to be below 1,325
Entry: Entries can be made after formation of a strong candle on hourly timeframe which is also backed by strong volumes
Target: Upper trendline, 1,490 - 1,500

Geekay WiresHere's the analysis of Geekay Wires. Amazing company with multiple targets.
A fundamentally strong company with equally good charts.
Here are the details-
CMP- 89.55
Buy Range- 80-87
Stoploss- 74
Targets- 94.80, 100, 115, 127 and Final target of 140.
Duration- Long term.
Way to go- Add during the buy range. Further, add on these marked important levels with a final target of 140.
Let me know what you think about this.
Please note, this is not a stock recommendation. This analysis is purely for practice and educational purposes.

Investment pick- Marksans pharmaMonthly chart analysis of Marksans pharma reveals a beautiful cup and handle breakout in the stock.
We have seen an ATH breakout already and a consolidation/retracement is bound to happen.
The stock is looking strong for multibagger returns with the best buy level for a positional trade is the range of 95-105
Keep this stock in your watchlist. For investment, stock can be added at CMP as well with buy on dips strategy.
Stock fundamentals:
Category-Midcap
Sector-Pharma
Industry-Pharma(Bulk drugs)
10 Year compounded profit growth:- 19%
Ratios at CMP:-
Stock PE:-19 ; Ind. PE:- 26
Debt to equity:- 0.07 (negligible)
ROCE:- 22%; ROE:-20% ; P/B:- 3.07; PEG:- 0.34

Last One Year Market Analysis 2December 1st 2022 was a nifty top. Now in the last trading day that is December 1st 2023 we have new high. So we look at at this one year period which began with nifty at ATH and now again at ATH. How has nifty, the broader market and the sectoral indices performed in this while?

Last One Year Market Analysis 1December 1st 2022 was a nifty top. Now in the last trading day that is December 1st 2023 we have new high. So we look at at this one year period which began with nifty at ATH and now again at ATH. How has nifty, the broader market and the sectoral indices performed in this while?

WALCHAND NAGAR IND | Multi Year Triangle Breakout.NSE:WALCHANNAG
Walchandnagar Industries Ltd. engages in the manufacture of engineering products. It operates through the following segments: Heavy Engineering, Foundry and Machine Shop, and Others. The Heavy Engineering segment engages in the engineering, fabrication, and manufacturing of machinery for sugar plants, cement plants, boilers and power plants, industrial and marine gears, mineral processing and EPC, petrochemicals, and space, defense, and nuclear power businesses.
Walchand Nagar Ind. Technical Analysis on weekly time frame:-
1. Price has rebound from the strong support zone after a breakdown has failed.
2. The Symmetrical triangle is been in formation for the last 3.2 years and the location on the symmetrical triangle is bullish as it has formed around the support zone, so we can say Its extrinsically is bullish in nature and intrinsically too.
3. The Price is been Trading above 200 SMA which is a Bullish sign.
4. The price is been in a range for over 1.5 Decades and is currently at lower range support.
Entry Aggrassiv can enter now and safe investors should wait for a retest of the triangle breakout zone it will add more confirmation to it.
Target levels and stop-loss is mentioned on the chart.
Walchand Nagar Ind. Fundamental Analysis Points:-
1. Company Turned into Net profit after many Years.
2. Revenue is increased and Long Term has been Reduced.
3. EPS is improving Marginally.
4. Although one concern is a reduction in assets.
The above information is for educational purposes only, Before acting on any investment idea please do your own analysis and follow proper risk to reward.
I Hope you found this helpful.
Please like and comment.
Keep Learning,
Happy Trading!
