GBPCHF - CORRECTION NEAR EXHAUSTION?Symbol - GBPCHF
GBPCHF continues its corrective move, forming lower lows amid ongoing macroeconomic uncertainty and concerns related to US policy. GBPCHF remains within a bearish structure but is now approaching a key demand zone around 1.0555 – 1.0530, where buying interest could potentially emerge.
Despite the prevailing downside momentum, the pair is nearing an area that could attract bullish participation. If buyers manage to defend this demand zone, a meaningful rebound from these levels may follow.
Resistance levels: 1.0600, 1.0647, 1.0685
Support levels: 1.0560, 1.0535
If the price fails to hold above the current support and liquidity zone shown on the chart, another wave of selling pressure could develop. However, given the broader market context, the likelihood of a deeper decline appears limited.
Longtradesetup

EURCAD - APPROACHES KEY LIQUIDITY ZONESymbol - EURCAD
EURCAD is currently undergoing a correction towards a key liquidity zone within the context of a broader and well established bullish trend. The question remains - will the bulls step in around the 1.6175 area?
EURCAD is retracing toward a strong support zone near 1.6175, contributing to short-term weakness in the pair. Despite this correction, the overall trend remains bullish, and a reaction from buyers in this region appears likely.
A false breakout above resistance has triggered the ongoing pullback. However, price action remains confined within the established trading range between 1.6400 & 1.6173. The market now appears to be gravitating toward support for a potential retest, and this zone could serve as a foundation for renewed upward movement.
Resistance levels: 1.6330, 1.6400
Support levels: 1.6175, 1.6030
A liquidity pool just below the 1.6200 - 1.6170 area may shift momentum in favor of buyers. Given that the broader structure remains bullish, this presents a potential advantage for long positions. A false breakdown of support, coupled with a lack of downside momentum, could act as a catalyst for renewed growth.

ZECUSDT - HOLDING STRONG AMID MARKET WIDE LIQUIDATIONSSymbol - ZECUSDT
CMP - 267.18
ZECUSDT has demonstrated notable resilience amid the broader cryptocurrency market downturn, which triggered over $10 billion in long position liquidations. Even in such an environment, certain assets have managed to withstand the selling pressure.
The cryptocurrency market remains gripped by panic and widespread liquidations, with Bitcoin currently testing the 100K level under intense selling pressure. However, amidst this turmoil, a few altcoins have shown relative strength - ZECUSDT being one of them as it continues to climb and test key resistance zones.
ZEC experienced a sharp decline earlier but found strong demand near the high volume node around 145 - 155. The subsequent aggressive rebound indicates the presence of solid bullish interest at these levels.
Resistance levels: 280.30, 305.65
Support levels: 242.64, 208.76
Focus remains on the 280.20 trigger zone. If the current retest does not result in a deep pullback and price consolidates near resistance, the likelihood of a breakout increases substantially. A decisive close above 280.30 - 280.50 could open the path for a rally toward 305 - 345. That said, it remains a high-risk setup, and traders are advised to exercise caution and maintain tight stoploss.

GOLD - PULLBACKS LIKELY BEFORE CONTINUED UPSIDE - UPTREND INTACTSymbol - XAUUSD
CMP - 3369.50
Gold has been advancing steadily since the start of the trading session, moving toward the 3374 area of interest. Following a breakout above prior consolidation resistance, the metal may now be poised to retest this breakout level before continuing its upward trajectory.
The current rally is supported by heightened trade related risks and a softening US dollar. After briefly declining to 3310, gold resumed its upward momentum, with a key objective at the 3368 resistance level. The recovery is underpinned by ongoing uncertainty surrounding Trump’s trade policy, market anticipation ahead of Powell’s upcoming speech, and broader geopolitical tensions - including trade disputes with the EU, political instability in Japan, and recent criticism of the Federal Reserve from the White House. These factors have prompted a temporary flight to safety, benefiting gold.
From a technical perspective, gold is in a post-breakout realization phase following the consolidation breakout. However, resistance at 3368 has capped further gains for now, and a near-term pullback remains possible. The 3350–3355 support zone is currently in focus. Sustained bullish control above this level could reignite upward momentum and reestablish the breakout continuation.
Key Resistance Levels: 3368, 3374
Key Support Levels: 3345, 3332
The broader market bias remains bullish, bolstered by dollar weakness and persistent risk aversion. Market participants are closely monitoring developments involving Trump and remarks from Powell. Should Powell signal a dovish shift - such as a potential rate cut announcement (e.g. during tomorrow’s 12:30 GMT statement) - gold may extend its gains.

BITCOIN - SYMMETRICAL TRIANGLE FORMING WITHIN A BULLISH TRENDSymbol - BTCUSDT
Bitcoin is consolidating. A symmetrical triangle pattern is forming within the context of a prevailing bullish trend. Based on the current technical setup, it is reasonable to interpret this consolidation as a preparatory phase for a continuation of the upward movement.
Fundamental nuances have gradually improved over recent weeks, contributing to a moderate revival in the cryptocurrency market. From a technical standpoint, the market structure on the daily chart appears constructive. Following a period of strong upward momentum, the price has entered a consolidation phase rather than showing signs of reversal. The overall market remains bullish. After approximately 2–3 weeks of consolidation, a bullish distribution pattern appears to be developing. This cycle has repeated on two previous occasions. On the daily timeframe, the presence of extended lower wicks during the consolidation phase suggests that large market participants (whales) are actively absorbing downward pressure, thereby preventing the price from entering risk zones. Accordingly, it is likely that the current consolidation could persist for a time, and there remains the possibility of a retest of the triangle’s lower boundary or even a deeper move to test the liquidity zones around 1,01,400 and 1,00,700 before resuming the upward trend.
Resistance levels: 1,03,600, 1,04,400, 1,05,000
Support levels: 1,02,500, 1,01,400, 1,00,600
A downside scenario may be considered if the price breaks through the triangle’s lower boundary and stabilizes around the 1,01,400 level, potentially forming a pre-breakdown consolidation-assuming no immediate rebound follows.
However, at present, intraday trading strategies can be considered within the range of the ongoing consolidation. A breakout to the upside and continuation of the bullish trend would likely be signaled by consolidation within the 1,03,500 to 1,05,000 range, accompanied by price compression toward the upper boundary.

HBL Engineering Ltd 🔍 1D (Daily Timeframe) Analysis: Context and Macro Structure
Structure and Key Zones:
Price is trading at ₹523.40, showing bullish intent after a recent swing low and a clean market structure shift (MSS) around April 1st.
Fair Value Gaps (FVGs) around ₹445–₹475 have been respected with a strong bullish reaction from the OB (Order Block).
There is an old bearish FVG between ₹545–₹565 that is yet to be fully mitigated.
Current price is consolidating under a small internal liquidity zone (marked blue box).
Bias:
Bullish short-term bias as price broke market structure to the upside and is now in a re-accumulation range.
Likely targets include:
Target 1: ₹545 (old supply/FVG zone)
Target 2: ₹565 (full FVG mitigation & potential liquidity sweep above recent highs)
Daily Stop-Loss Ideas:
Below ₹475 (last bullish OB/FVG zone) makes sense if taking swing longs.
⏰ 1H (Hourly Timeframe): Mid-Level Refinement
Observations:
Price made a clean Break of Structure (BOS) and CHOCH indicating a reversal around April 15th.
Strong OB formed near ₹510–₹514, has been tapped into and respected.
Volume Imbalance (VI) around ₹517–₹521 now acting as dynamic support.
Price is now in a tight range under previous high liquidity (PWH zone).
Liquidity Pools:
Above: Weak High & recent equal highs around ₹529–₹532 (magnet)
Below: PDH & OB zones near ₹510 could attract a quick liquidity grab before reversal.
Trade Idea (Intraday to Swing):
Entry Zone: ₹517–₹521 (discount OB + VI)
Stop Loss: ₹510.5 (below 1H OB + liquidity)
Target 1: ₹530 (internal high)
Target 2: ₹545 (daily FVG)
RR: Around 1:2.5 to 1:3
This trade would be based on a liquidity sweep + continuation model — a smart money setup.
⏱ 15M (Execution Timeframe): Entry Precision
Observations:
Multiple CHOCH and BOS signals around the ₹521–₹523 region.
A micro-FVG and a CMSL (consolidated mitigation zone) formed after sharp rally on April 21.
Price is now revisiting this zone, offering an ideal scalp-to-swing entry setup.
Ideal Execution Plan:
Entry Zone: ₹520.5–₹523 (FVG + CMSL)
Confirmation: Look for a bullish engulfing / break of lower timeframe CHOCH in this zone
Stop Loss: ₹518.5 (below VI zone)
Scalp Target: ₹529–₹530 (PWH)
Swing Target: ₹545+ (1D FVG zone)
🧠 ICT + SMC Narrative: What’s the Market Maker Doing?
Liquidity Engineering: The market has engineered equal highs on both 15M and 1H — textbook setup for a liquidity raid.
Displacement + Retracement: Bullish displacement occurred. Now the retrace into an OB/VI zone creates a high-probability re-entry.
Order Flow: Strong bullish OB on 1D and 1H has held. Order flow is bullish.
📌 Summary of Trade Setup
Element Value
Bias Bullish
Entry ₹520.5–₹523
Stop Loss ₹518.5 (tight) / ₹510.5 (swing)
Target 1 (Scalp) ₹530
Target 2 (Swing) ₹545–₹565
Risk:Reward (approx) 1:2.5 to 1:3
Invalidated Below ₹510 (swing bias changes)

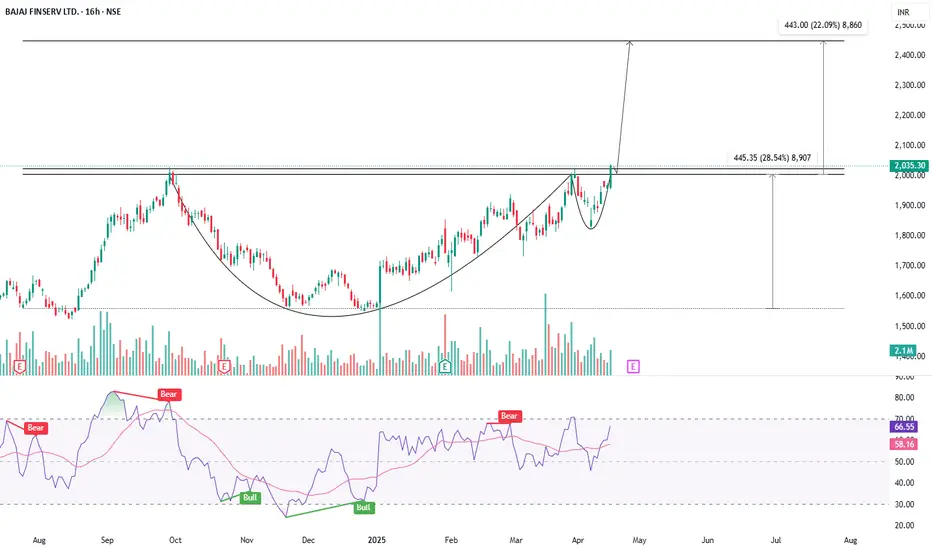
CUP & HANDLE ON THE CHART - IS BAJAJ FINSERV READY FOR LIFTOFF?Symbol - BAJAJFINSV
Bajaj Finserv Ltd. is a leading Indian financial services company engaged in insurance, lending, asset management, and wealth advisory. It operates through its subsidiaries like Bajaj Finance and Bajaj Allianz, making it a major player in the sector. The company is classified as a Systemically Important Non-Deposit taking NBFC.
Bajaj Finserv has recently shown a strong bullish breakout after forming a cup and handle pattern on the larger TF charts - A widely recognized bullish continuation setup. The breakout has occurred with notable volume, lending credibility to the move and signaling the potential for a sustained uptrend.
The stock is currently trading just above its breakout point, and a retest of the breakout zone 1980-2000 is possible. This area now acts as a strong support and provides an attractive entry opportunity for long positions.
Based on the technical pattern, the medium-term target for the move is projected at around 2450, implying an upside of nearly 22% from current levels. The pattern’s depth and the strength of the breakout support this target.
For risk management, a stop loss around 1800 is suggested, just below the handle's base, providing a good risk-to-reward setup.
The formation and breakout from the cup and handle pattern on a higher time frame adds strong bullish conviction to Bajaj Finserv’s chart. For investors looking to ride a medium-term trend with favorable risk-reward dynamics, this may be an opportune moment to enter or accumulate.
Disclaimer: The information provided here should not be construed as a buy or sell recommendation. It reflects my personal analysis and my trading position. Please consider this trading idea for educational purposes only. Thank you!
SANDUMA-Positional Long trade-Swing tradeStock has rejected trendline multiple times. In next 1-2 session if it holds above 450 and breakout the trendline with bullish candle. Good opportunity to go long.
If it falls below 450, avoid.
Please don't forget click on follow button so you won't miss any upcoming ideas.
Any confusion, feel free to drop msg. Happy to help :)
This is only for educational purpose, please manage your risk accordingly.

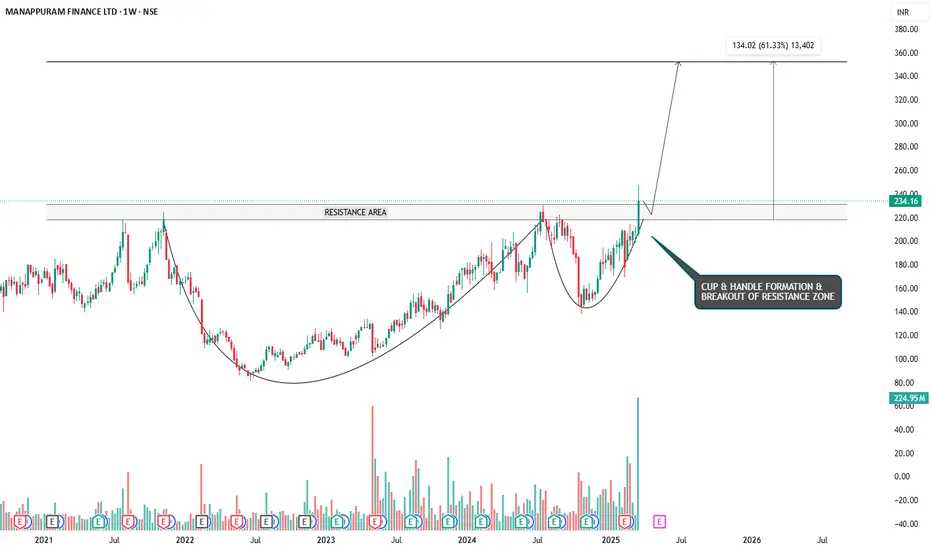
RIDING THE WAVE - CUP & HANDLE BREAKOUT IN MANAPPURAM FINANCESymbol - MANAPPURAM
CMP - 234.16
Manappuram Finance is a Non-Banking Finance Company (NBFC), which provides a wide range of fund based and fee based services including gold loans, money exchange facilities, etc. The Company is a Systemically Important Non-Deposit taking NBFC.
Manappuram Finance Ltd. has recently demonstrated a significant bullish breakout, having formed a classic cup and handle pattern on a larger time frame and breaking out with strong volume. The cup and handle pattern is a well-regarded bullish breakout formation, and when it occurs on weekly or larger time frames, it tends to be highly reliable, indicating a robust upward momentum.
Currently, the stock price may retest the breakout zone, which coincides with the previous resistance area; now turned support - around the 230 to 217 range. This retest is a natural price action behavior and offers an attractive entry point for long positions before the stock continues its upward trajectory.
The target for this breakout, based on technical projections, is around 350, representing a 60% upside from the current market price. Given the strength of the breakout and the established pattern, this target appears achievable over the medium term.
For risk management, a stop loss can be placed around the 197 level, providing a reasonable cushion in case of a price reversal.
From a broader perspective, the formation of a cup and handle pattern coupled with a successful breakout on higher time frames adds a significant bullish bias to the stock. Investors looking for a favorable risk-to-reward setup may find this an opportune time to initiate or add to their positions in Manappuram Finance.
Disclaimer: The information provided here should not be construed as a buy or sell recommendation. It reflects my personal analysis and my trading position. Please consider this trading idea for educational purposes only. Thank you!
ETERNAL(ZOMATO)-Short term/positional long tradeStock has rejected trendline multiple times. From past 2 days it's holding near trendline and gone side ways.
If we see a breakout in 15th Apr'25 trading session it is good opportunity to go long.
Please avoid if goes below 218 or Opens gap down.
Please don't forget click on follow button so you won't miss any upcoming ideas.
Any confusion, feel free to drop msg. Happy to help :)
This is only for educational purpose, please manage your risk accordingly.

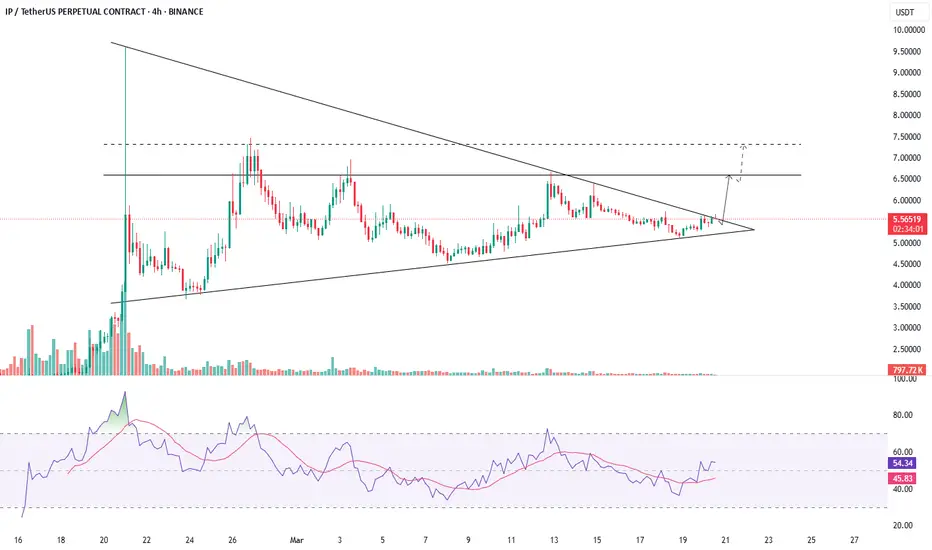
IPUSDT - POISED FOR A BREAKOUTSymbol - IPUSDT
CMP - 5.5500
IPUSDT is currently establishing favorable conditions for potential growth. Bitcoin has provided a modest boost to the market following positive developments regarding the SEC and XRP, a factor that has not gone unnoticed within the crypto community.
The IPUSDT coin has experienced an extended period of consolidation, forming a symmetrical triangle pattern. The upward trend in lows, coupled with the consolidation phase and the subsequent breakout above the triangle's resistance, signals positive indications of a potential distribution phase (the culmination of the consolidation). The key resistance level at 5.6297 remains a crucial barrier, separating the market from a more liberated zone.
Resistance levels: 5.6297, 6.6310
Support levels: 5.1160, 4.7830
Over the past few days, the price has consistently approached the triangle resistance and is building momentum for a potential breakout. Multiple intraday retests of this region demonstrate market interest in surpassing this boundary. A successful breakout above the 5.6297 resistance level, followed by consolidation above the triangle, would serve as a strong signal of readiness for upward movement.
MPHASIS - TRADE OPPORTUNITY ON LONG SIDESymbol - MPHASIS
CMP - 2251
Mphasis, a global provider of Information Technology solutions specializing in cloud and cognitive services, leverages next-generation technology to assist enterprises in transforming their businesses worldwide.
Recently, Mphasis has experienced a decline due to selling pressures in Nasdaq and U.S. IT stocks, as well as negative data and news flow related to the IT sector. Currently, Mphasis is approaching a crucial support zone in the range of 2250–2180 which has held since July 2023
I anticipate a significant rebound from this level, which is why I am entering long positions in Mphasis Futures at the current market price of 2251. Should the price reach the 2200 range, I will consider adding additional positions. To manage risk, my stop-loss is set at 2170, providing protection in case the support zone fails to hold and the price moves lower. On the upside, I am targeting price levels of 2400 and 2500
Disclaimer: The information provided here should not be construed as a buy or sell recommendation. It reflects my personal analysis and my trading position. Please consider this trading idea for educational purposes only. Thank you!

TATA COMMUNICATIONS - TRADING AT MAJOR SUPPORT ZONESymbol - TATACOMM
CMP - 1388
Tata Communications Ltd. has shown weakness over the past few months, with the overall technical structure indicating a bearish outlook. However, the stock has recently reached a major demand zone, which lies between the 1380-1350 range, a level that has held significant support in previous price actions since 2021. This zone could act as a strong demand area, potentially offering a good trading opportunity at current prices.
The stock has been under selling pressure in the short term, but as it approaches this demand zone, the probability of a reversal or at least a short-term bounce increases. The technical indicators suggest that the stock is at a crucial level where the demand could pick up, leading to a possible upward movement from current levels. Although the broader trend has been bearish, the price action near this support level creates an attractive risk-reward setup.
Given the recent price action, I am taking long positions in TATACOMM Futures at 1388. I will look to add more positions if the price reaches 1360-1350 range. My SL is set at 1325 to manage risk, ensuring protection in case the price fails to hold the demand zone and continues lower.
The target I am expecting is 1520, which represents more than a 10% upside from current levels. This target aligns with previous resistance areas and the potential for a bullish move once the stock stabilizes at the demand zone.
Disclaimer: The information provided here should not be construed as a buy or sell recommendation. It reflects my personal analysis and my trading position. Please consider this trading idea for educational purposes only. Thank you!

GBPUSD - TREND REVERSAL?Symbol - GBPUSD
GBPUSD is attempting to capitalize on a potential trend reversal amid the ongoing correction of the U.S. dollar. The price is currently testing a key resistance level within a consolidation phase, indicating a possible breakout. On the daily timeframe, the price remains above the previously breached trendline, with the effort to surpass the resistance providing insights into market sentiment. A continued correction in the dollar could benefit the British pound, particularly if the U.S. Dollar Index breaks below 107 and moves toward the 106-105 range.
From a technical perspective, attention is centered on the 1.257 level, which acts as a crucial resistance threshold. A sustained break and consolidation above this level may trigger a rally.
Resistance levels: 1.2575, 1.2718
Support levels: 1.250, 1.2377
I do not rule out the possibility of a retest of the 1.250 support level to accumulate liquidity before further upward movement. The dollar is expected to continue its correction following remarks from Trump and Powell regarding potential rate cuts.

GAIL - EXPECTING A BOUNCESymbol - GAIL
CMP - 158.10
GAIL Ltd. has been following a downward trend over recent months, with the overall technical structure remaining bearish. However, the stock has recently reached a crucial support zone, which lies between the 154-162 range, a level that has held strong since January 2024. This area serves as a key support zone, and it could offer the stock a potential bounce from its current bearish trend.
The stock is currently forming a rounding top pattern, a classic bearish formation that indicates a possible continuation of bearish trend at current levels or even trend reversal. Despite the overall bearish pattern, the price is consolidating near this important support level, which increases the probability of a bounce. While a short-term upward move is possible, the stock may resume its downtrend after this bounce.
In the short term, the trend is still slightly bearish. The stock has encountered some selling pressure near its support zone but is testing the resilience of this critical level. For me, The current market price around 158 offers an opportunity for a long position. It may be prudent to add more to this position as the price moves toward 153-152, while keeping a stop loss at 148 to manage risk.
However, if the stock breaks below 150 and sustains below this level, the current bounce scenario would be invalidated, and the stock would likely face further selling pressure, accelerating the downtrend.
Disclaimer - Do not consider this as a buy/sell recommendation. I'm sharing my analysis & my trading position. You can track it for educational purposes. Thanks!

OMUSDT - BULLISH MOMENTUM MAY PERSISTSymbol - OMUDST
CMP - 7.2828
OMUSDT remains an attractive asset, with consolidation forming in a flag pattern within the prevailing bullish trend. OMUSDT continues to form consolidation within the uptrend, and growth may follow if the resistance at the local channel is broken. The price structure appears robust, especially in contrast to the generally weak performance of the altcoin market.
Following Trump's speech yesterday, Bitcoin managed to surpass local resistance and entered the buying zone. If the price maintains a position above the 96.5K - 97K range and sustains its upward movement, certain altcoins may experience bullish momentum, which could propel them higher, including the already strong OMUSDT.
From a technical standpoint, the focus is on the local descending flag channel, with two critical support levels at 7.324 - 7.213. A false breakdown at these levels could trigger a continuation of the upward movement.
Key resistance: 7.755
Key support levels: 7.324, 7.213
The catalyst for continued growth lies in breaking through the channel boundary and the resistance at 7.755. Currently, the price is still distant from this zone and is approaching the support levels. A retest of the liquidity zone may culminate in a bullish impulse.

CHFJPY - TIME FOR A LONG ENTRYSymbol - CHFJPY
CMP 167.28
CHFJPY is currently trading within a key support zone, which has been acting as a major support area since November 2023. This level has provided a solid foundation for price action, and its importance in maintaining the current bullish trend cannot be understated.
In my analysis, CHFJPY is presenting a good opportunity to initiate long positions at this juncture. The current price level appears to be well-positioned for upward movement, making it an ideal entry point for traders looking to capitalize on potential gains.
However, there are critical levels to monitor for the potential shift in trend. A breakdown below the 166.30 area could prompt further selling pressure, and a sustained move below 165 would confirm the transition from a bullish to a bearish trend. In such a scenario, a retest of this breakdown level would provide a viable short trade opportunity.
On the other hand, in the case of a recovery, which I am expecting, CHFJPY could see a rise toward the 169.20 and 170.30 levels. These levels represent key resistance points, and a successful breach of these zones could signal a continuation of the bullish trend.
Key Resistance levels: 169.00, 170.30
Key Support levels: 167.20, 166.30

BULL FLAG FORMATION IN ADANI GREEN ENERGY - SWING TRADESymbol - ADANIGREEN
CMP 988
Adani Green Energy Limited, incorporated in 2015, is a holding company of several subsidiaries carrying business of renewable power generation within the group and is primarily involved in renewable power generation and other ancillary activities.
In Adani Green Energy, a bullish flag formation has developed. A breakout from this formation is expected to drive the price towards 1240, representing an approximate upside of 26% from the current level. I am initiating a long position in the Futures at the current market price 988
Additionally, I plan to increase my position near the 970-965 price range and will maintain the long position with a stop loss at 938
Disclaimer - Do not consider this as a buy/sell recommendation. I'm sharing my analysis & my trading position. You can track it for educational purposes. Thanks!

BERGER PAINT - LONG TRADE IN FUTURESSymbol - BERGEPAINT
BERGEPAINT is currently trading at 445
I'm seeing a trading opportunity on buy side.
Buying BERGEPAINT Futures at 445
I will add more long position at 438, if comes.
Holding with SL of 432
Targets I'm expecting are 462 - 475 & above.
Disclaimer - Do not consider this as a buy/sell recommendation. I'm sharing my analysis & my trading position. You can track it for educational purposes. Thanks!

ASTRAL - SWING TRADE ON LONG SIDESymbol - ASTRAL
ASTRAL is currently trading at 1555
I'm seeing a trading opportunity on buy side.
Buying ASTRAL Futures at 1555
I will add more long position at 1535, if comes.
Holding with SL of 1515
Targets I'm expecting are 1630 - 1685 & above.
Disclaimer - Do not consider this as a buy/sell recommendation. I'm sharing my analysis & my trading position. You can track it for educational purposes. Thanks!

GBPUSD LONG - TRADE IDEA FOR HUGE PROFITSymbol - GBPUSD
GBPUSD is currently trading at 1.2310
I'm seeing a trading opportunity on buy side.
Buying GBPUSD pair at CMP 1.2310
I will be adding more if 1.2270 comes & will hold with SL 1.2240
Targets I'm expecting are 1.2430 - 1.270 & above
Disclaimer - Do not consider this as a buy/sell recommendation. I'm sharing my analysis & my trading position. You can track it for educational purposes. Thanks!

OIL INDIA - SWING TRADE ON LONG SIDESymbol - OIL
OIL is currently trading at 420
I'm seeing a trading opportunity on buy side.
Buying OIL Futures at 420
I will add more long position at 410, if comes.
Holding with SL of 397
Targets I'm expecting are 445 - 460 & above.
Disclaimer - Do not consider this as a buy/sell recommendation. I'm sharing my analysis & my trading position. You can track it for educational purposes. Thanks!

NIFTY50 - REVERSAL SWING TRADE ON LONG SIDESymbol - NIFTY50
NIFTY is currently trading at 23585
I'm seeing a trading opportunity on buy side.
Buying NIFTY Futures at 23585
I will add more long position at 23435, if comes.
Holding with SL of 23275
Targets I'm expecting are 24080 - 24210 - 24400
Disclaimer - Do not consider this as a buy/sell recommendation. I'm sharing my analysis & my trading position. You can track it for educational purposes. Thanks!
