Risk-Free and Low-Risk Trading Strategies1. Understanding Risk in Trading
1.1 What is Trading Risk?
Trading risk refers to the potential for loss due to market fluctuations, liquidity issues, or unforeseen economic and geopolitical events. Different asset classes carry different levels of risk:
Equities: Subject to company performance, market sentiment, and macroeconomic factors.
Forex: Volatile due to leverage, geopolitical events, and central bank policies.
Derivatives: High-risk instruments due to leverage and expiration dates.
Commodities: Influenced by supply-demand imbalances, weather, and global events.
Understanding risk is crucial for creating strategies that aim to minimize exposure while ensuring growth.
1.2 Types of Risk
Traders encounter several forms of risk:
Market Risk: Fluctuations in asset prices due to macroeconomic or sector-specific factors.
Credit Risk: The possibility that a counterparty defaults on financial obligations.
Liquidity Risk: Difficulty in buying or selling an asset without affecting its price.
Operational Risk: Failures in internal systems, processes, or human error.
Systemic Risk: Large-scale financial events affecting entire markets.
Low-risk strategies are designed to reduce market and systemic risk while providing predictable returns.
2. Risk-Free vs. Low-Risk Trading
2.1 Risk-Free Trading
In reality, no investment is entirely risk-free, but some instruments are considered nearly risk-free:
Government Bonds: Especially from stable economies like U.S. Treasuries.
Bank Fixed Deposits: Insured and low volatility.
Cash Equivalents: Money market funds, Treasury bills, and other short-term instruments.
These instruments provide predictable returns with minimal exposure to market fluctuations.
2.2 Low-Risk Trading
Low-risk trading involves strategies designed to protect capital while generating small, steady profits. These strategies accept minor risks in exchange for higher liquidity, flexibility, and compounding benefits.
3. Key Principles of Low-Risk Trading
Capital Preservation: The main goal is to avoid large drawdowns.
Diversification: Spreading capital across assets reduces single-asset exposure.
Risk-Reward Management: Targeting small, consistent profits while keeping losses limited.
Position Sizing: Allocating only a small percentage of capital per trade.
Leverage Caution: Avoiding excessive leverage, which amplifies both gains and losses.
Stop-Loss Orders: Automatic exit points to prevent catastrophic losses.
Consistent Evaluation: Continuous review of performance and market conditions.
4. Popular Low-Risk Trading Strategies
4.1 Hedging Strategies
Hedging involves opening positions to offset potential losses in existing investments. Common methods include:
a) Options Hedging
Protective Put: Buying a put option on a stock you own to guard against downside.
Covered Call: Selling a call option while holding the underlying stock to earn premiums.
Example:
If you own 100 shares of a stock priced at $50 and buy a put with a $48 strike, you limit your loss to $2 per share if the stock falls.
b) Futures Hedging
Locking in prices of commodities or currencies through futures contracts.
Common among farmers, exporters, and importers to stabilize cash flows.
c) Currency Hedging
Used by traders exposed to foreign currencies.
Involves forward contracts or options to mitigate exchange rate risk.
Advantages: Reduces exposure to price fluctuations.
Disadvantages: Hedging costs (premiums) may reduce profits.
4.2 Arbitrage Strategies
Arbitrage exploits price discrepancies between markets to earn nearly risk-free profits. Types include:
a) Spatial Arbitrage
Buying an asset in one market at a lower price and selling it in another at a higher price.
Example: Gold priced differently on NY and London exchanges.
b) Triangular Forex Arbitrage
Exploiting discrepancies in currency pairs.
Example: USD/EUR, EUR/GBP, and GBP/USD cross-rates not aligned.
c) Statistical Arbitrage
Using algorithms to detect short-term mispricing in stocks or derivatives.
Relies on historical price correlations.
Advantages: Minimal market risk when executed quickly.
Disadvantages: Requires sophisticated tools, low margins, and high transaction costs.
4.3 Pair Trading
Pair trading involves going long on one asset and short on a correlated asset. The goal is to profit from relative price movements rather than absolute market direction.
Example:
Long Stock A and Short Stock B in the same industry.
If Stock A outperforms Stock B, the trade earns profit regardless of overall market movement.
Advantages: Market-neutral and reduces exposure to systematic risk.
Disadvantages: Correlation breakdowns can cause losses.
4.4 Dividend Capture Strategy
This strategy focuses on buying stocks just before the ex-dividend date and selling shortly after to collect dividends. Key points:
Works best with stable, high-dividend-paying stocks.
Requires attention to ex-dividend dates and tax implications.
Market volatility may reduce gains if stock prices drop significantly post-dividend.
Advantages: Steady income with low capital risk.
Disadvantages: Transaction costs and short-term price fluctuations can erode profits.
4.5 Low-Volatility Trading
Investing in low-volatility assets reduces exposure to sudden market swings. Techniques include:
Selecting stocks with low beta (less sensitive to market movements).
Using ETFs that track defensive sectors like utilities, healthcare, or consumer staples.
Focusing on short-term risk metrics, such as ATR (Average True Range) or standard deviation.
Advantages: Smooth returns, capital preservation.
Disadvantages: Lower upside potential compared to high-volatility trading.
4.6 Fixed-Income Laddering
Laddering involves buying bonds or deposits with staggered maturities to reduce interest rate risk. Example:
Invest $10,000 across 1-year, 2-year, and 3-year bonds.
As each bond matures, reinvest at current rates.
Advantages: Reduces interest rate risk, ensures liquidity.
Disadvantages: Returns are generally lower than equities or leveraged trades.
4.7 Trend-Following with Tight Risk Controls
Trend-following can be adapted for low-risk trading by using:
Small position sizes.
Trailing stop-loss orders to lock in profits.
Limiting trades to well-established trends in low-volatility markets.
Advantages: Potential for higher returns without excessive exposure.
Disadvantages: False breakouts can trigger small losses.
4.8 Market-Neutral Strategies
Market-neutral strategies aim for profits regardless of market direction:
Long/Short Equity: Simultaneously long undervalued stocks and short overvalued ones.
Delta-Neutral Options: Balancing options and underlying stock to eliminate directional risk.
Convertible Arbitrage: Buying convertible bonds and hedging with stock positions.
Advantages: Protects capital from systemic market movements.
Disadvantages: Complex, requires active monitoring.
5. Risk Management Tools
5.1 Stop-Loss and Take-Profit Orders
Automatic exit orders limit losses and secure profits. Types:
Fixed Stop-Loss: Predetermined price level.
Trailing Stop: Adjusts dynamically as the trade moves in favor.
5.2 Position Sizing and Capital Allocation
Risk per trade should be a small percentage of total capital (commonly 1–3%). This prevents single losses from wiping out the portfolio.
5.3 Portfolio Diversification
Spread investments across:
Asset classes: equities, bonds, commodities.
Sectors: healthcare, technology, finance.
Geographies: domestic and international markets.
5.4 Volatility-Based Risk Assessment
Use ATR, standard deviation, and beta to measure potential risk.
Adjust position sizes based on market volatility.
5.5 Hedging with Derivatives
Options and futures can protect the portfolio from adverse movements, creating synthetic risk-free exposures.
6. Implementing Low-Risk Trading in Practice
Define Your Risk Tolerance: Determine how much loss you can withstand per trade and per portfolio.
Select Suitable Assets: Focus on low-volatility, high-liquidity instruments.
Choose a Strategy: Hedging, pair trading, dividend capture, or fixed-income laddering.
Set Entry and Exit Rules: Use technical indicators or calendar events.
Monitor and Adjust: Review trades regularly and adjust stop-loss or hedge positions.
Use Technology: Automated platforms, robo-advisors, and algorithmic trading can improve execution speed and reduce human error.
Review Performance: Keep a trading journal for continuous improvement.
7. Advantages of Low-Risk Trading
Capital Preservation: Minimizes the probability of catastrophic losses.
Predictable Returns: Provides steady, compounding growth.
Lower Stress Levels: Less emotional volatility than high-risk trading.
Diversification Opportunities: Can coexist with high-risk trades for balanced portfolios.
Sustainable Strategies: Works well for long-term wealth accumulation.
8. Limitations and Considerations
Lower Returns: Conservatism comes at the cost of reduced upside potential.
Time-Consuming: Hedging and monitoring multiple positions require discipline.
Hidden Costs: Transaction fees, option premiums, and slippage can reduce profits.
Market Anomalies: Even low-risk strategies are not immune to systemic crises.
Skill Requirement: Some low-risk methods, like arbitrage, require technical expertise.
9. Case Studies
9.1 Covered Call Example
Stock XYZ trades at $100.
Sell a call option with $105 strike for $2 premium.
Stock rises to $106 → exercise the call; stock sold at $105 plus $2 premium → profit locked at $7.
Stock drops to $98 → $2 premium cushions the loss.
9.2 Pair Trading Example
Long Stock A at $50, short Stock B at $60.
After a month, Stock A rises to $55, Stock B rises to $61.
Relative gain: Stock A +$5, Stock B short -$1 → net profit $4 per share.
9.3 Bond Laddering Example
$10,000 split: $3,000 in 1-year, $3,500 in 2-year, $3,500 in 3-year bonds.
Staggered maturities reduce exposure to interest rate fluctuations and maintain liquidity.
10. Conclusion
Risk-free and low-risk trading strategies focus on capital preservation, predictable returns, and market risk mitigation. While no trading method is truly risk-free, strategies like hedging, arbitrage, pair trading, dividend capture, and fixed-income laddering significantly reduce exposure. The key lies in combining:
Disciplined risk management
Diversification across assets
Strategic use of derivatives and technical tools
By carefully implementing these methods, traders can achieve consistent returns, reduce stress, and build wealth sustainably over the long term. Low-risk trading is particularly suitable for conservative investors, retirees, and professionals seeking steady growth while protecting capital from unpredictable market events.
Lowrisk
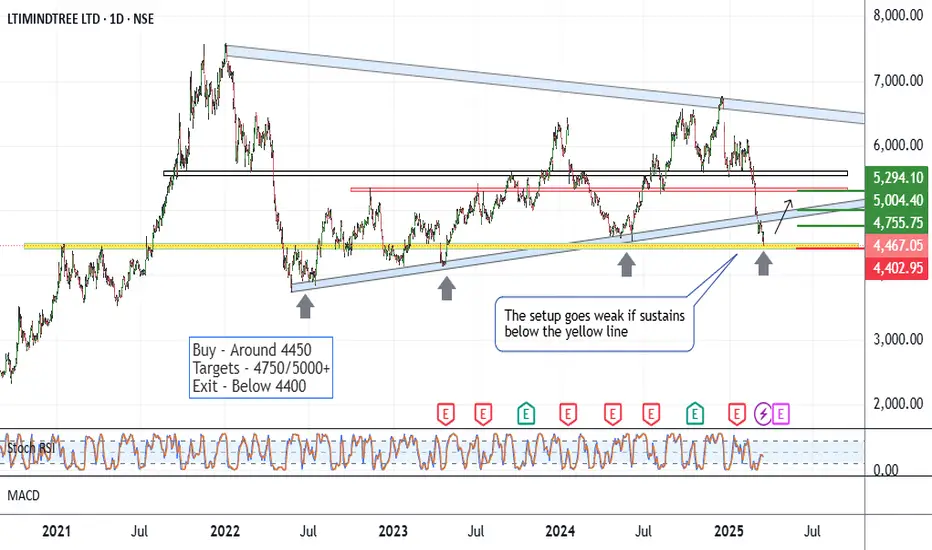
LTIM - Low Risk IdeaCMP 4467 on 16.03.25
The chart shows all the critical levels. The price has corrected around 30% in recent weeks. At this moment, it is on support, as seen in the chart.
Considering a possible reversal from the current levels gives an idea of buying with a small risk.
Possible targets may be 4750/5000 and even more, depending on the index movement ahead.
The setup goes weak if the price sustains below 4400 for a couple of days. In given conditions, the strategy should include Hedging tools for better coverage.
All these illustrations are only for learning and sharing purposes, not a buy or sell advice in any case. I am not a registered analyst.
Before entering a trade, be ready to take a loss on what you have decided.
All the best.
Siemens - Low Risk SetupCMP 6546 on 28.12.24
For the last 6 months, the price has been oscillating between 8000 and 6500. This moment again comes near the level of 6500.
If it bounces back from here, may go into a bullish phase again. One may look for a long setup at this point because of the good risk-reward ratio.
The setup remains active above 6550. If it sustains below 6450, the setup goes weak.
Before entering, one should wait for the reversal signs according to their setups.
All this illustration is only for learning and sharing purposes, it is not a piece of trading advice in any form.
All the best.

Abans Holdings - Low Risk IdeaThe stock price has dropped more than 50% in the last 3 months. And 25% in the last 10 days.
This time, it is close to the long-time support levels of 250-260.
If it shows the reversal this time, it will be a good risk-reward trade. It may reach the levels of 310/340 or even more.
The setup remains active above the level of 255-260. If sustains below 248, the setup will go weak.
One should keep the position size following risk management.
This illustration is only for learning and sharing purposes, not a piece of trading advice in any form.
All the best.

Entry at SupportThis trade is based on Exponential Moving Average (9 &15) considered in the Weekly Time Frame.
A trade can start at the current level (Entry between 795 to 780). Maximum risk to be considered is 5% to 6%. However a strong Candle closing below 740 level will indicate EXIT from the trade.
The stock can show upward movement as below:
1) 1st Target is 20% from current level
2) 2nd Target is 30% from current level
3) 4th Target is 50% from current level .
**All targets to be observed in Weekly time frame**

Engineers India offers good RR from this price level. -Good RR setup.
-Bouncing from a support level with Volume.
-Formed a bullish engulfing candle.
-Broke out of Trendline.
-Double Bottom at support level.
Overall, it's good for a swing.
This is not a Buy/Sell Recommendation. Please do your due diligence.
Risk- 15.4%
Reward: 29.8%
RR- 1:1.9

Infy - Low Risk SetupThe stock is forming a rising wedge pattern on the daily chart. This time at the lowest edge of the wedge. If bounces back from these levels, a bullish run may be seen.
Currently at 1475 around. One should exit if sustains below 1460 ( below the wedge formation).
This illustration is only my point of view, for learning and sharing purposes, not a bit of trading advice in any form.
All the best.

Mphasis - Keep On WatchFor the past 12 months, the stock has been moving in a rising parallel channel. This moment rests at the lowest edge of the channel. If takes support and bounces back, there may be a bullish phase.
Possible early targets may be 2600/2700.
The setup fails if the price trades below 2340 ( below the channel).
This is only for learning and sharing purposes, not a trading advice in any form.
All the best.

Wheels India, a great entry opportunity!!!Good entry opportunity in Wheels India.
Price is on the trend line, so risk-reward ratio is good.
Can exit with 1:2 target also.
SL can be extended upto 530.


Apple - At Crucial LevelsIt is clear from the setup that the price is at the lower edge of the rising parallel channel. If bounces back from these levels, there may be a bullish phase.
Immediate support may be around 175. if sustains below 175, will be out of our setup.
This illustration is only my view, not a trading advice in any form. Please conduct your research before taking any trade.
All the best.

CCL Products 🚀🚀🚀( Low risk potential high reward trade).The companies fundamentals are strong, the price has taken a pause . The breakout is soon to happen be patient and attentive to enjoy the ride 😊.
FOLLOW FOR MORE.

RVNLvcp characteristics
-The Stock must be in stage 2 uptrend.
-A period of price consolidation must take place in thebase. ...
-Price volatility must contract through the base (from left to right). ...
-Price must correct through a series of smaller contractions.

Can it Persistently Rise? Market Cap 38,892 Cr.
Stock P/E 41
Industry PE 33
Piotroski score 8
ROCE 31 %
ROE 26 %
Debt to equity 0.17
OPM 18 %
EBIDT growth 3Years 38 %
Promoter holding 31 %
Persistent Systems provides software engineering and strategy services to help companies implement and modernize their businesses. It has its own software and frameworks with pre-built integration and acceleration.
BFSI accounts for the majority of revenues at 31.6%, followed by Healthcare & Life Sciences (20.8%). Tech & emerging verticals account for the remaining 47.6% of revenues.
The company has a global presence with presence in 17 countries including India, Australia, Canada, Germany, Japan etc.
The North American region contributes 78.8% of the total revenue. Contribution from India region was 10.6% and Europe was 8.7% while the Rest of the World contributed 1.9% of total revenue.

IRFC Limited 50% Upside potentialRange Consolidation on Lower volumes
Flag & Pole Pattern Breakout
Stop Loss at 45s
Target of 45-50% upside from these Zones
If the stock consolidates at these levels then right time to enter
Volumes looks really good

Nippon liam ltd breakout Nippon liam ltd broken out from a beautiful triangle pattern
Low risk trade
Good setup for swing trading

TVSMOTORCO 1htf is at very good support TVSMOTORCO 1htf is at very good support
Low risk trade
Very small stoploss
Might breakdown also so plan accordingly


#SHORTTERM #SWING #NSE ROLEXRINGRolex Rings is a leading manufacturer of forged and machined components, one of the top 5 forging companies in India and is also a Global supplier of hot rolled forged, machined bearing rings and automotive components for various segments of vehicles, Industrial Machinery, Wind Turbines and Railways.
It derives nearly 54% of its revenue from bearing rings and 38% from automotive components. Exports contributed 46% of the revenue of the company.
Top 10 customers accounted for 80% revenue of the company.
The company is not planning any major CAPEX till FY25. They will be focusing on enhancing their revenue by increasing the forging utilization to 60% and machining capacity to 85% in the near future.
Market Cap: 5,580 Cr.
P/E 29.2
ROCE 31.3 %
ROE 28.9 %
Debt to equity 0.27
OPM 22.3 %
Promoter holding 57.6 %
Pledged 0 %
EPS 70

NIFTY50 #NSE Travelling in a downward channel since Dec 2022 I'm expecting Nifty50 to take support from this zone.
Currently from the support of the channel, i expect it to at least climb the halfway mark.

ICICI BANK LTD. is getting loaded for all time high.Stock is consolidating at a good price range. Any size of green candle can be considered as a trigger. It is indicating a good swing trade. Fundamentals wise ICICI bank has given a good Quarter and Quarter results. Low risk high reward stock.

FOSECO INDIAMarket Cap 1,284 Cr.
Stock P/E 30.7
Industry PE 27.4
Dividend Yield 1.24 %
ROCE 22.2 %
ROE 16.6 %
OPM 14.5 %
Promoter holding 75.0 %
Pledged percentage 0 %
Free Cash Flow 14.4 Cr.
EPS 65.5 vs 51.2
- Foseco India Limited is engaged in the manufacture of products used in the metallurgical industry which are in the nature of additives and consumables that improve the physical properties and performance of castings.
- Key products and services include Industrial Dry Powders, Coating Products, Resin Products, Ceramic Filters and Exothermic Sleeves.
- It services the needs of Automotive, Railway and Heavy Transport, Construction and Mining, General Engineering and Petro-Chemicals and Power.
-The Co has state of the art manufacturing facilities in Pune and Pondicherry. It also imports products from its group manufacturing locations in other parts of the world. The company operates in a cellular manufacturing structure.
