XAUUSD: Downtrend Under Pressure from Strong USDCurrently, XAUUSD is trading around 3,328.400, with resistance at 3,369.000 and support at 3,313.000. The price is forming a downtrend within a price channel, and if it breaks the support at 3,313.000, it could push the price lower towards the 3,300.000 target. The EMA indicators show that the downward momentum continues, and if the price fails to break through the resistance at 3,369.000, the downtrend will remain in place.
Market Context:
Recent news has caused XAUUSD to drop, mainly due to the recovery of the USD after positive economic signals. Higher-than-expected unemployment claims data strengthened the USD, putting downward pressure on XAUUSD.
M-forex

EUR/USD Bearish Trade Idea - Detailed Analysis** IF you like my observation, please boost and follow for more content."
Timeframe: 1 Hour
Entry Price: 1.16177
Stop Loss (SL): 1.16521
Take Profit (TP): 1.15763
Market Overview:
Trend Context: The EUR/USD pair is currently in a clear downtrend as indicated by the price action making lower highs and lower lows.
Chart Setup: The chart shows a descending triangle pattern, which typically signals a continuation of the bearish trend, as the price struggles to break through the resistance at the upper boundary while consistently making lower lows.
Trade Rationale:
Descending Triangle Pattern:
The formation of a descending triangle indicates a strong bearish bias, where the sellers have been consistently defending the resistance level.
The price is making lower highs and has found support at the 1.16177 level, a key point where the downtrend has previously gained momentum.
A breakdown from this triangle often leads to a continuation of the downward movement, reinforcing the bearish outlook.
Entry Setup:
The entry point at 1.16177 is set below the support level, confirming that the price is likely to break through and continue downward.
A close below this level would provide confirmation for the short position, as the breakdown indicates further downward potential.
Stop Loss Placement:
The Stop Loss (SL) is set at 1.16521, just above the last significant swing high and the trendline of the triangle. This allows for some room in case of a false breakout while minimizing risk if the price reverses above this level.
Take Profit Target:
The Take Profit (TP) is set at 1.15763, where the previous support has been observed. This level represents a logical exit point, based on the measured move of the triangle pattern and the market's reaction at this support area.
Risk-to-Reward Ratio (RRR):
This setup offers a favorable risk-to-reward ratio, with a stop loss of approximately 45 pips and a take profit target of approximately 114 pips. This results in an RRR of about 1:2.5, which aligns with a solid risk management strategy for a favorable trade.
Technical Indicators:
Exponential Moving Averages (EMA):
The chart indicates the use of EMAs, which are still in a bearish alignment. The price is below both the 9-period and 20-period EMAs, suggesting that the overall trend is downward.
The EMA setup confirms the bearish momentum, reinforcing the rationale for the short position.

Bullish USDJPY (Long Position)Time Frame: 1-Hour
Trade Direction: Bullish
Entry Price: 148.629
Target Price: 149.262
Stop Loss: 148.108
Risk-Reward Ratio: ~2.3:1
1. Chart Analysis:
The price action has been respecting a strong ascending trendline (blue line) indicating a consistent upward momentum over the past several hours.
Price has recently bounced off the trendline and is approaching a resistance zone near 148.6, showing potential for a continuation upward towards 149.262.
Support Level: The price has previously found support at the 148.1 level, confirming a solid demand zone in the market.
2. Indicator Support:
Exponential Moving Averages (EMA): The price is currently trading above both the 9-period and 20-period EMAs, which is a bullish sign indicating upward momentum. The EMAs are also in alignment, further supporting the bullish case.
Volume Trend: There is an increase in volume accompanying the recent bullish price action, confirming strong buying interest and supporting the idea of a potential breakout towards the target.
3. Risk Management:
The stop loss is placed just below the recent low at 148.108 to provide a reasonable buffer against any price retracement, keeping the trade within an acceptable risk range.
The target is set at 149.262, just below the key resistance level, ensuring that we capture the full potential of the current trend while minimizing the risk.
4. Trade Setup Logic:
This setup is based on the continuation of the uptrend, with strong support from both the price action and indicators. The price action has successfully bounced from the trendline, confirming a potential continuation move towards higher prices.
The target lies near a resistance zone, making it a logical point for potential profit-taking.
5. Conclusion:
The overall market structure and indicators are aligned in favor of a bullish position, providing a high-probability setup. With a clear risk-reward ratio, this trade offers a favorable risk profile and a solid chance for profit.

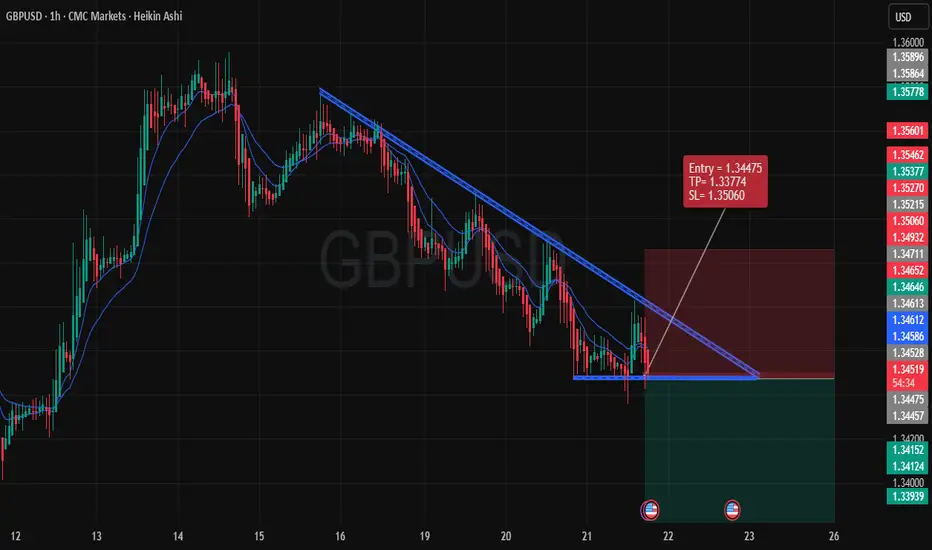
GBP/USD Bearish Trade Idea** IF you like my observation, please boost and follow for more content."
Overview:
The chart displays a clear bearish setup on the 1-hour timeframe for the GBP/USD currency pair. The pair has formed a descending triangle pattern, indicating potential downward price action. The price has been respecting the trendline resistance, which adds confidence to the short trade. Here’s a detailed breakdown of the key elements for this trade:
1. Pattern Formation:
Descending Triangle: A continuation pattern that suggests consolidation and potential breakout to the downside. The price is nearing the apex of the triangle, and we anticipate the breakout to occur below the horizontal support at 1.34495.
2. Entry Point:
The entry is set at 1.34475, just below the critical horizontal support level. This level aligns with the trendline resistance from previous price action, ensuring that we are positioning ourselves at a point where price momentum is likely to shift downward.
3. Stop-Loss (SL):
The stop-loss is placed at 1.35060, just above the trendline resistance. This level is chosen to minimize the risk in case the price fails to break the support and reverses back upward. Keeping the SL tight ensures that the risk is controlled.
4. Take-Profit (TP):
The take-profit level is set at 1.33774, based on the price's potential to reach a key support zone. The target is set at a conservative level, providing a strong risk-to-reward ratio while aligning with previous price action lows.
5. Risk to Reward Ratio:
With a SL of 85 pips and a TP of 705 pips, the trade offers a favorable 1:8.3 Risk to Reward Ratio. This ensures that the reward far outweighs the risk, making it a worthy trade setup for those seeking high probability and high return trades.
6. Technical Indicators:
Trend Indicators: The 9 and 20 EMA lines confirm the bearish trend as the price is trading below these EMAs. The cross of the 9 EMA below the 20 EMA further supports the downside momentum.
Volume: A decrease in volume during the consolidation phase suggests a buildup for a breakout, likely to the downside as indicated by the pattern.
7. Conclusion:
This trade setup provides a logical bearish scenario, supported by strong technical analysis. The entry, SL, and TP are placed strategically based on price action and pattern confirmation. A breakout below the support level at 1.34475 would trigger the short position, aiming for the next significant support at 1.33774.
The risk is well-managed with a tight SL, and the reward is significant, offering an excellent risk-to-reward profile.
Make sure to monitor the breakout closely, as this setup depends on the price respecting the triangle formation.
Gold ....Powell Speech to Break the Range?Gold held steady after yesterday’s pullback, but the 3350 zone continues to act as a strong resistance. Despite multiple bullish attempts, price has failed to break through this ceiling, keeping the upside capped. On the lower side, immediate support stands at the previous weekly low (3330), followed by the recent swing low near 3310. These levels are key for buyers to defend.
For now, price action has compressed further into a tight range, and there hasn’t been any major development since the last session. With Powell speech lined up today, the market is likely to stay cautious and range-bound until then. Once the event is out, we could see a clearer short-term direction, either a breakout above 3350 opening room for recovery, or a breakdown below 3310 tilting bias back in favor of sellers.

Gold Strongly Rebounds: Heading Towards New Targets! The gold market is showing signs of a strong recovery, with several factors supporting an upward trend in the near future.
News supporting the rise of XAUUSD:
FOMC Minutes: A dovish stance from the FOMC weakens the USD, creating favorable conditions for gold to continue rising.
Initial Jobless Claims: Data showing higher-than-expected claims indicates a weaker economy, prompting the Fed to maintain its accommodative policy, which supports gold.
PMI: Weaker PMI data signals a slowdown in production, continuing to weaken the USD and supporting gold's upward trend.
Technical Analysis:
The XAUUSD chart shows gold making a strong recovery from the support at 3,334 USD, with resistance near 3,370 USD. If gold holds above the support level, the likelihood of further gains is very high. The current pattern indicates a sustainable bullish structure with higher highs and lows.
With the alignment of both fundamental and technical factors, XAUUSD is likely to continue rising towards higher targets. The resistance at 3,370 USD is the next level to watch.

Gold breaks downtrend channel, next target lower!Gold is currently trading within a clear downtrend channel, marked by lower highs and lower lows. After multiple rejections at the upper boundary of the channel, gold has begun its downward trend towards key support levels.
From a technical standpoint, the recent pullback and structural breakdown indicate that the market may continue its bearish trend. Last week's PPI data showed a 0.9% increase , exceeding expectations, which has strengthened the USD and added pressure on gold. This news reduces expectations for aggressive Fed rate cuts , further strengthening the dollar and diminishing gold's appeal as a safe-haven asset.
Looking at the chart, we can identify key support levels to monitor. The first target is around 3,311.000, with the potential to continue falling to 3,287.800 if price breaks below the near-term support at 3,310.000.
Key Levels:
Resistance: 3,355.700 (Upper boundary of the downtrend channel)
Support: 3,311.000, 3,287.800
Next Target (TP1): 3,311.000
Next Target (TP2): 3,287.800
My Advice:
With the bearish structure on the chart and the pressure from the PPI data, the outlook for gold remains to the downside. I recommend looking for short opportunities near 3,355.700, with stops above resistance and targets at 3,311.000 and 3,287.800.

Effective and Widely Used Trading StrategiesTrend Following Strategy
Definition: Trading according to the market trend, buying when the trend is up and selling when the trend is down.
How to Implement: Use technical analysis tools like Moving Averages (MA), RSI, and MACD to identify the market trend. One simple strategy is to trade long when the price is above the moving average (MA), and trade short when the price is below the MA.
Why it Works: The Forex market often has strong trends, which increases the chances of success.
Reversal Trading Strategy
Definition: Finding trading opportunities when the price shows signs of reversing after a strong trend.
How to Implement: Use indicators like RSI, Stochastic Oscillator, or reversal candlestick patterns (such as Doji, Engulfing) to identify reversal points. When the indicators show overbought or oversold conditions, you can place a sell order (if overbought) or a buy order (if oversold).
Why it Works: The market can reverse sharply after a long trend, offering high-profit opportunities when entering at the right reversal point.
News Trading Strategy
Definition: Trading based on major news events, such as interest rate announcements, GDP reports, or employment data.
How to Implement: You need to monitor economic events such as interest rate announcements, GDP reports, employment data (Non-Farm Payrolls), and inflation indices (CPI) to make trading decisions. Usually, before and after important news, the price will experience significant volatility.
Why it Works: News can cause strong market movements, creating high potential profit opportunities if you predict correctly.
Would you like to learn more about any specific strategy? Please leave a comment below to discuss with us.

BTCUSDT: Holding Support, Waiting for a Breakout to 127,500Bitcoin continues to move within an uptrend structure, with the 112,200 USDT zone acting as a key support, aligning with the ascending trendline. The repeated rebounds from this level indicate that buying pressure remains steady.
On the upside, the 127,500 USDT zone stands as a strong resistance that must be broken to extend the bullish momentum. As the price approaches this area, traders should closely monitor the reaction to determine whether a breakout or a short-term pullback will occur.
Overall, the technical structure still favors the bulls. A sensible strategy is to accumulate during retracements around 112,200 – 114,000, and hold positions for a short-term target at 127,500. If this level is breached, the bullish wave will be further reinforced.

EURUSD: Support About to Break, Bearish Trend Continues!EURUSD is currently trading in a clear downward channel. After failing to break the resistance at 1.17200, the price reversed and is now testing support at 1.16000. If this support is broken, the price may continue to decline towards 1.16297 and 1.15500.
The current market structure shows that selling pressure is dominant. If 1.16000 is broken, the bearish trend will continue. Traders should prepare to enter a sell position if this support level is broken, with targets towards lower support levels.

XAUUSD Gold Trading Strategy August 19, 2025XAUUSD Gold Trading Strategy August 19, 2025:
Gold's range remains narrow, closely monitoring the progress of ceasefire negotiations in Ukraine.
Basic news: Yesterday, August 18, according to Rueter, US President Donald Trump told Ukrainian President Zelenskiy that the United States will support Ukraine's security in any agreement to end Russia's war in Ukraine. Gold reacted quite mildly when no message of real weight was released, and market sentiment was still very hesitant, currently spot gold is trading around $3,335/oz, equivalent to an increase of about $2 on the day.
Technical analysis: Yesterday's bullish pattern of gold is still maintained when gold prices approach our Plan 1 area and increase again. However, the increase is not strong, it is very likely that today the gold price will still maintain a slight fluctuation in the area of 3325 - 3350. When the gold price breaks the pattern, it will fluctuate very strongly, we will continue to wait to buy mainly in the area around 3300.
Important price zones today: 3325 - 3330, 3300 - 3305 and 3345 - 3350.
Today's trading trend: BUY.
Recommended orders:
Plan 1: BUY XAUUSD zone 3328 - 3330
SL 3325
TP 3333 - 3340 - 3360 - 3390.
Plan 2: BUY XAUUSD zone 3300 - 3302
SL 3297
TP 3305 - 3315 - 3335 - 3370.
Plan 3: SELL STOP XAUUSD zone 3320 - 3322
SL 3325
TP 3317 - 3307 - 3300.
Wish you a safe, successful and profitable trading day.🌟🌟🌟🌟🌟

XAUUSD: Support Broken? Bearish Trend Continues!XAUUSD is currently trading in a clear downward channel on the H4 timeframe . After failing to break the resistance at 3,360 , the price reversed and is now testing the important support level at 3,320 . This support level has been tested multiple times in the past weeks. If this support is broken, the bearish trend could continue, with the next targets at 3,300 and 3,280.
The market structure remains weak, with lower highs and lower lows , confirming that the selling pressure is dominant. If the price fails to hold the 3,320 support level, the likelihood of further declines towards lower support levels is very high. It’s crucial to closely monitor price action at these support levels.
Stay tuned to market developments and prepare your trading strategy accordingly, as everything is shifting towards a stronger bearish move !

Gold Update: Range Trading with Bearish UndertoneAfter last week decline,gold has entered a consolidation phase within a well-defined range. The current support is at around 3330, which coincides with last week's low and also serves as the monthly pivot point, providing a strong foundation for short term. On the upside, resistance is at 3350-3355, which aligns with the current week's pivot level, creating a ceiling that sellers are defending.
The price action within this tight range suggests that market participants are taking a breather after the recent selling pressure, with both bulls and bears showing restraint as they assess the next move. The way gold is trading within these boundaries gives the impression that energy is building up, much like a coiled spring ready to release. This type of consolidation pattern often precedes a significant directional move, as market forces accumulate before choosing their next path.
The technical setup indicates that we're likely approaching a critical range where gold will need to make a decisive break either above or below this range. A breakout above the 3350-3355 resistance zone could signal renewed bullish momentum and attract fresh buying interest, while a breakdown below the 3330 support level might open the door for further downside pressure.Looking at the weekly and daily price action, the bears seem to have the upper hand in the current scenario. The recent decline from higher levels has created a bearish tone, and importantly, we haven't seen any major reversal signals that would suggest a strong buying opportunity at these current range levels

XAUUSD Gold Trading Strategy August 18, 2025XAUUSD Gold Trading Strategy August 18, 2025:
Gold prices fell 1.79% last week, although Trump and Putin failed to reach an agreement on the key issue, with the focus this week on the Jackson Hole conference.
Basic news: Gold traders are closely watching the developments of the meeting between US President Donald Trump and his Ukrainian counterpart Zelensky today to set the terms of a potential peace deal that Trump agreed with Putin in Alaska on Friday. CME's "Fed Watch" report released today, the probability of the Fed keeping interest rates unchanged in September is 15.4%, and the probability of a 25 basis point rate cut is 84.6%.
Technical analysis: Gold prices have rebounded after approaching the support zone of 3325 - 3330. Currently, the bullish pattern of gold prices has not been broken, the possibility of gold prices having a strong increase in the near future. RSI on H1 and H4 frames is showing signs of entering the buying zone, combined with MA tending to expand after the previous sideways movement. Liquidity zones such as 3375 - 3380 and 3395 - 3400 could be profit-taking zones for this growth.
Important price zones today: 3325 - 3330 and 3300 - 3305.
Today's trading trend: BUY.
Recommended orders:
Plan 1: BUY XAUUSD zone 3326 - 3328
SL 3323
TP 3331 - 3340 - 3360 - 3390.
Plan 2: BUY XAUUSD zone 3300 - 3302
SL 3297
TP 3305 - 3315 - 3335 - 3365 - Open.
Plan 3: SELL STOP XAUUSD zone 3320 - 3322
SL 3325
TP 3317 - 3310 - 3305 - 3300.
Wish you a new week of safe, successful and profitable trading.🥰🥰🥰🥰🥰

EURUSD: Bearish OutlookFrom the chart, EURUSD is currently trading in an ascending price channel, but signs of a pullback have emerged from the 1.17300 level, suggesting a potential continuation of the decline in the short term. Recent economic data, particularly the PPI index from the U.S., has put significant pressure on the EUR, strengthening the USD and weakening the Euro. This may continue to maintain bearish pressure on EURUSD.
Technically, the key support level to watch is 1.16264. If this level breaks, EURUSD could continue to decline towards lower support levels such as 1.16000. Bearish signals from technical indicators also support this pullback.
Trading Strategy:
Sell: Wait for a break below 1.16264 to enter a short position, with the next target at 1.16000.
Stop-loss: Set a stop-loss above the resistance at 1.17300 to protect the account in case of a reversal.

XAUUSD Continues Bearish Trend, Testing Key SupportGold is currently trading around 3,335 USD, closing near an important support zone, as highlighted in the chart. The precious metal continues its bearish trend, pressured by the 0.9% increase in the U.S. Producer Price Index (PPI) for July. This indicates persistent inflationary pressure, reinforcing the Fed's stance on maintaining high interest rates, which weakens gold's appeal.
Technical Levels:
The current price is approaching a key support zone between 3,328 USD – 3,273 USD, where a potential bounce could occur if price action confirms a reversal.
The trend remains bearish as long as the price stays below the 3,370 USD resistance, consistent with the pattern of lower highs and lower lows.
A break below the 3,328 USD support could trigger further downside, with the next target at 3,273 USD.
Conclusion:
With the PPI data adding pressure, and the price nearing a crucial support zone, the outlook remains bearish for gold. Traders should monitor price action at the support levels for potential sell opportunities.

XAUUSD – Gold under pressure after US retail sales and UoM dataHello traders, today let’s take a look at the XAUUSD chart following the latest news and clear technical signals.
On the H4 timeframe, price is moving within a descending wedge pattern, with multiple rejections at the trendline resistance (red arrows). The 3,346 – 3,373 USD area is acting as the main resistance, while the nearest support is around 3,310 USD. The current market structure leans bearish, with lower highs forming and buying momentum fading.
From a news perspective, Core Retail Sales m/m came in at 0.3% (below the 0.5% forecast), indicating weaker consumer spending. However, UoM Consumer Sentiment rose to 61.9 and inflation expectations surged to 4.5%, leading the market to believe the Fed will keep interest rates higher for longer — strengthening the USD and putting pressure on gold.
If price continues to be rejected around 3,346 – 3,373 USD, XAUUSD is likely to break below 3,310 USD and move toward the deeper support area near 3,285 USD.
A suggested strategy is to prioritize SELL setups if price retests 3,346 – 3,373 USD with strong rejection signals, place stop-loss above 3,380 USD, and target profits around 3,310 and 3,285 USD.
Do you think gold will break 3,310 USD in this move, or will it make one more pullback before heading lower?

EURUSD – Continuing the Uptrend, New Targets AheadEURUSD is experiencing a strong recovery after testing the 1.16600 support level. The chart shows price moving within an ascending channel, continuing to form higher highs and higher lows, with the near-term target at 1.18000 and further at 1.18600. Buying pressure has returned as the price failed to break below the 1.16600 support, driving the uptrend momentum.
In terms of news, although U.S. Core Retail Sales came in weaker than expected (0.3% vs 0.5%), indicating slower consumer spending, this provides an opportunity for EURUSD to rise. However, the overall sentiment remains tilted toward a weaker USD, which supports the uptrend for EURUSD.
If price continues to hold above 1.16600 and breaks through 1.18000, EURUSD could continue its upward momentum towards higher levels. However, if the price breaks the 1.16600 support, the uptrend will be at risk.

XAUUSD consolidates, awaiting a reboundFollowing last night’s US PPI data coming in higher than expected (0.2% vs. 0.0%), XAUUSD faced strong selling pressure as markets priced in expectations that the Fed will keep interest rates higher for longer. This boosted the US Dollar and Treasury yields, pushing gold down to around 3,346 USD.
Technically, price is still moving within a wide sideways range between 3,284 and 3,450 USD, but the short-term trend remains capped by a descending trendline from recent highs. The 3,346 USD zone is acting as a trendline touchpoint, potentially leading to a sideways accumulation around 3,312 – 3,346 before a mild rebound.
If the 3,284 USD support holds, the probability of a technical bounce toward 3,346 – 3,379 USD is high, especially as buyers may use the range’s lower boundary to accumulate positions. Conversely, a break below 3,284 USD could trigger stronger selling pressure toward 3,254 USD.

Gold Trading Strategy XAUUSD August 14, 2025Gold Trading Strategy XAUUSD August 14, 2025:
Gold prices continued to rise in the European session on August 13, 2025 as mild US inflation data raised expectations of a Federal Reserve rate cut in September, while a weaker US dollar also boosted demand for gold.
Fundamental news: The US labor market report earlier this month initially weighed on the greenback, but the latest US CPI data added pressure as it did not show a clear acceleration in inflation due to tariffs in July. The inflation data reinforced the possibility that the Fed will take a more dovish stance in September, which is what the market is expecting.
Technical analysis: After a deep correction to the 3330 area, gold prices showed signs of increasing again. On the H1 frame, an upward price channel has been formed, but the current MA lines are still moving sideways, not showing a clear trend. The 3350 - 3355 area will be the important area to decide whether this uptrend channel can hold or not. RSI on H1 and H4 timeframes has entered the buy zone, this is a very good condition for us to trade. We will trade at the support zones and large liquidity zones of gold prices.
Important price zones today: 3350 - 3355, 3335 - 3340.
Today's trading trend: BUY.
Recommended orders:
Plan 1: BUY XAUUSD zone 3350 - 3352
SL 3347
TP 3355 - 3365 - 3375 - 3390.
Plan 2: BUY XAUUSD zone 3335 - 3337
SL 3332
TP 3340 - 3350 - 3370 - 3390.
Plan 3: SELL XAUUSD zone 3388 - 3390
SL 3393
TP 3385 - 3375 - 3365 - 3355 (small volume).
Wish you a safe, successful and profitable trading day.🥰🥰🥰🥰🥰

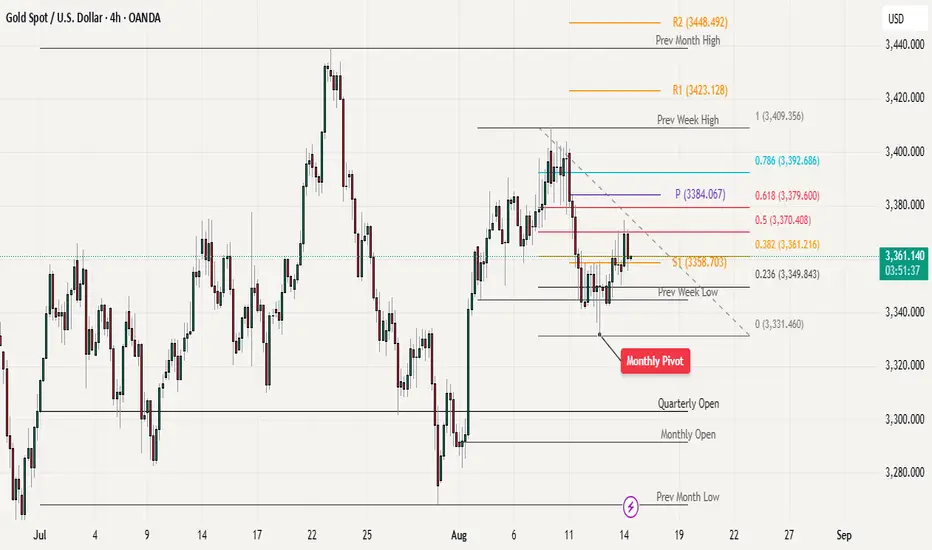
Gold Recovery Stalls at Fibonacci Resistance - Key Levels to WatWe have seen a strong recovery from the monthly pivot point, which acted as solid support. However, the price is now facing significant resistance in the Fibonacci golden zone between 3,370-3,379, based on the recent decline from 3,409 to 3,331. This resistance level presents the main challenge for bulls at this point.
For the bullish momentum to continue, buyers need to push the price above 3,379, which would confirm the upward trend and signal further strength. The positive sign is that gold has been holding steady above the 3,350 level, showing some underlying support at this price point.
Looking at key levels to watch, 3,350 serves as the immediate support level . If this level fails to hold, the next major support comes in at 3,331. A breakdown below these support levels could trigger further selling pressure and lead to additional declines in gold price.
Gold Trading Strategy XAUUSD August 13, 2025Gold Trading Strategy XAUUSD August 13, 2025:
Gold prices recovered slightly, currently trading around $3,351/oz, positive US inflation data for July has reinforced market expectations that the US Federal Reserve (FED) will cut interest rates in September, while a weaker US dollar has boosted gold's appeal.
Fundamental news: Data from the US Bureau of Labor Statistics showed that the Consumer Price Index (CPI) increased 2.7% year-on-year in July, lower than the expected 2.8% and unchanged from June. Core CPI increased 3.1% year-on-year and 0.3% month-on-month, the largest increase in six months.
Technical analysis: The sideways range of 3,340 - 3,360 has not been broken yet. The MAs are showing signs of moving sideways, showing the tug-of-war between buyers and sellers. RSI H1 has started to move towards the buy zone, RSI H4 is heading towards the average line. There is a high possibility that gold price will have a correction according to RSI of H4 and increase strongly again.
Important price zones today: 3340 - 3345, 3365 - 3370 and 3385 - 3390.
Today's trading trend: SELL.
Recommended orders:
Plan 1: SELL XAUUSD zone 3367 - 3369
SL 3372
TP 3364 - 3355 - 3345.
Plan 2: SELL XAUUSD zone 3387 - 3389
SL 3392
TP 3384 - 3374 - 3364 - 3345.
Plan 3: BUY XAUUSD zone 3340 - 3342
SL 3337
TP 3345 - 3355 - 3365 - 3385 - OPEN.
Wish you a safe, successful and profitable trading day.💗💗💗💗💗
