Gold at a Crossroads: Up or Down?If we zoom in and carefully observe how the GOLD price is moving, it becomes immediately clear:
The market has just shown a very strong upward impulse, but now something interesting is happening. The price is tightening and forming a small, narrow triangle, which indicates that the market is accumulating energy. In these situations, there are usually two possible directions, but given the clearly bullish context, I feel that a breakout to the upside is much more likely.
What do you think? Do you agree with me?
Leave your thoughts in the comments. And trust me, being part of the TradingView community will help you improve every day as a trader.
Of course, this is not financial advice, just my personal view on the chart.
M-forex

BTC strong down trend and high RnR sell scenario..BTC is in strong down trend and broke ~ 90K level and targeting further downside levels of 82K and 75K. Price is continuously forming lower highs and BoS. Price has formed a BOS on hourly chart and approaching 1h FVG. We may expect a rejection pattern in LTF inside FVG and further downfall.
1. Price is in strong down trend and formed 1H FVG after creating BOS.
2. FVG is formed on weekly quadrant level, making it more significant,
3. Price is now approaching FVG
4. Most probably price will take liquidity of FVG/RDRB level and create MSS/CISD/TS/iFVG in LTF.
5. Price should show rejection/reversal in respective LTF (5m/15m) at FVG zone.
6. Take the trade only once clear entry model i.e. turtle soup. iFVG break, CDS or MSS happens on LTF
All these combinations are signalling a high probability and ~8R trade scenario.
Note – if you liked this analysis, please boost the idea so that other can also get benefit of it.
Also follow me for notification for incoming ideas.
Also Feel free to comment if you have any input to share.
Join me on live stream for real time update.
Disclaimer: This analysis is for educational purposes only and does not constitute investment advice. Please do your own research (DYOR) and check with your financial advisor before making any trading decisions.

The Gold Bullish Setup You Can't Miss!OANDA:XAUUSD The price is clearly approaching a critical support zone, one that has previously triggered positive reactions in the market. This zone also aligns closely with the psychological level of $4,000, which tends to capture the market’s full attention.
Given the current momentum, there’s a strong possibility that buyers will step in and push prices higher. A confirmation, such as a solid rejection pattern, a bullish engulfing candle, or a long lower shadow, would significantly increase the likelihood of a rebound. If my analysis proves accurate, and buyers regain control, we could see the price rise to around $4,070.
However, if the price breaks below this key support, it would negate the bullish outlook and could lead to further declines.
Please note, this is not financial advice!

Brian here with the gold outlook for November 20thGood morning everyone, Brian here with the gold outlook for November 20th. The ABC correction phase of gold is nearly complete, and the market is preparing to enter a new wave phase amidst a flurry of USD data today.
Fundamental Analysis
Today's focus remains on the US labor data: NFP (or revisions), Unemployment Rate, and Initial Jobless Claims.
If the data shows a cooling labor market, expectations for the Fed to soon pivot to a rate-cutting cycle will rise, weakening real yields, putting pressure on the USD, and supporting gold prices.
Conversely, "too good" data will strengthen the dollar, allowing for a short-term repricing move, potentially dragging gold down to lower liquidity zones before recovering.
US session liquidity may be thin before the news release, making it prone to spikes due to algorithms and large flows simultaneously adjusting positions.
Overall, the macro backdrop still favors "buying the dip" for gold, but you must accept strong volatility around news time.
Technical Analysis
On the chart, gold has completed an ABC corrective wave within a descending channel, part of a larger uptrend.
The current descending channel only serves as a corrective leg after the previous upward wave; prices are trading above the "mean" area of the bullish structure, indicating the larger market structure remains bullish.
Below is the liquidity zone / demand zone 4013–4015, coinciding with the previous low and the lower channel boundary – if there's another stop-hunt to this area, it is still considered an opportunity to join the upward move, as long as 4008 is not breached.
Above, the 4086–4100 cluster is the decision zone: breaking and holding above here will confirm exiting the corrective channel, triggering an impulsive leg towards resistances 4132–4146 and further to 4187.
In summary, the main bias remains bullish, prioritizing buy strategies at support zones or after breakout confirmation.
Key Price Levels
Resistance: 4086 – 4100 – 4110 – 4132 – 4146
Support: 4040 – 4030 – 4015
Trading Scenarios
Buy Scenario 1 – Continuation Breakout
Entry: 4086
SL: 4078
TP: 4100 – 4120 – 4140
Prioritize when price breaks up and retests 4086–4100 as a new support zone, confirming exit from the descending channel.
Buy Scenario 2 – Deep Liquidity Sweep
Entry: 4015–4013
SL: 4008
TP: 4030 – 4045 – 4070
Watch for strong price reactions at the demand zone, with pin bars or engulfing candles signaling order flow returning to buyers.
Sell Scenario – Sell Reaction at Strong Resistance
Entry: 4144–4146
SL: 4151
TP: 4132 – 4120 – 4100
Short-term sell strategy, leveraging the high supply zone if price rises straight up without sufficient accumulation.
The medium-term upside target if the bullish wave develops as expected remains the 4187 area.
What do you think of this scenario? Remember to follow Brian for daily gold insights and comment your views below to join the discussion.

Gold Current Price Action Structure Looking weak under 6 and 8||
Support at 7 and 9, more correction under these POI.//
to go bullish need to claim /breakout on 6//
major support / Demand at 4 and 5//
Overall sentiments as per structure is correction /bearish for short term .
Cup and Handle Detected: A Bullish Outlook for XAUUSDOANDA:XAUUSD is forming a very clear Cup and Handle pattern. Price previously dropped toward the 4000 region, rounded out, and then climbed back toward 4080, completing the cup structure. At the moment, the market is making a mild pullback and shaping a tight and well controlled handle.
If price can break this resistance with strong momentum, the next target I expect is around 4150. Until a confirmed breakout appears, patience remains essential. No breakout means no trade.
This is a classic bullish formation, and market expectations are gradually strengthening.

XAUUSD: Likely continuation following pullbackXAUUSD has surged into a strong uptrend, and I predict that this momentum will continue, with a potential target around 4,150, as shown on my chart.
The current price level may be a critical turning point. Here, the price could find support and continue to rise, or if it breaks below, we might see an extension of the downward trend.
If I had to choose a direction, I would lean towards more upside, but the final decision should be based on price action to determine the next move.
However, if the price breaks decisively below the trendline, it would invalidate the bullish scenario, indicating that the uptrend could pause or even reverse in the short term.
These are just my personal views based on chart analysis, not financial advice. Always verify your setups and manage your risk carefully.

XAUUSD | Bulls Hold Control Above 4070 - Eyes on 4090–4100 ZoneGold (XAUUSD) continues to show strong bullish structure, and price action above the 4070 key support reinforces buyers’ dominance.
If price sustains above this level, the next upside liquidity area sits at 4090–4100 , a zone where previous reactions have occurred.
Bullish Scenario:
Holding above 4070 keeps momentum pointed toward 4082 and then the 4090 zone.
The bullish outlook remains valid as long as price stays above 4059, which currently acts as intraday invalidation.
What I’m Watching:
A clean intraday consolidation above 4070
Momentum strength into 4082
Whether buyers can break into the 4090–4100 resistance pocket
This setup highlights how the market could behave, not financial advice—just educational analysis.
📌 Disclaimer:
This analysis is for educational purposes only and is not financial advice. Always manage risk and follow your trading plan.
Your feedback drives our content and keeps everyone trading smarter. Let’s make those pips together! 🚀
Happy Trading,
– The InvestPro Team

BTC Swing 8R reversal scenario....BTC moved as per our plan throughout last 10-15 days and crashed to ~ 90K levels, now it has reached to its critical level of reversal, which is weekly FVG CE area. Price has already shown change in delivery at 4H level. All these making it a really good contender for a long swing trade which may even lead to all time high.
1. Price has tested CE of weekly strong FVG and formed CISD at 4-hour level.
2. Now it is testing CISD imbalance area to form proper entry model…
3. We may wait for MSS to occur in this area in 15 minutes for more precise entries.
4. Most probably price will take liquidity of FVG/RDRB level and create MSS/CISD/TS/iFVG in LTF.
5. Price should show rejection/reversal in respective LTF (5m/15m) at FVG zone.
6. Take the trade only once clear entry model i.e. turtle soup. iFVG break, CDS or MSS happens on LTF
All these combinations are signalling a high probability and ~8R trade scenario.
Note – if you liked this analysis, please boost the idea so that other can also get benefit of it.
Also follow me for notification for incoming ideas.
Also Feel free to comment if you have any input to share.
Join me on live stream for real time update.
Disclaimer: This analysis is for educational purposes only and does not constitute investment advice. Please do your own research (DYOR) and check with your financial advisor before making any trading decisions.

XAUUSD Double Bull Flag — Danger AheadHello my dear traders, Laura here.
This week, the market has been extremely tense, and the price action reflects it well.
As I mentioned before, we are currently seeing the formation of a large bull flag. Just above it, a smaller flag is developing, and this smaller structure is the key trigger for any potential continuation. The bullish outlook remains valid only if this smaller flag breaks cleanly.
The recent pullback dipped deeper than expected, which signals hesitation from buyers. When confidence fades, even a promising breakout can turn into a sweet trap that lifts briefly before falling sharply.
Because of this, patience becomes essential. Before entering, we need a clear and decisive breakout that confirms strength. Specifically, we should look for a candle that breaks through resistance with firmness and clarity. If such a confirmation appears, the path toward the 4,300 level becomes structurally supported.
On the other hand, if the price falls below the lower trendline, the bullish scenario is invalidated immediately. At that point, the setup no longer holds and should not be traded.
For now, the principle is straightforward.
No breakout means no entry. Stay disciplined and avoid letting the market pull you into unnecessary risk.

XAUUSD: Continuing Uptrend with Potential Expansion to $4,280OANDA:XAUUSD has shown strong performance in the ascending channel, and I expect this trend to continue as shown in my chart, with a target price of $4,280.
The current area represents a key turning point, where prices could find support allowing them to rise, or they may break down, which could lead to a further downward movement.
If I were to choose the most likely direction, I would lean towards upward price movement. However, only market action will determine whether the channel will continue or not.
If the downtrend line is breached strongly, it will invalidate the bullish scenario, meaning that the bullish momentum could weaken or even reverse in the short term.
These are just my personal forecasts based on technical analysis, and they do not represent financial advice. Always make sure to verify your setups and manage risks wisely.
Wishing you successful and profitable trading!

EUR/USD – Growth Opportunity After Positive DataThe EUR/USD pair is currently trading around 1.1612, up by 0.2% ahead of the September industrial production data from the Eurozone. This data is expected to show a 0.7% recovery for the month, following a sharp 1.2% decline the previous month. This is a positive signal for the Euro and could create a strong growth opportunity for EUR/USD.
Technical Analysis: The chart shows that EUR/USD is attempting to break the 1.16500 level, which indicates a test towards 1.16800 in the short term. If the pair continues to maintain this trend, it may break through strong resistance and target 1.17000. However, this may require additional support factors, such as weak data from the U.S. or more positive macroeconomic signals for the Euro.
Conclusion: With the factors from industrial production data and technical signals , I believe EUR/USD has the potential to continue increasing in the short term, but further confirmation from economic data is needed for a stronger breakout. If the price holds above 1.160 and breaks resistance, 1.170 will be the next realistic target.

$Gold: Breakdown or Bounce?🔻 #Gold Breakdown or Bounce? 🔺
Price tested a critical level (upward sloping trendline - Breakdown Retest ) after a bearish engulfing and is now pulling back. Will the breakdown continue, or can bulls reclaim control? 👀
Trendline break 🚨
Breakdown retest ⚠️
Key levels to watch:
🚧 Resistance: $4099.40 - $4126.08 / $4185.91 - $4195.21 / $4355.80 - $4381.44
🛡 Support: $4024.53 / $3932.10 - $3930.62 / $3953.00
Below $3953 → opens downside toward $3500.20–$3432.84 📉
Between ATH & $3953 → market likely stays trendless/choppy ⚖️
TVC:GOLD #Gold #XAUUSD #Forex #BearishEngulfing #CandleStickPatterns #BreakdownRetest #BearishReversal #PriceAction #ForexTrading
📌 #Disclaimer: This analysis is shared for educational purposes only. It is not a buy/sell recommendation. Please do your own research before making any trading decisions.

Gold Maintains Bullish Structure Despite 4245 Rejection We have seen a sharp rejection from the 4245 level yesterday, forming a red candle . However,. Gold found solid support at the weekly R3 level around 4147 and managed to close above it, which is a significant technical development. Currently, we're witnessing a strong recovery rally on lower tf that suggests the bulls aren't ready to give up just yet.
When we zoom in to the daily timeframe, yesterday's downward move appears to be just a normal bearish candle rather than a trend reversal signal. The key factor supporting this view is that price was trading well above the weekly R3 level throughout the session. In a healthy uptrend, these kinds of pullbacks are quite normal and often provide opportunities for fresh entries. The overall bullish structure on the daily chart remains intact, which gives me confidence that this isn't the beginning of a major correction.
Looking at the current setup, the first critical support level at 4140-4150. This zone has proven its importance multiple times, and as long as price holds above this area, I'm maintaining a bullish bias. A daily close below 4140-4150 would be the first warning sign that we might be heading back into consolidation territory. That scenario would require a reassessment of the trend direction.
However, if gold continues to respect the 4140-4150 support zone and builds on today's recovery momentum, we could see price pushing toward higher levels in the coming sessions. The bulls have shown their presence at key support areas, and with the daily structure still favoring upside, the path of least resistance appears to be upward for now.

XAUUSD – When the Market Starts to “Smell” a Bullish MoveLooking at the current price action, it’s quite clear that gold is entering a new bullish phase supported by both fundamental catalysts and smart money flow . With the U.S. government preparing to reopen and key economic data returning, investors are increasing their bets on the possibility that the Fed may cut interest rates next month . In a climate where political and economic uncertainty is still lingering, gold naturally becomes a preferred safe-haven asset.
On the chart, XAUUSD is maintaining a clean and steady uptrend , consistently bouncing from the trendline and forming higher highs and higher lows. These precise retests show that buyers are firmly in control . Price is now moving towards the 4,300 zone, where some short-term volatility may appear before heading further into the 4,380 resistance.
As long as gold holds above the trendline support , the market can continue its bullish momentum in the coming sessions. Every pullback at this stage acts like a fresh boost , giving buyers more strength to push the market higher.

USDJPY Vulnerable to Deep Pullback After Wave 5USDJPY has completed a full 5-wave rising structure inside a clear wedge pattern, which usually signals exhaustion. The final Wave (5) shows weakening momentum, and price is beginning to slip below the wedge support — an early sign that the trend may be reversing. This suggests the pair is likely entering a deeper corrective decline, potentially retracing toward 150 or lower in an impulsive A-B-C move. In simple terms: uptrend looks tired → wedge breakdown could trigger a strong downside correction.
Stay tuned!
@Money_Dictators
Thank you :)

Gold Holds Firm Near $4,180 as Markets Await Fed Signal Gold prices are holding steady around $4,184 per ounce, maintaining strong momentum after last week’s sharp rebound of nearly $250 from the $3,930 low. On the 4-hour chart, the uptrend remains intact with multiple Fair Value Gaps acting as key support zones. The nearest support is seen between $4,150–4,120, while resistance lies at $4,220–4,260.
According to Kitco and Reuters, the rally is largely supported by growing expectations that the Federal Reserve may cut rates in December, amid signs of a cooling U.S. economy. The reopening of the U.S. government after a 35-day shutdown means crucial data such as CPI, NFP, and GDP will soon be released — which could reinforce the market’s belief that a dovish shift is near.
Adding to the intrigue, the U.S. Supreme Court is set to review former President Donald Trump’s authority to dismiss Fed Governor Lisa Cook in early 2026. Analysts warn that if this threatens the Fed’s independence, it could trigger a sharp decline in the U.S. dollar and push gold up by as much as $500 per ounce.
Meanwhile, UBS forecasts global gold demand in 2025 could reach its highest level since 2011, as central banks continue increasing reserves. Heightened geopolitical risks — including the upcoming U.S. election in 2026, the Middle East conflict, and renewed U.S.–China trade tensions — are further strengthening gold’s appeal as a safe haven.
In the near term, gold could correct slightly towards $4,150–4,120 before resuming its advance towards $4,260. A decisive break above that level could open the path to $4,300–4,340. With a weakening dollar, potential rate cuts, and global uncertainty, gold appears well-positioned for the next medium-term bullish cycle.

GBPJPY SHORT 1H TIME FRAME I am sitting in short of GBPJPY on 1H Time frame
Logic :- i can clearly see a good rejection with huge volumes from resistance and buyers are trapped, Sellers are gaining control so i am going for 1:2/3.
Let’s see one can take with proper SL gand targets given ✅
Trust the process 🚀, A lot more to come
Thank you guys, Like and comment for more uploads
LiamTrading – XAUUSD H2 | USD strengthens again, gold ...LiamTrading – XAUUSD H2 | USD strengthens again, gold consolidates in an upward channel; await correction to 4090/4041 – break 4145 to confirm further rise
Quick context: USD recovery causes gold to move sideways during the Asian session. Price is moving within an upward channel, hitting the upper trendline and reacting around 4100, not forming a lower low yet. To confirm the continuation of the uptrend, a break of 4145 is needed; otherwise, prioritise the technical correction scenario towards liquidity zones.
Technical Analysis (Volume Profile • Trendline • S/R • Fibonacci)
Channel & Trendline: Channel top coincides with 4135–4145 → likely to see profit-taking pressure. Holding the lower edge of the channel ~4085–4090 keeps the upward structure valid.
Liquidity & FVG:
Liquidity 4090: price pull/volume attraction zone before choosing direction.
Fibonacci Retracement + old resistance ~4041–4043: strong confluence for a bounce if deep correction occurs.
Main resistance: 4130–4135 (retest of channel top), 4145 (pivot confirming rise), 4200 (sell scalp area if clear rejection appears).
Main support: 4084–4086 (channel edge/liq), 4041–4043 (Fib + S/R), deeper 4020 is a defensive point for buyers.
Trading Scenarios (optimised for mobile reading)
Scenario 1 – Buy shallow pullback (trend-following priority)
Entry: 4084–4086
SL: 4078
TP: 4098 → 4112 → 4135 → 4160
Suggestion: Wait for rejection candle at 4090 or M15 reversal signal before entry.
Scenario 2 – Buy deep (Fib + S/R)
Entry: 4041–4043
SL: 4036
TP: 4056 → 4072 → 4095 → 4120
Suggestion: Prioritise when price fills the gap and leaves a clear lower wick.
Scenario 3 – Sell scalp at resistance (counter-trend)
Entry: 4130–4132
SL: 4138
TP: 4112 → 4100 → 4088 → 4060
Note: Quick scalp only; abandon if H1/H2 closes strongly above 4145.
Bonus – Sell scalp 4200
Condition: Clear rejection on smaller timeframe.
SL: above the nearest recent high.
Reference TP: 4185 → 4166 → 4145.
Risk Management & Invalidation
Short-term bullish bias remains valid if price holds above 4085–4090.
H2 closes above 4145 → prioritise buying on breakout, limit all sell orders.
H2 closes below 4036 → risk of deeper test around 4020.
Risk per trade 0.5–1%, move SL to breakeven at +1R, do not average against the trend.
Which price zone do you find noteworthy today? Comment below & hit Follow on LiamTrading channel for the earliest updates.

Gold Holding Above 4100$ Market Prepares for Next Wave ExpansionGold continues to sustain momentum above 4,100$, maintaining its bullish market structure as traders price in expectations of a Fed rate cut in December.
While the US Dollar shows brief recovery, the underlying flow still supports safe-haven demand — especially as global risk sentiment remains fragile and the US government moves closer to reopening.
📊 Technical Overview (H1 – MMFLOW Structure)
Price is currently consolidating within the 4,108$–4,113$ liquidity pocket, where prior breakout demand aligns with short-term Fibonacci retracement (0.382–0.5).
This zone continues to attract buy-side liquidity, suggesting accumulation rather than exhaustion.
As long as 4,085$ remains protected, the bias stays bullish toward 4,172$ – 4,203$ (Fibo 1.272–1.618). However, failure to break above 4,172$ may trigger a short-term reaction sell before the next impulsive leg resumes.
🎯 Trading Plan – MMFLOW Setup
🌸 BUY Scenario (Liquidity Retest)
Buy Zone: 4,086 – 4,084
Stop Loss: 4,080
Targets: 4,090 → 4,095 → 4,100 → 4,110 → 4,120 → 4,130 → 4,150+
🔥 SELL Scenario (Short-Term Reaction Zone)
Sell Zone: 4,172 – 4,174
Stop Loss: 4,180
Targets: 4,165 → 4,160 → 4,150 → 4,140 → 4,130 → 4,120
🧠 MMFLOW TRADING Insight:
“Price is language — liquidity is intent. The market is not random; it’s engineered to test conviction before expansion.”
Bias remains bullish above 4,085$ – any dip into the liquidity base could offer the last accumulation before the next breakout.

XAUUSD / GOLD Analysis – Buy Opportunity Ahead!Gold has formed a strong double-bottom support zone at 4095 – 4090, signaling potential bullish momentum. As long as Gold remains above 4080, the bias stays bullish for short-term buyers.
🧭 Trading Plan:
Buy Zone: 4095 – 4090
Stop Loss: Below 4080 (close basis)
Targets: 🎯 4010, 4030, 4040
💡 Technical Reasoning:
Double-bottom pattern confirmation on 1H/4H timeframe
RSI bouncing from oversold area
Price rejecting key support zone multiple times
Potential bullish divergence forming
⚠️ Risk Management:
Always use proper risk-to-reward management and position sizing. Gold can move fast during high volatility sessions — keep your stops tight and targets realistic.
🔔 Conclusion:
If Gold holds above 4080, buyers could dominate the next leg. Watch price action closely near 4095 – 4090 for entry confirmation.

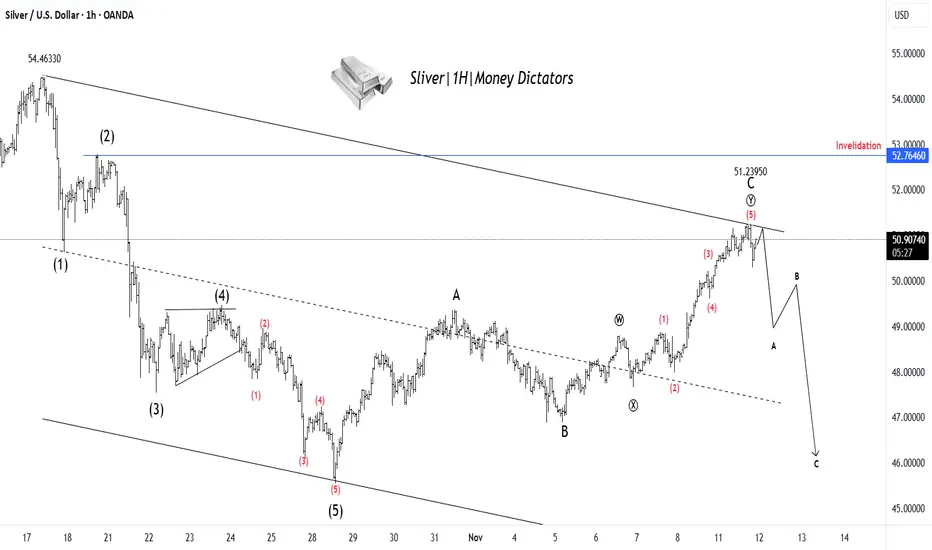
XAG/USD Set for Decline After Finishing Wave YSilver has completed a clear 5-wave upward move, ending near the 51.23 zone, which likely marks the completion of Wave C of the corrective structure. Price action shows rejection from the upper trendline, signaling that buying momentum is fading. This suggests the start of a new A–B–C corrective decline, where Silver could first drop toward 48–47 levels before any temporary bounce. The overall structure remains bearish in the short term unless the price breaks above the 52.76 invalidation zone. In simple terms: rally looks complete → downside correction likely ahead.
Stay tuned!
@Money_Dictators
Thank you :)
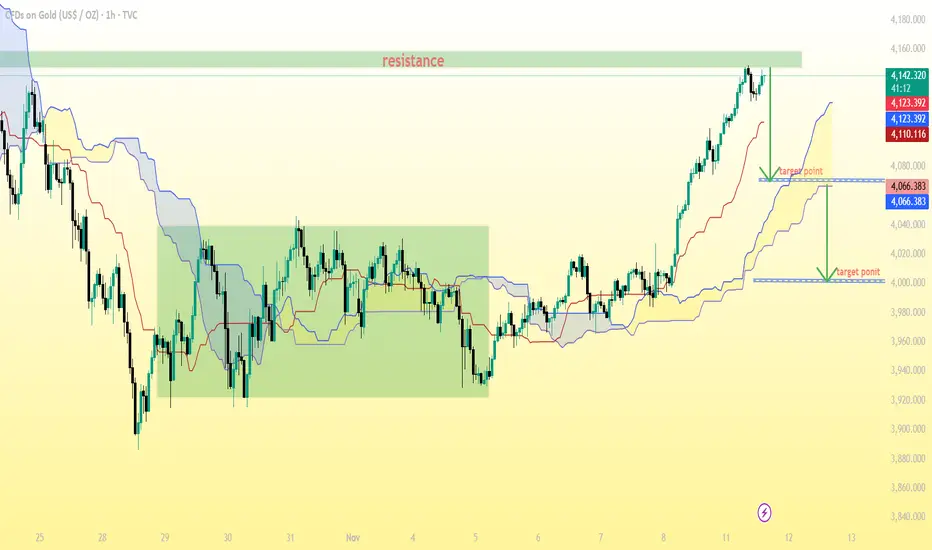
GOLD (XAU/USD) 1-hour chart Pattern..GOLD (XAU/USD) 1-hour chart with Ichimoku Cloud, and my marked resistance and two target points.
Here’s the analysis based on what’s visible:
Current price: Around $4,141 (based on my chart labels).
Resistance zone: Around $4,140 – $4,150, which is where price is currently testing.
Upper target point (minor correction target): Around $4,123 – $4,125.
Lower target point (major correction target): Around $4,066 – $4,070.
📊 Interpretation:
If price fails to break resistance (4,150) and forms rejection candles, it could retrace toward:
Target 1: $4,123 (short-term support)
Target 2: $4,066 (cloud base and major support zone)
If price breaks and holds above 4,150, then the bullish trend can extend further upward, possibly toward $4,180–$4,200.