INDIAN RAILWAY FIN CORP LTDSTOCK OF THE DAY
Stock: Indian Railway Fin Corp L
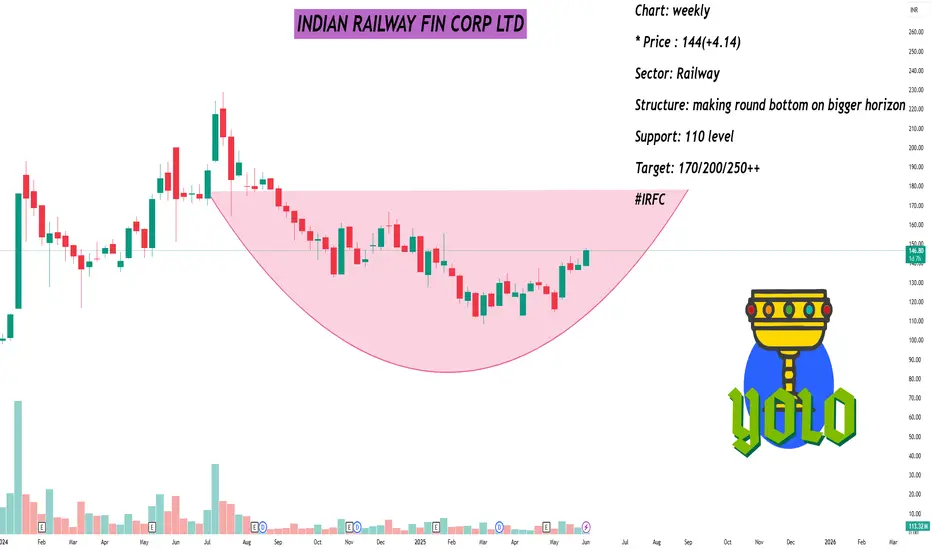
Chart: weekly
* Price : 144(+4.14)
Sector: Railway
Structure: making round bottom on bigger horizon
Support: 110 level
Target: 170/200/250++
#IRFC
M-forex
ICICI BANK LTDStocks to Focus on 5th Jun 2025
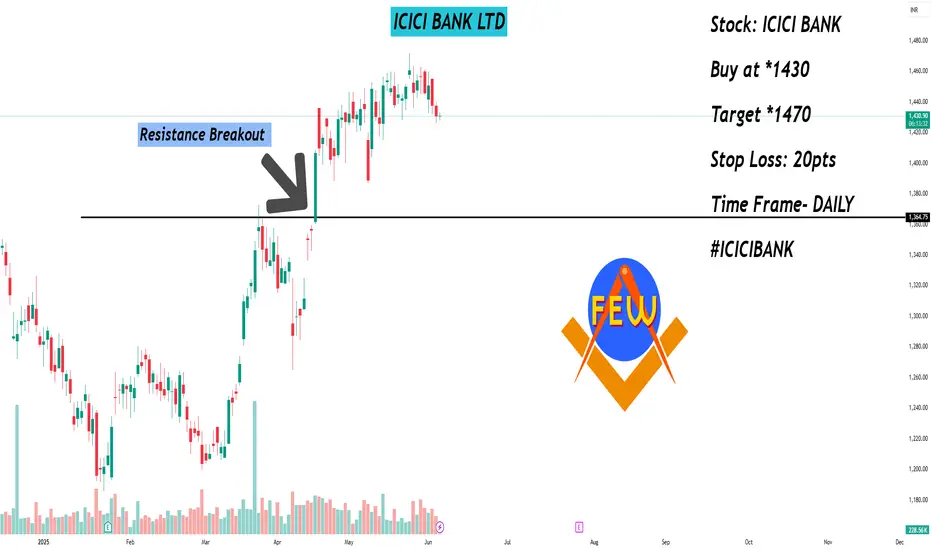
Stock: ICICI BANK
Buy at *1430
Target *1470
Stop Loss: 20pts
Time Frame- DAILY
#ICICIBANK
Silver also looking good from HereThis is the only time frame where I am watching silver as on now (On Monthly )
Chart is self explanatory, All we need a break above 35 , closing above this level can start a much awaited bull run on silver from here.
and if we see good momentum from silver , gold also goig to follow the same in short term to mid term basis.

EURUSD – In a tough spot as USD regains momentumThe sharp rise in ADP and ISM PMI forecasts is shifting market expectations: the Fed is now less likely to cut interest rates soon. This immediately supports the USD recovery and puts pressure on major currency pairs – EURUSD included.
Looking at the H4 chart, we can see price being rejected around the 1.14480 resistance zone, right when the EMA 34 and 89 lines are starting to tighten – a sign that the bullish momentum is fading. At this point, price appears to be heading back toward the 1.13300 support zone, which has held several times before. If this level breaks, the bearish move could extend toward 1.12890.

COMPUTER AGE MNGT SER LTD COMPUTER AGE MNGT SER LTD – 1 Day Support & Resistance (Updated at ₹4713.40)
Stock: Computer Age Management Services Ltd (CAMS)
Time Frame: 1 Day
Latest Price: ₹4713.40
Support Levels:
₹4660 – Minor intraday support
₹4585 – Strong swing support
₹4500 – Major support zone
Resistance Levels:
₹4750 – Immediate resistance
₹4820 – Short-term breakout level
₹4900 – Psychological & technical resistance zone

NIFTY 50 INDEXMajor Levels for Nifty & BankNifty - Jun 5, 2025
#NIFTY50 LTP: 24620 | A *Muted* opening might be today.
Resistances: 24670 & 24730
Supports: 24490 & 24320
#NIFTYBANK LTP: 55676
Resistances: 55825 & 56125
Supports: 55450 & 55300
A Disclaimer: This is for educational purposes only. Please consult a financial advisor before making any trading decisions.

Gold : Looking good so far ...No Change to chart
Support Levels that we have to watch:
Immediate Support : 3345-50(PDL and 50)
Secondary Support : 3330-35
Major Support : 3280-90
Immediate resistance : Current Week High(3390-92)
secondary Resistance : 3440-45
Major Resistance : ATH (3500)

GBPUSD – Stalling at resistance, correction ahead?The market is reacting to a series of strong US economic data, especially the rising expectations for ADP and ISM PMI figures. This has boosted the USD, putting pressure on major currency pairs, including GBPUSD.
Looking at the H4 chart, GBPUSD is trading near the resistance zone around 1.35959 while also testing a long-term descending trendline – a level that has previously rejected price multiple times. Notably, although price is still holding above the EMA 34 and 89 support zone, recent candles reflect clear hesitation, suggesting the pair is “stuck at a crossroads.”
A reasonable technical scenario: if the price continues to be rejected at 1.35959 and breaks below the EMA confluence and support area at 1.34994, a short-term downtrend may resume. The nearest target would be around 1.34530 – a strong technical support that has held up price in the past.

Candlestick Pattern part 2Candlestick patterns are a visual representation of price movement in financial markets, used in technical analysis to identify potential trend reversals or continuations. These patterns are formed by the opening, closing, high, and low prices of a financial instrument over a specific period. They are like signals on a chart that can help traders make informed decisions about buying or selling.

Learn Institutional Level Trading part 6An institutional trading strategy is the buying and selling of financial assets, such as stocks, commodities, currencies, futures, and options by institutions like banks, credit unions, pension funds, hedge funds, mutual funds, and REITs.

Institutional Trading Strategies part 5Institutional traders incorporate strategies that emphasize both long-term value and diversification in their trading practices. They leverage significant amounts of capital to build portfolios diversified across multiple assets, which helps reduce risk while seeking improved market prices.

Gold Stalls Ahead of Key Trade TalksGold Stalls Ahead of Key Trade Talks – Will Price Explode Out of the 3345–3370 Range?
After Monday’s explosive rally, gold is currently consolidating within a tight price range. The market is at a critical juncture, awaiting high-level trade talks between the U.S. and China — an event that could serve as a major catalyst for the next directional move.
🌍 MACRO OUTLOOK & MARKET SENTIMENT
A major trade call between Trump and President Xi Jinping is on the horizon. This conversation could reset global trade expectations and potentially trigger large moves in risk assets.
Last week’s strong U.S. jobs data (NFP) pushed back expectations of Fed rate cuts. Treasury yields remain elevated, which is temporarily capping gold’s upside.
Market sentiment is neutral-to-cautious, with traders waiting for confirmation of a breakout or breakdown before committing capital to new positions.
📈 TECHNICAL ANALYSIS (H1 – EMA 13/34/89/200)
Gold appears to be in a wave 4 correction, consolidating after completing wave 3.
EMAs remain aligned to the upside (bullish), suggesting the broader trend still favors buyers.
Key range:
Above 3370 → breakout confirmation → momentum push toward 3400–3410
Below 3345 → breakdown → fast dip to 3310–3300 to complete wave 4 and initiate wave 5 upward
🧭 STRATEGIC ZONES
🔵 BUY ZONE: 3317 – 3315
Stop Loss: 3310
Take Profits:
3322 → 3326 → 3330 → 3334 → 3338 → 3345 → 3350 → 3360
This zone aligns with a strong FVG + EMA89 support. A bullish reaction here could provide a high-probability entry for the next impulsive leg upward (wave 5).
🔻 SELL ZONE: 3372 – 3374
Stop Loss: 3378
Take Profits:
3368 → 3364 → 3360 → 3356 → 3350 → 3345
3370 is a critical resistance zone. Any rejection at this level with weak momentum or divergence could open a short-term bearish correction back toward 331x levels.
✅ SUMMARY
Gold is trapped in a decision zone between 3345–3370. The market awaits clarity from macro headlines and technical breakout signals. Until then, traders should watch key levels closely, stay patient, and position accordingly based on price action confirmation at strategic zones.

Technical Concept A "technical concept" refers to a specialized idea, principle, or methodology within a particular technical field, like engineering, computer science, or a specific industry. These concepts often involve complex systems, processes, or technologies and may require specific knowledge and terminology. They are frequently used as elements within larger systems or to explain more complex ideas.

XAUUSD – Pullback ahead of potential breakout above 3,433The latest forecasts show that both ADP and ISM PMI data in the US are rising, reflecting a stronger-than-expected economic recovery. This has led the market to scale back expectations of an imminent Fed rate cut. As a result, the dollar is gaining strength, putting short-term downward pressure on gold.
On the H4 chart, XAUUSD is trading within a consolidation range between two key levels: support at 3,346 and resistance at 3,433. Price was recently rejected at the previous high but has not shown any clear reversal signal. The 34 and 89 EMAs are acting as a technical cushion, keeping the broader bullish trend intact.
The scenario to watch: if price continues to stabilize around the 3,346 zone without breaking below, a clean consolidation structure could form. In that case, a breakout above 3,433 would be a confirmation signal for another bullish wave—opening the door to higher targets ahead.

MACD Trading part 2MACD full form: Moving Average Convergence Divergence and is one of the most widely used momentum indicators in technical analysis. Gerald Appel was the creator of this indicator at the end of the 1970s. By computing the distinction between two time period intervals, which are a compilation of historical time series, this indicator is used to define momentum and its directional resilience. MACD uses moving averages of two distinct time intervals (most commonly historical closing prices of securities), and a momentum oscillator line is calculated by deducting the two moving averages, which is also known as 'divergence.'

IDEAFORGE TECHNO LTDSwing Trade Alert
#IDEAFORGE
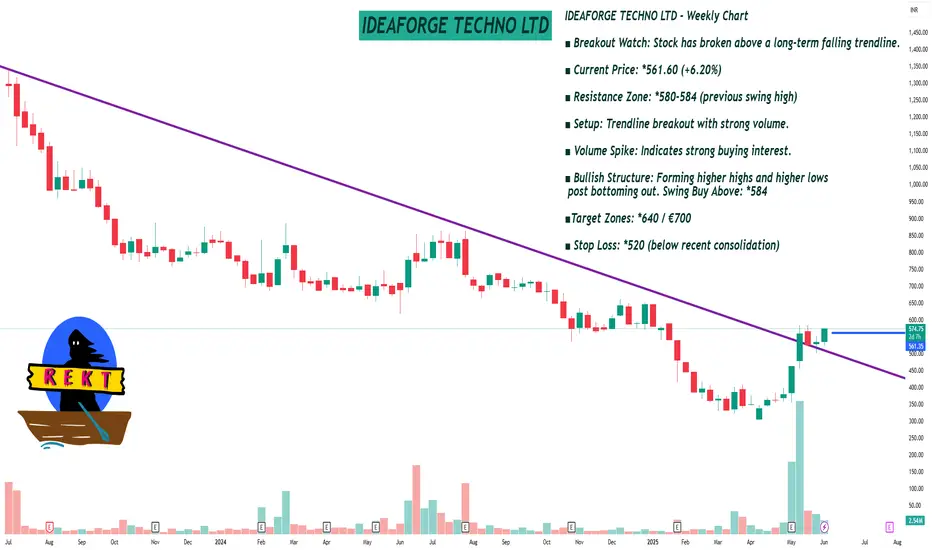
IDEAFORGE TECHNO LTD - Weekly Chart
■ Breakout Watch: Stock has broken above a long-term falling trendline.
■ Current Price: *561.60 (+6.20%)
■ Resistance Zone: *580-584 (previous swing high)
■ Setup: Trendline breakout with strong volume.
■ Volume Spike: Indicates strong buying interest.
■ Bullish Structure: Forming higher highs and higher lows post bottoming out. Swing Buy Above: *584
■Target Zones: *640 / €700
■ Stop Loss: *520 (below recent consolidation)
HINDUSTAN ZINC LTDAs of June 4, 2025, Hindustan Zinc Ltd (NSE: HINDZINC) is trading at ₹468.75, reflecting a 3.44% increase for the day.
📊 Daily Support and Resistance Levels
Based on pivot point analysis:
Central Pivot Point (P): ₹466.93
Support Levels:
S1: ₹459.46
S2: ₹450.18
S3: ₹442.71
Resistance Levels:
R1: ₹476.21
R2: ₹483.68
R3: ₹492.96
These levels are derived from standard pivot point calculations and are commonly used by traders to identify potential support and resistance zones.
📈 Technical Overview
Trend: The stock has demonstrated strong upward momentum, with a 3.44% increase on the day.
Technical Indicators:
RSI (14-day): 62.24, indicating bullish momentum.
MACD: 7.03, suggesting a positive trend.
ADX: 18.90, indicating a developing trend.
Stochastic Oscillator: 78.66, nearing overbought territory.
Supertrend: 426.69, supporting bullish sentiment.
Parabolic SAR (PSAR): 436.97, indicating an upward trend.
Volatility: The stock exhibits moderate volatility, with a beta coefficient of 1.10.
🔍 Additional Insights
Hindustan Zinc Ltd has shown a strong bullish trend in recent sessions. The RSI and MACD indicators suggest continued upward momentum, while the proximity to resistance levels warrants cautious optimism. Traders should monitor these levels closely for potential breakout or reversal signals.
Please note that stock prices are subject to market risks and can change rapidly. It's advisable to consult with a financial advisor before making investment decisions.

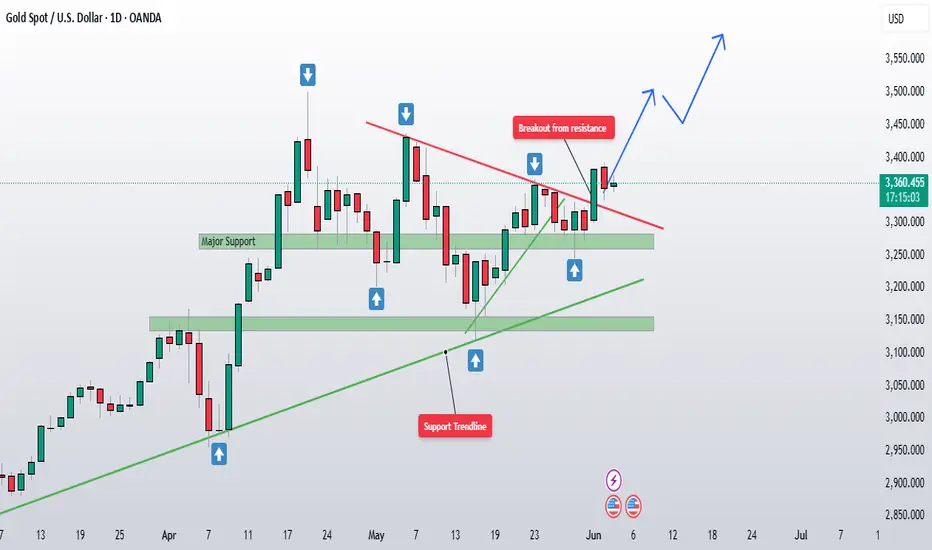
Gold Holding Strong Looks Like It’s Building Power AgainPrice appears to be consolidating just above the breakout trendline, forming a new bullish base between 3350–3365 on the daily timeframe. This is a healthy sign ,it indicates that buyers are absorbing supply and not allowing price to fall back into the old range.
As long as this consolidation holds, the setup remains bullish, with upside potential still targeting 3445 and then ATH at 3500. If we get a decisive breakout above ATH, we might see a continuation rally. However, if a double top starts forming there, it will be time to book partial profits and wait for confirmation.
For Invalidation Level: I am Watching the 3380–3390 zone closely (Monday’s low). A strong move below this level could signal a failed breakout and invalidate the current bullish structure.
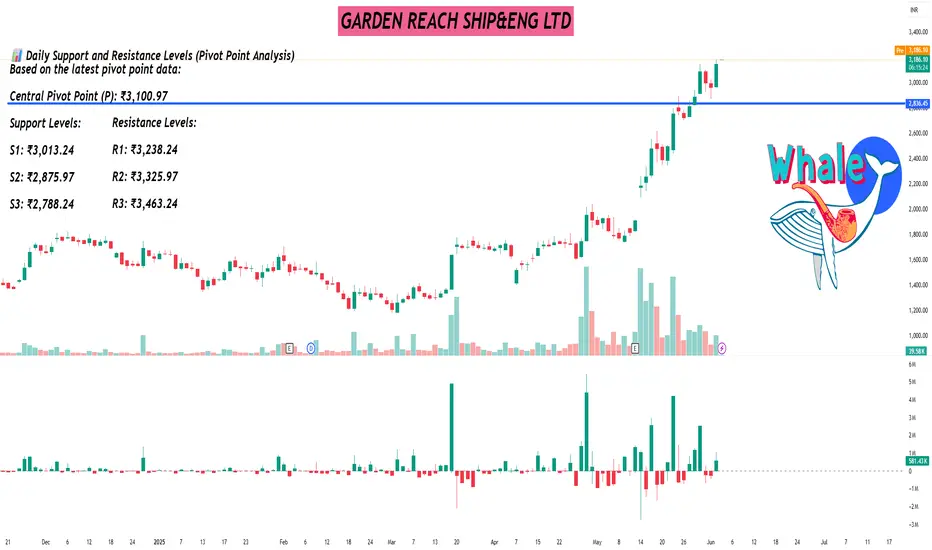
GARDEN REACH SHIP&ENG LTDAs of June 4, 2025, Garden Reach Shipbuilders & Engineers Ltd (NSE: GRSE) is trading at ₹3,150.50, marking a 6.22% increase for the day and reaching a new 52-week high .
📊 Daily Support and Resistance Levels (Pivot Point Analysis)
Based on the latest pivot point data:
Central Pivot Point (P): ₹3,100.97
Support Levels:
S1: ₹3,013.24
S2: ₹2,875.97
S3: ₹2,788.24
Resistance Levels:
R1: ₹3,238.24
R2: ₹3,325.97
R3: ₹3,463.24
These levels are derived from standard pivot point calculations and are commonly used by traders to identify potential support and resistance zones .
📈 Technical Overview
Trend: The stock has demonstrated strong upward momentum, with a 15.15% increase over the past week and a 64.35% rise over the past month .
Volatility: GRSE exhibits high volatility, with a beta coefficient of 3.08, indicating that the stock is more volatile than the market average .
Relative Strength Index (RSI): The 14-day RSI stands at 75.78, suggesting that the stock is in overbought territory, which may precede a price correction .
🔍 Additional Insights
Recent technical indicators suggest that GRSE is experiencing strong bullish momentum. However, the elevated RSI indicates that the stock may be overbought, and investors should be cautious of potential short-term corrections.
Please note that stock prices are subject to market risks and can change rapidly. It's advisable to consult with a financial advisor before making investment decisions.
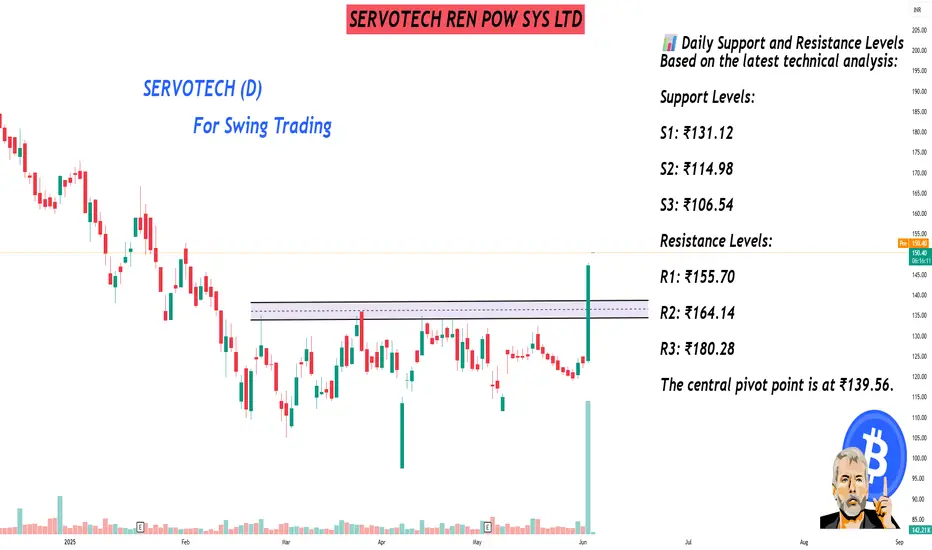
SERVOTECH REN POW SYS LTDAs of June 4, 2025, Servotech Renewable Power Systems Ltd (NSE: SERVOTECH) is trading at ₹147.26.
📊 Daily Support and Resistance Levels
Based on the latest technical analysis:
Support Levels:
S1: ₹131.12
S2: ₹114.98
S3: ₹106.54
Resistance Levels:
R1: ₹155.70
R2: ₹164.14
R3: ₹180.28
The central pivot point is at ₹139.56.
📈 Technical Overview
Trend: The stock has exhibited strong upward momentum, with a 19.39% return in one day, 13.95% over the past month, and 33.27% in the last three months.
Technical Indicators: The Relative Strength Index (RSI) is at 82.637, indicating overbought conditions. Other indicators like MACD and ADX suggest a strong bullish trend.
Volatility: The stock has shown average daily movements with good trading volume, indicating medium risk.
🔍 Additional Insights
Servotech Renewable Power Systems Ltd recently garnered attention due to significant developments, including a visit from Errol Musk, which may have influenced investor sentiment.
Please note that stock prices are subject to market risks and can change rapidly. It's advisable to consult with a financial advisor before making investment decisions.
NDR AUTO COMPONENTS LTDAs of June 3, 2025, NDR Auto Components Ltd (NSE: NDRAUTO) is trading at ₹994.50.
📊 Daily Support and Resistance Levels
Based on pivot point analysis:
Support Levels:
S1: ₹949.17
S2: ₹933.58
S3: ₹917.17
Resistance Levels:
R1: ₹981.17
R2: ₹997.58
R3: ₹1,013.17
The central pivot point is at ₹965.58.
📈 Technical Overview
Trend: The stock has shown strong upward momentum, rising approximately 47% over the past month.
Technical Indicators: Currently trading above key resistance levels, suggesting bullish sentiment.
Volatility: With a beta of 1.92, the stock exhibits higher volatility compared to the market.
🔍 Additional Insights
NDR Auto Components recently reported a 41.17% increase in net profit for the March 2025 quarter, indicating strong financial performance.
Please note that stock prices are subject to market risks and can change rapidly. It's advisable to consult with a financial advisor before making investment decisions.

NATIONAL FERT. LTDNATIONAL FERTILIZERS LTD
1 Day Support and Resistance (Based on Latest Price: ₹107.38)
Support Levels: ₹104.50 / ₹101.20 / ₹97.80
Resistance Levels: ₹110.00 / ₹114.30 / ₹118.00
Chart Note: Strong momentum above ₹110 may push the stock towards the ₹114–₹118 zone; watch for volume confirmation.
