GBPUSD – Medium-Term H1/H4 Technical Outlook
Overview: GBPUSD has recently broken below its ascending trendline/channel after failing to sustain momentum near the 1.3530–1.3575 supply zone. At present, price is testing the 0.618 retracement (~1.3366), while the RSI (5) is heavily oversold (~13–14). This signals the possibility of a short-term bounce before the broader bearish bias resumes.
For Indian traders who follow GBPUSD closely, the focus should remain on selling rallies into resistance while being open to buying intraday dips at clearly defined liquidity levels.
Market Structure & Key Observations
Trendline Break: The bullish channel has been violated, shifting momentum to a “sell-the-rally” strategy.
Resistance Zones: 1.3537 and 1.3453–1.3428 (strong supply levels).
Support Zones: Initial support at 1.3366 (Fib 0.618) and 1.3319; major demand lies at 1.3143–1.3093.
Momentum Check: Deep oversold RSI could trigger corrective recoveries, making intraday scalps attractive.
Trading Plan
Sell the Rally – Primary Bias
Entry: 1.3500 – 1.3510
Stop Loss: 1.3550
Take Profit: 1.3480 – 1.3466 – 1.3445 – 1.3430
📌 Idea: Short entries on retest of broken structure. Only invalid if we see a 4H close above 1.3550.
Buy the Dip – Intraday Scalping
Entry: 1.3310 – 1.3330
Stop Loss: 1.3290
Take Profit: 1.3355 – 1.3368 – 1.3390 – 1.3410
📌 Idea: Quick long trades from liquidity near 1.3319, targeting minor resistance.
Buy Deeper Liquidity Sweep – Swing Setup
Entry: 1.3090 – 1.3110
Stop Loss: 1.3050
Take Profit: 1.3135 – 1.3160 – 1.3200 – 1.3240
📌 Idea: If the market flushes into the 1.3143–1.3093 demand zone, expect stronger bounce potential.
Risk Management & Invalidation
Above 1.3550 (4H close) → Bearish bias invalidated.
Strong breakdown below 1.3310 → Skip scalps, focus on deeper buy zones.
Partial profit booking at each target is recommended to protect capital.
M-forex

LiamTrading – XAUUSD IN-DEPTH ANALYSIS OF CURRENT TRENDLiamTrading – XAUUSD Scenario Today: Opportunities at Key Price Levels
Gold continues its strong upward momentum, currently fluctuating around the 376x–377x range after a series of breakthroughs. The technical structure on the H1 chart shows the market is forming clear resistance and support zones, suitable for short-term trading plans.
Technical Analysis
RSI is cooling off from high levels, indicating the possibility of a short-term correction.
The upper price range around 3818–3821 is a strong confluence of resistance, coinciding with wave peaks and Fibonacci extensions, making it prone to selling reactions.
Conversely, the support zones at 373x and 370x exhibit dense liquidity, serving as potential buying points when prices adjust.
The short-term Dow structure still leans towards an uptrend, but attention is needed for the sell confirmation zone if gold fails at the peak.
Reference Trading Plan
Sell Zone: 3818 – 3821, SL 3828, TP 3805 – 3785 – 3760 – 3732 – 3650
Buy Scalping: 3728 – 3731, SL 3723, TP 3750 – 3777 – 3790
Buy Zone: 3706 – 3709, SL 3700, TP 3725 – 3738 – 3750 – 3777 – 3790
In summary, the main trend still leans towards an increase, but with gold approaching strong resistance zones, the likelihood of a correction is very high. Traders need to patiently wait for reactions at the marked zones for optimal entries, while managing risk tightly.
This is my personal view on XAUUSD. If you're interested in gold scenarios, follow me for the fastest updates.

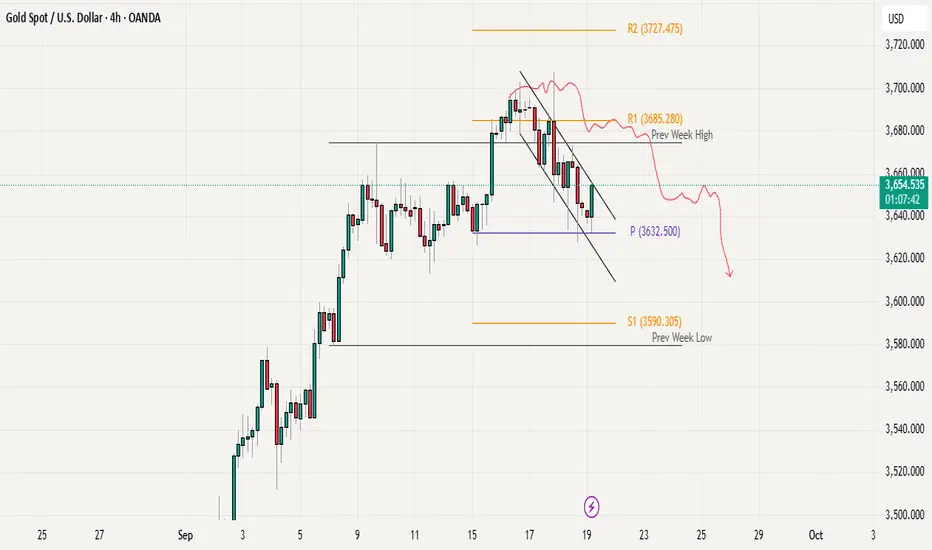
Gold Finds Support at R1 , buy the Dip stills looks good We have seen a solid pullback (of over 72 points from the highs) in yesterday’s session, yet the broader structure on the H4 and higher timeframes remains firmly bullish, maintaining its HH-HL pattern. Price has so far rejected the 3720 zone (Weekly R1), confirming it as near-term support, and is now retesting the immediate resistance at 3750 along with the descending trendline overhead.
As long as gold holds above the PWH / 3700–3680 demand zone, this looks like a healthy consolidation rather than a trend reversal. A sustained breakout above 3750 and the descending trendline could trigger momentum toward the 3790–3800 zone once again.
For the short- to mid-term outlook, buying dips remains the preferred strategy, with invalidation coming only on a clean breakdown and H4 close below 3700 with strong volume.

Gold Neowave UpdateFX:XAUUSD Namaskaram Everyone
Welcome to intelligent investor, we provide market insights by synchronising and combining all the price action waves from different time frames and gives you single trend.
GOLD & BTCUSD Video Analysis
How To Read My Charts...Click Below

Gold & BitCoin (Neowave Forecast)Namaskaram Everyone
Welcome to intelligent investor, we provide market insights by synchronising and combining all the price action waves from different time frames and gives you single trend.
How To Read My Charts...Click Below

Gold Soars: Will a Weak USD Open the Door for New Highs?Hello traders, it’s clear that gold is rising sharply, supported by the weakening of the USD. Can gold continue to conquer new highs?
On the chart, the price is moving within a clear upward channel. The key support level at 3,750,000 has been tested multiple times, and if the price holds above this level, gold could continue rising towards 3,827,000. The areas near recent highs also show an increase in trading volume, reinforcing the bullish trend.
Forecasts indicate that the U.S. labor market is slowing down, with 233K jobs created, slightly higher than the previous 231K. This weakens the USD, creating an opportunity for gold to continue its rise, as gold typically benefits from a weaker USD.
With strong technicals and a weakening USD, XAU/USD could continue its upward momentum. Get ready for some exciting opportunities!

LiamTrading – XAUUSD H1LiamTrading – XAUUSD H1: Adjustment structure formed, awaiting confirmation below 3685
After the surge to 375x, gold is entering a correction phase in line with the structural pattern. On H1, the price clings to the upper edge of the rising wedge, with RSI cooling off from overbought levels, indicating that supply pressure is starting to dominate. Today's plan focuses on the adjustment structure, prioritising selling upon confirmation signals.
Key price zones (as per the attached chart)
Sell strong resistance 3775–3785: confluence of channel top + 2.618 extension. Look for weakening reactions to initiate short/medium-term sell orders.
Buy zone volume 3726–3720: a thin support area providing momentum for a rebound. Holding this zone could push the price to retest 3750–3775; conversely, losing 3720 may lead to a deeper decline.
Resistance + FVG 3715–3698: as the price drops, this area turns into supply; a failed retest here is an early signal for further decline.
Confirm sell 3688–3685: closing H1 below this zone confirms a short-term downtrend, targeting a lower buy zone.
BuyZone 3652–3646: confluence of channel bottom + old liquidity, expecting a strong bullish reaction if revisited.
Reference trading scenarios (adhering to risk management)
Sell reaction at peak: 3778–3783, SL 3792, TP 3755 → 3738 → 3722.
Sell on confirmation: wait for H1 to close below 3685, enter sell 3684–3682, SL 3696, TP 3673 → 3656 → 3648.
Buy scalp by volume: 3726–3720, SL 3715, TP 3738 → 3750 (only short-term if the larger structure remains corrective).
Buy swing at strong zone: 3652–3646, SL 3639, TP 3673 → 3698 → 3712 → 3740.
Operational notes
Prioritise waiting for rejection/closing signals at the mentioned zones; avoid chasing orders in between.
Order volume should be allocated according to confirmation levels (confirmation zone < breakdown < failed retest).
Avoid excessive leverage; adjust SL according to structure when in profit.
This is a personal perspective, not an investment recommendation. If you want the quickest updates on the next XAUUSD scenarios, follow me and join my community for discussions.

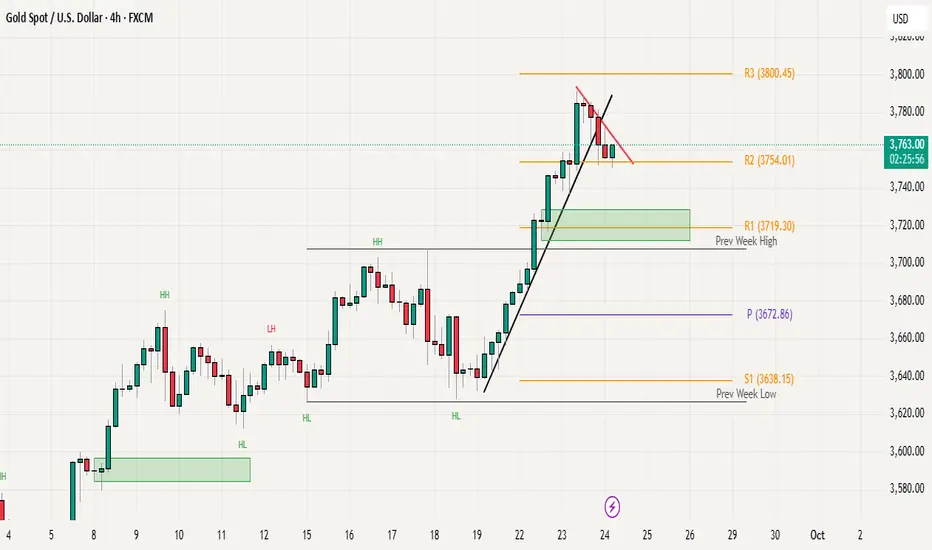
Gold Price Action: Trendline Break but Bulls Still in ControlGold posted a fresh all-time high yesterday near 3790 before entering a healthy pullback phase after an extended intraday rally. The higher-timeframe structure remains constructive, with the market still maintaining its higher-highs and higher-lows sequence. However, price action has broken below the rising trendline support we discussed in yesterday’s update, signaling a short-term pause in momentum.
At the moment, gold is consolidating just above R2 (3754), which continues to act as an important intraday support. For bulls to regain momentum and extend the rally, price needs to break above the declining red resistance trendline and sustain above the 3790–3800 zone. A breakout here could open the door for further upside continuation.
On the other hand, a confirmed H4 close below 3750 could invite deeper profit-taking, with the 3700–3710 area (previous week’s high) remaining the key demand zone and primary downside support.
Overall, the broader trend remains bullish, but price action is currently in a consolidation phase. Watching for either a breakout above resistance or a close below 3750 will provide clarity on the next directional move.
Gold Prices Continue to Rise Amid Rate Cuts and Geopolitical RisGold prices today are being strongly supported by growing expectations that the Federal Reserve (FED) will continue to cut interest rates and the increasing demand for safe-haven assets amid rising geopolitical instability.
Last week, the FED made its first rate cut of 0.25% since December, causing gold prices to surge. While some investors took profits, most experts believe the uptrend is not over yet.
This week, investor focus will be on the U.S. Personal Consumption Expenditures (PCE) data for August, the FED's preferred inflation measure, which may provide further clues about future rate cuts. Many forecasts predict a slowdown in core PCE, reinforcing the case for continued rate cuts by the FED.
Additionally, safe-haven flows are further supported by prolonged geopolitical risks, including the Russia-Ukraine conflict and concerns over economic impacts from U.S. tariffs.
Furthermore, strong gold buying activity from global central banks plays a crucial role in strengthening the bullish outlook for the precious metal.

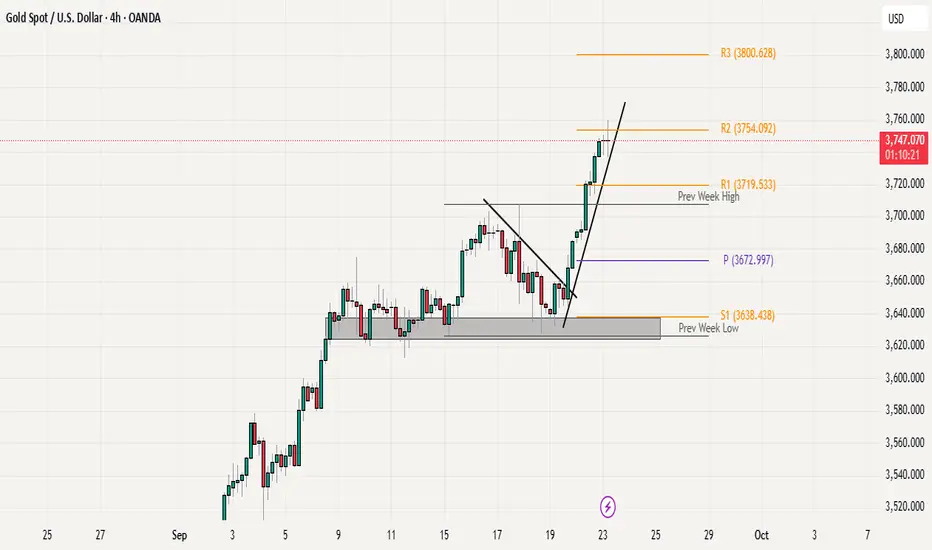
Bullish Momentum Intact: Watching R2 for continuation or pause Gold continued its upside momentum after a clean breakout above the previous week’s high, leading to a strong one-way rally towards the weekly R2 level at 3754. At the moment, price is holding well above the rising trendline, showing no signs of major rejection or reversal. The immediate resistance remains at weekly R2, and a sustained break above this level could open the door for a move towards weekly R3 around 3800.
The overall structure is still bullish, with higher highs and higher lows firmly intact. For any meaningful correction to take place, price would first need to break below the rising trendline. A deeper retracement would require price to trade back under the previous week’s high, which would then shift the short-term bias toward the weekly pivot zone near 3672. Until then, dips are likely to be seen as buying opportunities.
XAUUSD – Wolfe Waves forming on H4 chart, clear correction signaHello Trader,
On the H4 chart, gold is forming a quite standard Wolfe Waves pattern. The 5th wave has completed, and the price is moving into the crucial resistance zone of 3760 – 3770, which is also a potential Sell Zone. Given the current structure, the preferred scenario is a short-term downward correction before the main trend resumes.
Technical Analysis
The price has touched the 2.618 Fibonacci Extension and reacted with a decline, indicating profit-taking pressure.
The MACD still shows the previous buying force was quite strong, but the histogram is starting to weaken, aligning with the possibility of a correction wave emerging.
Area 3760 – 3770: a critical resistance zone, also coinciding with the 5th wave line of Wolfe Waves.
Trading Scenario
Sell order according to Wolfe Waves
Entry: 3760 – 3770
SL: 3782 (above resistance zone)
TP: 3710 -3660 -3610 – 3620 (key level Wolfe target)
Sell when price confirms below trendline
Entry 3727-3730
sl 3735
tp 3715-3700-3686-3665
Short-term Buy Scalping
Entry: 3705 – 3708
SL: 3700
TP: 3720-3730 – 3745- 3766
Note: This is just a short-term retracement strategy, going against the correction, so risk management is crucial.
Conclusion
Short-term: Prioritise observing reversal signals at 3760 – 3770 to Sell.
Medium-term: Wait for Buy opportunities around 3564 – 3574 to align with the main trend.
The market is entering a distribution and correction phase, so patiently waiting for candle confirmations at key zones will be key to optimising entry.
This is the Wolfe Waves scenario I propose for gold during this period. You can refer to and adjust according to your own strategy.
Follow me for the fastest updates when the price structure changes.

LiamTrading – XAUUSD Trading Scenario for TodayGold continues its robust upward momentum and is now approaching the critical resistance zone around 3,697 – 3,700. This is a confluence point with the Fibonacci extension level and also a zone where sellers might re-enter strongly.
Technical Analysis
On the H1 chart, the price has tested the resistance zone multiple times but hasn't broken through decisively. This indicates that profit-taking pressure is emerging.
The sell confirmation zone will form if the price breaks below 3,685 – 3,686, at which point the correction target could be around 3,673.
The main Buy Zone is located at 3,650 – 3,645, coinciding with previous support and a strong liquidity area. This is a region where a price increase reaction is likely.
Further down, the 3,628 – 3,630 zone is considered solid support on the larger frame, and if retested, it will be a long-term buying opportunity.
Conversely, if the price decisively surpasses the strong resistance zone of 3,720 – 3,730, the upward trend will be confirmed to continue, opening up higher targets around 3,750+.
Trading Plan Reference
Short-term sell around 3,697 – 3,700, SL 3,707, TP 3,686 – 3,673.
Short-term buy around 3,650 – 3,645, SL 3,640, TP 3,673 – 3,690.
Long-term buy around 3,628 – 3,630, SL 3,620, TP 3,660 – 3,690 – 3,720.
These are my personal views on XAUUSD, and you can use them as a reference to build your own plan. If you find this useful, follow me for the latest updates on new gold trading scenarios.

XAUUSD – Daily Trading Plan
Hello Traders,
Gold opened the Asian session holding its price structure firmly. The 3708 level will be the key pivot today:
If price sustains above this level, the next upside targets are 3750 and possibly 3780.
If price reacts lower at 3708 resistance, then 3650 or even 355x could be the zones to watch for buying opportunities.
Fundamental Context
Last week’s correction was triggered by comments from the Fed Chair on interest rate policy. The Fed does not intend to cut rates too frequently, and this week’s PCE data will play a decisive role in shaping the outlook.
Trading Strategy for Today
Buy Setup
Entry: 3650 – 3653
SL: 3645
TP: 3662 – 3675 – 3690 – 3706 – 3725
Sell Setup 1
Entry: 3700 – 3703
SL: 3708
TP: 3690 – 3675 – 3662 – 3650 – 3633
Sell Setup 2
Entry: 3738 – 3740
SL: 3746
TP: 3725 – 3710 – 3700 – 3675 – 3650
Summary
The preferred bias for today is to look for buy opportunities on dips, in line with the broader uptrend.
Follow me to receive the latest updates as soon as market structure changes

Gold Consolidating Near All-Time HighLast week Gold made a new all-time high around the 3707 level, and we have seen minor pullback after this high, leading to a pullback towards the 3620 -30 area. From there, the price bounced back strongly and is now trading close to the 3700 mark again. Currently, the market seems to be consolidating in a range between 3620 and 3700-07. The overall trend still looks bullish, but for the next clear direction, we need a strong higher time frame close either above 3700 for further upside or below 3600 for possible deeper correction.
Immediate resistance 3700-07
Weekly R1 3719
Weekly R2 3754
Pivot 3672 (As immediate support)
Weekly S1 3628

XAU/USD: Sideway or Waiting for a Breakout?Hello traders, gold is currently in a clear sideways phase , moving within a narrow trading range between support at 3,652 USD and resistance at 3,700 USD. The chart shows that gold continues to fluctuate in this area without any signs of a strong breakout.
Although there is no major immediate news impact, the recent Fed rate cut has created a slight bullish bias for gold, as it continues to be viewed as a safe-haven asset in a low-interest-rate environment. This may support gold in holding within the current range, with a slight upside potential if price stays above the 3,652 USD support level.
If gold breaks above the 3,700 USD resistance , the uptrend could continue. However, if it breaks below current support levels , the market may see a correction. We need to monitor market signals closely to determine any trend shift.

XAUUSD – Strong Resistance at 3760–3770 Await ConfirmationHello trader,
Gold continues to fluctuate within the accumulation zone after the recent recovery. Although the larger trend leans towards an increase, a clear confirmation at key resistance-support levels is needed for a stronger breakout.
Strong Resistance: 3760 – 3770, converging with the Fibonacci extension zone. This is a crucial level if the price aims to create a new ATH in the mid-term.
Key level Sell: 3685 – 3695, currently a short-term resistance zone. If the price fails to break through, gold may face downward pressure.
Important Support:
3564 – 3574: mid-term support.
3534 – 3540: deep support zone, aligning with previous liquidity.
MACD H4: Histogram remains weak, momentum is unclear → the market needs further confirmation to clearly define the trend.
Trading Scenario
Bullish Scenario
Condition: Price breaks above 3695 and holds.
Entry: Retest 3665 – 3668.
Target: 3680-3698-3715-3730 – 3760 – 3770.
Extension: If successfully surpassing 3770 → expect a move towards 3800+.
Bearish Scenario
Condition: Price fails at 3695 and reverses.
Entry: Sell at 3685 – 3695 zone upon rejection signal.
Target: 3672-3655-3635 – 3600 – 3574.
Extension: If breaking 3574, the decline may target 3540, or even deeper.
Mid-term Scenario
Price may retest 3534 – 3550 to gather liquidity, then rebound following the larger trend. This will be an attractive long-term Buy zone.
The gold market is at a crucial stage: buyers need to break 3695 to confirm the uptrend, while sellers still have opportunities at the short-term resistance zone. Deep support levels will continue to serve as a foundation for mid-term Buy strategies.
Keep a close watch on 3695 and 3760 – 3770 to determine the next direction.
Stay tuned for the latest scenarios as the price structure evolves.

XAUUSD - Flag PatternWhats your take on Guys.
#Institutions Consolidation going on - #Accumulation or #Distribution.
Kind of #Triangle #pattern in formation, ##Flagpattern. DO your analysis, Enter trade on Breakout and confirmation side. Trade with #confluence. i would say accumulate at bottom of pattern with SL and Participate in full swing before #Breakout.

XAUUSD: Sideway Trading Opportunity Before Further Decline?Hello, fellow traders! Today, we will analyze XAUUSD and identify a great trading opportunity in the sideway trend before gold could potentially continue its downward adjustment.
Yesterday, although the Fed cut interest rates to 4.25% as expected (4.25% compared to 4.50% previously) , the cut did not exceed expectations, reducing the outlook for further policy easing. The USD may no longer weaken , putting downward pressure on gold.
In addition, the unemployment claims data came in lower than forecast (231K vs. 241K) , indicating a strong labor market, which will support the USD. When the USD strengthens, gold typically faces downward pressure, meaning gold prices could fall further if the USD continues to strengthen.
Gold is facing strong resistance at 3,700 , showing signs of a decline. The 3,660 zone is a key rebound level, and if support at 3,600 is not broken, gold could trade sideways before continuing the downward trend. Low trading volume and flow of funds suggest that the sideway trend could continue in the short term.
Don’t forget, our trading strategy needs to be flexible, seizing opportunities, and never missing any market changes.

XAUUSD – Correction Target on H4Technical Analysis
After reacting at the Sell Zone – FVG around 3,670, Gold could not sustain the upward momentum and is now showing signs of weakness. The H4 structure indicates that the correction phase is extending, with price likely to retest key support areas below.
On the chart, the support zones at 3,633–3,632 and 3,626 are acting as intermediate levels. If these zones fail to hold, selling pressure may push price deeper towards 3,614–3,612, before testing the major support confluence with Fibonacci extension and the potential Buy Zone at 3,579–3,560.
The RSI is currently hovering around 45–50, suggesting momentum is tilted towards a corrective move rather than a strong uptrend.
Trading Scenarios
SELL Setup (preferred):
Entry: on a retest of the 3,665–3,670 Sell Zone
SL: above 3,675
Targets: 3,633–3,632-3,626-3,614–3,612-3,579–3,560
BUY Setup (short-term / scalping):
Entry: consider buys around 3,626–3,625 support
SL: below 3,618
Targets:3,633-3,645-3,650
Key Levels to Watch
3,670: Sell Zone – confluence with FVG post-FOMC.
3,633–3,626: Short-term support; a break below confirms extended bearish pressure.
3,612: Key level for deciding near-term direction.
3,579–3,560: Potential Buy Zone and main corrective target on H4.
Traders may keep these levels on watch and align positions accordingly. Follow for quicker access to future updates.

XAUUSD –Today’s Trading Outlook | Sell Fill Liquidity & Buy Zone
Hello traders,
In the recent sessions, gold has continued to show strong volatility around important liquidity zones and support–resistance levels. The current structure indicates that sellers remain in control in the short term, while buyers are expected to return only if price reaches deeper support areas.
Technical View
Main Resistance: 3670 – 3680, aligning with the FVG zone → key area for Sell to Fill Liquidity.
Short-term Support: 3630 – 3627. A break below could open the way for a deeper decline.
Buy Scalping Zones: 3613 – 3615 and 3595 – 3598, suitable for quick intraday longs.
Medium-term Buy Zone: 3600 – 3590, confluence with strong liquidity zone and major support.
MACD Indicator: leaning bearish, with a negative histogram, showing selling pressure still dominant.
Trading Scenarios
Sell Setup (priority)
Sell Liquidity Zone: 3670 – 3680
SL: 3685
TP: 3650 – 3635 – 3627 – 3615 – 3600
Buy Scalping
Buy Zone 1: 3613 – 3615 | SL: 3608 | TP: 3625 – 3638 – 3645
Buy Zone 2: 3595 – 3598 | SL: 3590 | TP: 3610 – 3625 – 3638 – 3645 – 3670
Medium-term Buy
Zone: 3600 – 3590
SL: 3584
Extended TP: 3633 – 3660 – 3675
Conclusion
In the short term, gold is likely to retest the upper liquidity zone before continuing with further declines. Sellers remain in control for now, but deeper support zones will provide potential entry levels for medium-term buyers.
Keep a close watch on these key levels and align your trades with your personal strategy.
Follow along to get the earliest updates whenever market structure changes.

Gold Intraday Analysis: Range Play Until BreakoutGold is currently trading in a range-bound structure after pulling back from the 3700 level. The weekly pivot around 3632 is acting as strong support, while the 3700 zone serves as resistance, forming the upper boundary of the range. Price is showing signs of consolidation between these levels, suggesting a sideways market. For any breakout confirmation, we need to see a clear H1 or H4 candle close above 3700 or below 3632, along with volume or strong price rejection/follow-through. Until then, the price action favors range trading within these key levels.
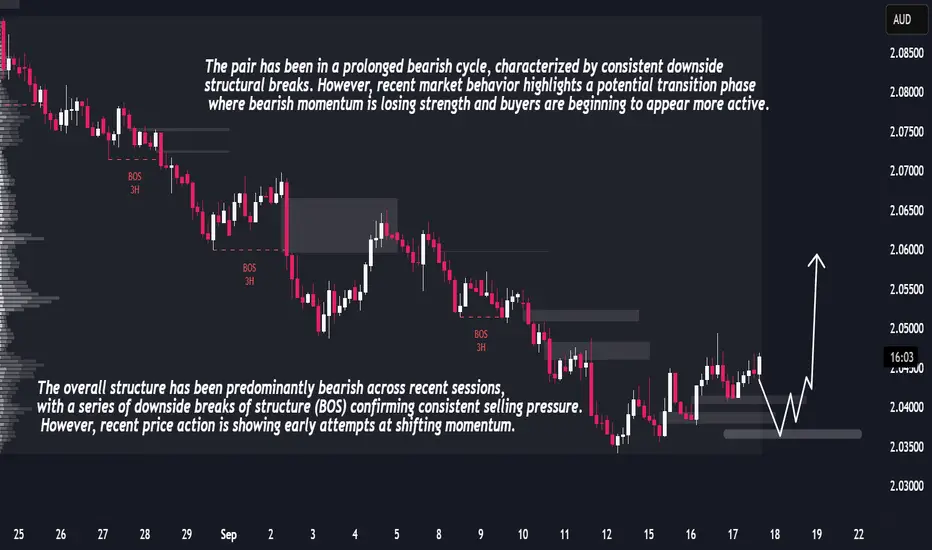
GBPAUD Forecast – Liquidity Sweep Before Strong Upside RallyGBPAUD has been moving through an extended bearish cycle, confirmed by multiple downside breaks of structure that signaled strong sell-side control. Each leg cleared liquidity and left inefficiencies behind, reflecting a market environment dominated by distribution phases. Recently, however, the dynamics are shifting. Price action has begun to compress, with shorter bearish candles and emerging higher lows that point toward weakening seller momentum and the early signs of accumulation.
Order flow analysis suggests that institutional participants may be absorbing positions within the current range. The market appears poised to engineer a downward liquidity sweep to trigger weak longs and attract late sellers before reversing upward. This type of behavior is typical of smart money accumulation phases, where liquidity is harvested before expansion.
Volume and volatility add weight to this narrative. Downside moves are losing strength, showing seller exhaustion, while volatility has contracted, signaling the market is coiling energy for a breakout. Given the structural setup and liquidity positioning, the probability favors a bullish expansion following a brief dip.