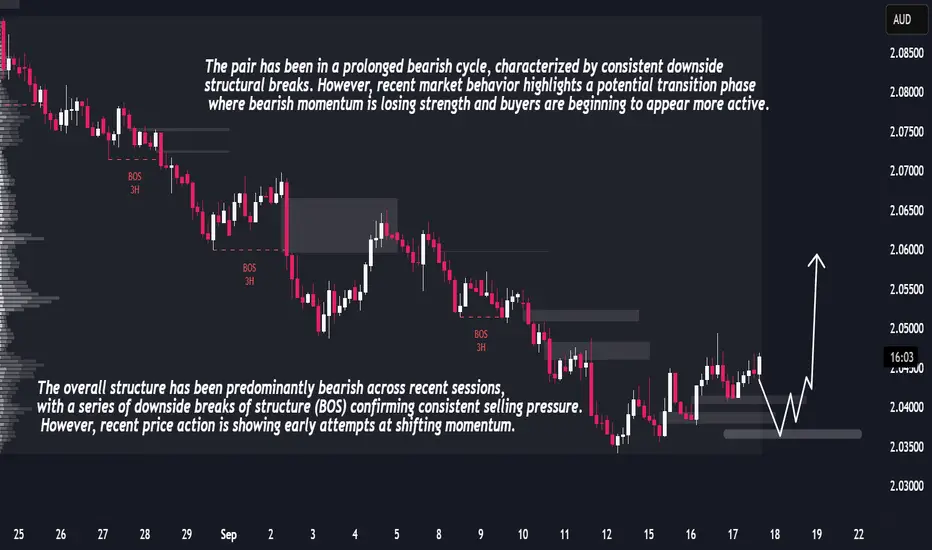
GBPAUD Forecast – Liquidity Sweep Before Strong Upside RallyGBPAUD has been moving through an extended bearish cycle, confirmed by multiple downside breaks of structure that signaled strong sell-side control. Each leg cleared liquidity and left inefficiencies behind, reflecting a market environment dominated by distribution phases. Recently, however, the dynamics are shifting. Price action has begun to compress, with shorter bearish candles and emerging higher lows that point toward weakening seller momentum and the early signs of accumulation.
Order flow analysis suggests that institutional participants may be absorbing positions within the current range. The market appears poised to engineer a downward liquidity sweep to trigger weak longs and attract late sellers before reversing upward. This type of behavior is typical of smart money accumulation phases, where liquidity is harvested before expansion.
Volume and volatility add weight to this narrative. Downside moves are losing strength, showing seller exhaustion, while volatility has contracted, signaling the market is coiling energy for a breakout. Given the structural setup and liquidity positioning, the probability favors a bullish expansion following a brief dip.
M-forex
XAUUSD – Medium-Term Outlook After Fed Rate CutXAUUSD – Medium-Term Outlook After Fed Rate Cut
Hello fellow traders,
The most anticipated event of September is now clear: the Federal Reserve has cut interest rates by 25 basis points, the first reduction this year. Market expectations also indicate the possibility of another 50 basis points cut in the upcoming meeting. In his speech, Chairman Powell highlighted the “dual risk” – inflation could rise further while employment shows signs of weakness.
Technical View
Gold has formed an H1 candle closing below the rising price channel, signalling a possible violation of the medium-term uptrend.
The buying side failed to maintain momentum after the rate cut news, showing caution in entering at elevated price levels.
Medium-term investors may consider waiting for a lower price to enter fresh longs.
However, the downside is not fully confirmed, as price is still hovering around the ascending trendline → selling directly at current levels still carries certain risks.
Trading Scenarios
Sell Strategy
Scalping: 3676 – 3678 | SL: 3683 | TP: 3666 – 3650 – 3635 – 3628
(Stop loss can be moved to breakeven if price reacts well, to hold positions longer).
Sell Zone: 3697 – 3700 | SL: 3705 | TP: 3680 – 3666 – 3650 – 3635 – 3628
Buy Strategy
Scalping: 3634 – 3636 | SL: 3629 | TP: 3645 – 3660 – 3672
Buy Zone: 3600 – 3598 | SL: 3590 | TP: 3633 – 3645 – 3660 – 3675 (extended)
Conclusion
Gold is currently in a sensitive phase after the Fed’s decision to cut rates. Traders must watch price action carefully around major support and resistance levels to confirm a clearer direction.
Stay tuned to this outlook — I will continue to provide updates as the market structure evolves. Follow along to receive the fastest scenario changes as price action develops.

LiamTrading – XAUUSD OutlookSharing my personal view on the possible next move for gold.
Based on the current chart structure, the wave formation suggests that XAUUSD is most likely in Wave 4. The correction started yesterday after price touched the 3,700 mark – a round resistance level which also coincides with the 1.618 Fibonacci extension. This area often attracts heavy liquidity, and the subsequent pullback further supports the view that Wave 4 has been activated.
At present, the key support to watch is 3,675. If this level breaks, the corrective structure could complete around 3,656. On the H1 timeframe, the RSI has moved below the 30 level, indicating oversold conditions. In my view, while the market remains in this phase, it is still preferable to look for selling opportunities, though patience is needed until clearer confluence signals appear.
Trading plan (short-term focus):
Sell entry 3685–3687, SL 3693, TP 3670 – 3656
Buy entry 3656–3654, SL 3648, TP 3675 – 3690 – 3702 – 3721 – 3740
I will continue to share further updates if there are significant moves in price. Wishing everyone successful and effective trading.

XAUUSD H1 – Pennant + Head & ShouldersXAUUSD H1 – Pennant + Head & Shoulders: Two Key Levels 3657 / 3627
Hello Traders,
Gold opened the week with a bounce of over 20 points from the rising trendline and is now consolidating within a Pennant, which aligns with a small Head & Shoulders structure on the H1 chart. At the moment, the market is waiting for a breakout and confirmation to establish a clearer direction.
Pattern: A narrowing Pennant Flag alongside an H&S (left shoulder – head – right shoulder).
Key Zones to Watch
3655–3660: Crucial reaction zone (trendline + Pennant top).
3627: Critical support — a break below would invalidate the short-term bullish structure.
Fibonacci Levels:
1.618 in the mid-range, 2.618 lower — possible targets for a deeper correction.
MACD (12,26,9): Histogram has turned negative → short-term bearish momentum has the edge, though clear confirmation is still pending.
Trading Scenarios
Bullish Setup
Entry: Retest around 3654–3657
Targets: 3663 – 3670 – 3680 → 3695
Stop: Below 3648
Bearish Setup
Entry: Sell directly on breakdown, or wait for a retest near 3671–3674
Targets: 3663 – 3650 – 3633 – 3615 → 3595 → 3568 → 3540
Stop: Above 3679
the market is currently pricing in near certainty of a 0.25% Fed rate cut on 17th September, while the probability of a 0.50% cut still remains on the table.
If you find this analysis helpful, feel free to share your thoughts in the comments. I’ll update the outlook as soon as the price structure changes — follow me to get the latest setups first.

LiamTrading – XAUUSD Strategy for TodayI would like to share my personal view on gold for the day.
The overall trend in XAUUSD continues to be very strong, with the price consistently making fresh highs over the past two weeks. Buying interest has remained steady across sessions, while any corrections have been short-lived, mostly visible on the M15–M30 timeframes.
Yesterday, gold broke out of the Pennant pattern on the upside and is now consolidating near 3,680. On the H4 chart, this level aligns with an important Fibonacci zone, providing further technical confirmation.
From an Elliott Wave perspective, I expect Wave 3 to conclude near 3,700, followed by a corrective Wave 4 towards 3,660 – a level which has acted as reliable support in the past. After that, gold may enter its final Wave 5, with the potential to move towards the 3,740+ region.
Trading setups for consideration:
Buy 3658 – 3656, SL 3651, TP 3674 – 3688 – 3700 – 3715 – 3730 – 3744
Sell 3697 – 3700, SL 3705, TP 3688 – 3672 – 3660 – 3650
Sell 3740 – 3744, SL 3748, TP will be decided based on the price structure at that time
Important levels to keep in focus: 3673 – 3663 – 3635 and 3721, as these zones may trigger price reactions and could be useful for intraday scalping opportunities.
This is my personal outlook on gold for today. I hope it will be helpful to fellow traders in making better trading decisions. Kindly share your feedback in the comments.

GOLD Bullish continuation (new highs, momentum sustain) :
Probability: around 60–65%
The breakout has strong support from macro conditions. Real yields look like they are peaking, inflation expectations remain sticky, and the Fed is leaning toward easing. On top of that, the US dollar is softening and central banks are continuing to add gold to reserves. These combined factors increase the odds that the breakout holds and the trend continues higher.
Sideways consolidation or retest of breakout :
Probability: about 25–30%
A pullback or cnsolidation wouldn’t be surprising, especially if the Fed sounds less dovish or if inflation data cools faster than expected. In that case, gold could spend some time chopping between support and resistance before deciding its next big move.
Major correction or deep mean reversion :
A deep selloff looks like the least likely path right now. Real yields aren’t rising sharply, inflation isn’t collapsing, and the dollar is still under pressure. But nothing is guaranteed. A surprise hawkish turn from the Fed or a sudden global disinflation shock could knock gold back toward old structural levels.but this remains the least likely scenario in the near to medium term.

Fresh Highs, Hot Headlines , Is a Pullback Next?Gold broke out of its recent range yesterday and is now trading at new all-time highs, showing strong follow-through momentum. On the weekly pivot chart, price is currently testing Weekly R1, with the next key level being the psychological 3700 resistance.
While the technical structure remains bullish, today’s headlines from major gold newsletter are a reminder that sentiment is running extremely hot. When you start seeing mainstream media comparing gold rally to 1979 and celebrating retail traders wins, it often signals that we’re entering a frothy phase.
With the FOMC decision approaching, the risk of a short-term shakeout or healthy correction is definitely on the table. A close back below the breakout zone could trigger profit-taking, while holding above R1 would keep the path open for 3700 and beyond.
For now, 3625–3650 remains the key support area, and as long as price holds above this zone, the trend stays firmly bullish but we should stay cautious and avoid chasing too aggressively at these levels until we get clarity from the Fed.
Personally I am expecting some cool down after FOMC .

Gold Stuck in 3620–3655 Range – All Eyes on Fed DecisionGold is still consolidating between 3620–3625 support and 3650–3655 resistance, respecting this week’s pivot level around 3632. As highlighted in the weekly outlook, this week’s trading action is likely to remain muted until the FOMC rate decision and press conference on Wednesday.
Until then, we can expect price to stay range-bound, with quick scalps working better than trend trades.
Once the Fed outcome is out, we should see a clearer short-term direction.
A higher-timeframe close above 3655 could open the door for a move toward 3675+ and potentially new highs.
On the flip side, a break below 3620 could trigger a deeper pullback, but so far there’s no sign of reversal pressure bulls remain firmly in control on higher timeframes.

Gold Outlook – Short-Term Pullback, Long-Term StrengthGold has shown a strong bullish phase over recent weeks after a long consolidation. The market moved from accumulation into expansion, reflecting renewed participation by larger players. This upward momentum indicates strong capital inflows, supported by macroeconomic uncertainty and shifting investor sentiment.
Technically, price has broken out of a prolonged range and established a clear upward trajectory. Market structure suggests that buyers remain in control, though current price levels are showing signs of potential exhaustion, which could trigger short-term corrective moves before the broader trend resumes.
Fundamentally, global economic pressures continue to boost gold’s role as a safe-haven asset. Concerns over inflation, central bank policy adjustments, and currency volatility are keeping investor demand elevated. With global risk sentiment fluctuating, gold is likely to remain an attractive hedge, sustaining its medium-term bullish outlook despite short-term pullbacks.
Conclusion: Gold is in an expansion cycle, supported by both technical momentum and fundamental demand. Short-term corrections are expected, but the broader trajectory remains upward.

Is EUR/USD Setting Up for a Massive Bullish Move?My EUR/USD analysis is a multi-timeframe forecast focusing on key institutional levels. The daily chart provides a long-term perspective, showing the pair in a consolidation phase after a significant downtrend. I've identified a very powerful sell zone from 2020 that represents a major historical resistance level. I expect sellers to enter the market if the price re-approaches this area.
On the 4-hour chart, the focus shifts to the immediate price action. The pair is currently in a tight consolidating range. My strategy is to wait patiently for a clear breakout from this range. I have identified a Green Order Block (OB) and a Buyer Liquidity zone below the current price. My primary thesis is that the price may drop to these levels to grab liquidity before a larger move upwards.
I've outlined two potential bullish scenarios, both of which target the major sell zone. The first (blue arrow) involves a drop to the buyer liquidity zone before the rally, while the second (white arrow) predicts a more direct breakout. A key part of my plan is to look for confirmation on a lower timeframe, such as a change of character, before entering a long position.
In essence, my analysis is a road map for a potential long trade, but it emphasizes patience, confirmation, and a rule-based approach. The core idea is to follow institutional footprints by targeting liquidity zones and trading with the expected direction of smart money. I will not enter a trade until my specific breakout criteria are met, ensuring a high-probability setup.

NZDJPY SELLSNZDJPY tapped the top of daily supply, aligning with the 88.0 region. While 4H structure is bullish, higher timeframes take priority. Price already flipped 15M structure, giving early bearish confirmation. Short makes sense here with a conservative stop above the daily high. And also if you look at the daily timeframe you can see how bears are in control, 3 times stronger.
Couple of downside targets so let's see.

Bulls Back in Action Next Stop 3700?Gold finally waking up after a quick nap and it’s breaking out of triangle it was stuck in. Eyes on 3650, the key level to watch. A strong higher-timeframe (H4 or daily) close above this level can open doors for the next leg up, with this week’s high around 3675 as the first target or higher 3700 for main target. Support at 3620–3625 looks solid, giving bulls a strong base to defend. No rejection signals yet, trend still looks healthy and bulls clearly aren’t ready to let go of control just yet.

Gold Breaks Out: Rising Buying Power Amid USD WeaknessMarket Context:
The higher-than-expected Unemployment Claims data (263K vs 235K) has weakened the USD, providing favorable conditions for gold to rise. The University of Michigan Consumer Sentiment and Inflation Expectations remain stable, but they do not significantly impact gold’s trend.
XAUUSD is showing a strong upward trend, with gold trading within a solid ascending channel. The support at 3,615.000 USD has been tested and confirmed, providing a stable foundation for further gains. After breaking the 3,650.000 USD resistance, gold has the potential to continue its breakout towards 3,700.000 USD, supported by strong buying sentiment and technical indicators backing the bullish trend.
We continue to see strong investor preference for gold as the USD weakens, especially amid expectations of economic stability.

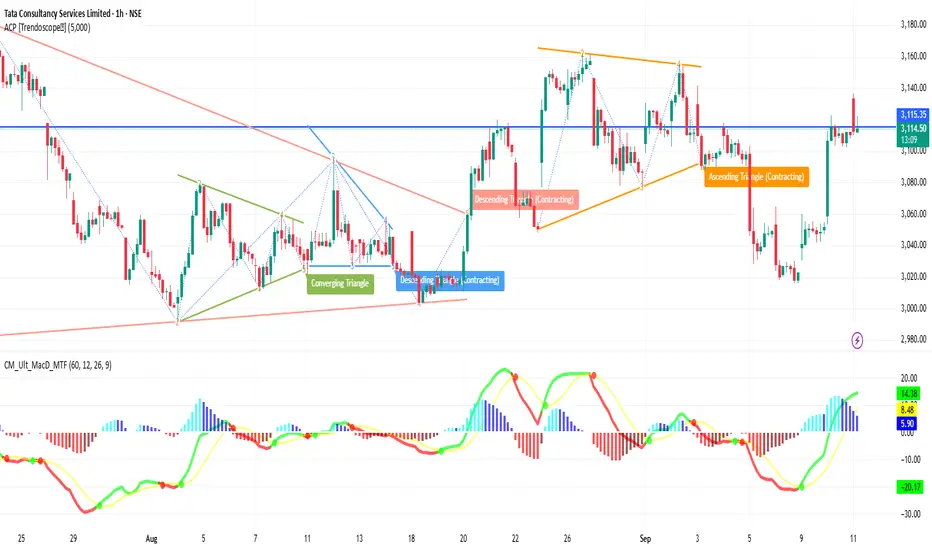
TCS 1H Time frameTCS 1-Hour Snapshot
Price is around ₹3,110
Showing small gains in recent sessions
Has been under pressure from broader IT sector weakness, but holding above some short-term support
🔎 Technical Indicators & Trend
Moving Averages (short-term hourly) are slightly below current price → providing support
Medium-term MAs (50-hour etc.) are above → resistance overhead
RSI (hourly) is moderately neutral—neither strongly overbought nor oversold
Trend strength appears modest; no sharp momentum bars or volume spikes indicating breakout
🔧 Support & Resistance Levels (1H)
Support: ~₹3,080–₹3,090 first support zone
Resistance: ~₹3,130–₹3,140 nearby resistance
🧭 Short-Term Outlook
Bullish Case: A break above ~₹3,130-3,140 with volume could push toward ~₹3,160
Bearish Case: If it fails to break resistance and drops below ~₹3,090, possible move toward ~₹3,060
Overall Bias: Slightly bullish to neutral; waiting for confirmation from resistance breakout
Bulls Pausing, Bears Hopeless? Gold Awaits CPI TriggerGold is currently taking a breather after its strong bull run, just as highlighted in the last couple of updates. On the daily chart, price action is consolidating within the 3620–3650/55 zone, and with CPI data lined up today, a breakout from this range could set the next decisive move.
Sentiment-wise, bulls remain in full control, while bears look like they’re running out of steam. Still, a healthy reset is overdue after such an extended rally. From a price action perspective, there are no clear signs of reversal on any major timeframe yet. The key support to watch remains 3600 on a daily closing basis. As long as price holds above this level, the bullish structure is safe.
If 3600 gives way, we could see a deeper pullback toward 3589 (Fib 0.236 support) and then into the 3550–55 zone, which stands as the next strong secondary support. Until then, consolidation here should be treated as part of the ongoing bullish cycle rather than a trend reversal.

XAUUSD: Breaking Through ResistanceXAUUSD is currently trading within a clear uptrend channel, with strong support at 3,620. The 1-hour chart shows that gold has bounced strongly from this support level, confirming that the uptrend remains intact. With support from EMA 34 and EMA 89, XAUUSD is likely to continue its upward momentum and target higher levels.
The current uptrend channel shows the price is moving within a clearly defined range, with higher lows consecutively forming. The next resistance is at 3,680, and if gold breaks through this level, it could extend its rise toward higher targets. The 3,620 level remains a crucial support, and as long as the price stays above this level, the chances of further increases are high.
Impact of News
With the forecasted PPI dropping from 0.9% to 0.3%, this could reduce inflation expectations and weaken the USD, providing favorable conditions for gold to continue rising.

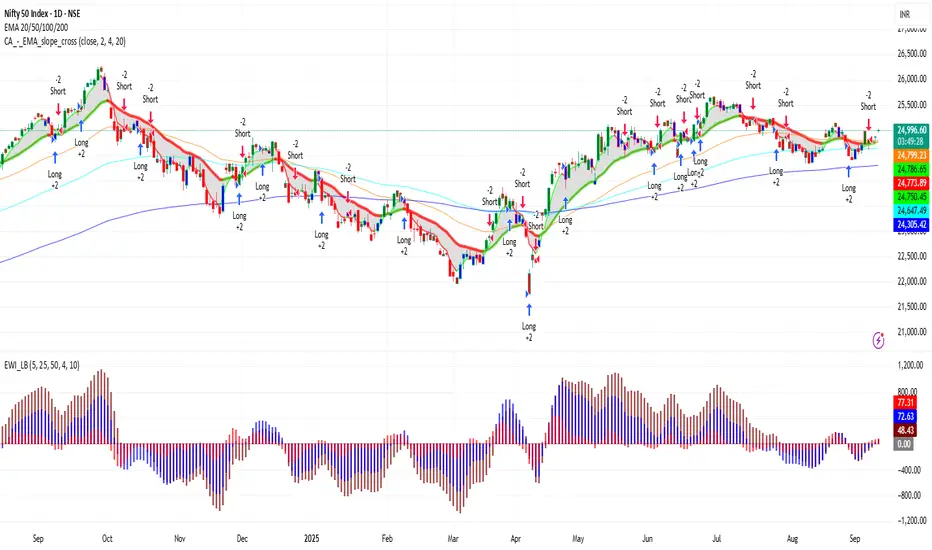
NIFTY 1D Time frame📍 NIFTY – 1D Important Levels
🔹 Support Zones
22,200 – 22,300 → Immediate daily support
21,900 – 22,000 → Strong support zone; buyers likely to step in here
21,500 – 21,600 → Major support; breakdown may shift trend to bearish
🔹 Resistance Zones
22,700 – 22,800 → Immediate daily resistance
23,000 – 23,100 → Strong resistance; breakout may fuel next leg higher
23,400 – 23,500 → Major resistance; if crossed, long-term bullish momentum strengthens
⚖️ Daily Trend Outlook
Nifty is currently in a bullish trend on the daily chart, making higher lows and sustaining above key moving averages.
Momentum remains strong as long as price holds above 22,200.
A breakout above 22,800 will likely push the index toward 23,000 – 23,500.
A breakdown below 22,200 could invite selling pressure toward 22,000 – 21,600.
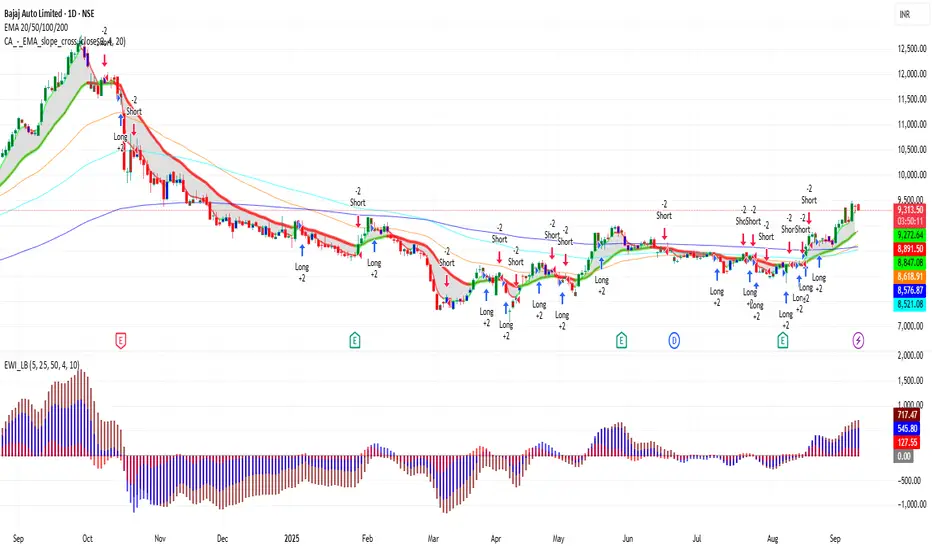
BAJAJ_AUTO 1D Time frame📍 BAJAJ_AUTO – 1D Important Levels (Current)
🔹 Support Zones
9,050 – 9,100 → Immediate daily support
8,800 – 8,900 → Strong support; buyers likely to defend this zone
8,500 – 8,600 → Major support; breakdown here may shift trend bearish
🔹 Resistance Zones
9,300 – 9,400 → Immediate daily resistance
9,550 – 9,650 → Strong resistance zone; breakout may extend upside momentum
9,800 – 10,000 → Major psychological resistance; if crossed, bullish trend strengthens further
⚖️ Daily Trend Outlook
Bajaj Auto is in a bullish structure on the daily chart, forming higher lows.
As long as price stays above 9,050, the stock remains positive.
A breakout above 9,400 – 9,650 can take it towards 9,800 – 10,000.
A breakdown below 9,050 could drag it towards 8,900 – 8,600.
TATAMOTOR 1H Tata Motors – 1 Hour Chart Analysis
🔹 Trend Overview
On the 1-hour chart, Tata Motors is currently showing bullish momentum with higher highs and higher lows.
However, price is also facing some resistance near the upper range, so intraday swings are possible.
🔹 Key Levels to Watch
Immediate Support Zone: around ₹706 – ₹709
Stronger Support: near ₹700
Immediate Resistance Zone: around ₹717 – ₹721
Major Resistance: around ₹734 – ₹735
🔹 Intraday Trading View
If price holds above ₹709, bulls may push towards ₹721 – ₹734.
If price slips below ₹706, a retest of ₹700 – ₹695 is possible.
Consolidation is likely in the ₹709 – ₹721 range before any major breakout.
🔹 Indicators (1-Hour Chart)
Moving Averages → Price trading above 20 EMA and 50 EMA, showing short-term strength.
RSI → Near the 60–65 zone, still bullish but close to overbought.
Volume → Slightly increasing on up-moves, showing buyers are active.
🔹 Summary
Bias: Bullish to range-bound
Support Levels: ₹706 / ₹700
Resistance Levels: ₹721 / ₹734
Intraday traders should watch the ₹709 – ₹721 band for breakout or breakdown trades.

XAUUSD 1H📍 XAUUSD – 1H Key Levels
🔹 Support Zones
$1925 – $1927 → Immediate intraday support
$1918 – $1920 → Stronger short-term support
$1910 – $1912 → Major support zone, breakdown could trigger deeper fall
🔹 Resistance Zones
$1935 – $1937 → First intraday resistance
$1945 – $1947 → Strong resistance area where sellers may re-enter
$1955 – $1960 → Major resistance; breakout above this can fuel a larger rally
⚖️ Quick Summary
Above $1935, bulls may push toward $1945 – $1960.
Below $1920, bears could drag price back to $1910 – $1900.
Range to monitor: $1920 – $1935 (decisive breakout will set next trend).
XAUUSD (Gold) – 1H Chart Analysis
🔹 Trend Overview
On the 1-hour chart, XAUUSD is currently showing short-term bullish bias but with nearby resistance.
Price action is making higher lows, but upside moves are facing supply zones.
🔹 Key Levels to Watch
Immediate Support Zone: $1918 – $1922
Major Support: $1910 – $1912
Immediate Resistance Zone: $1935 – $1940
Stronger Resistance: $1950
🔹 Indicators (1H Chart)
Moving Averages → Price trading above 20 EMA and near 50 EMA, showing short-term strength.
RSI (Relative Strength Index) → Around 60–65, leaning bullish but not overbought.
MACD → Positive crossover, momentum favoring buyers.
Volume → Buying volume spikes at dips, showing accumulation.
🔹 Intraday Trading Scenarios
Bullish Case
If price sustains above $1935, upside can extend to $1945 – $1950.
Breakout above $1950 opens path toward $1960+.
Bearish Case
If price drops below $1922, retracement towards $1912 – $1910 is possible.
Strong breakdown below $1910 may test $1900.
🔹 Summary
Bias: Mildly Bullish (as long as above $1920 support)
Support Levels: $1922 / $1910
Resistance Levels: $1935 / $1950
Traders should watch the $1920 – $1935 zone for the next decisive move.

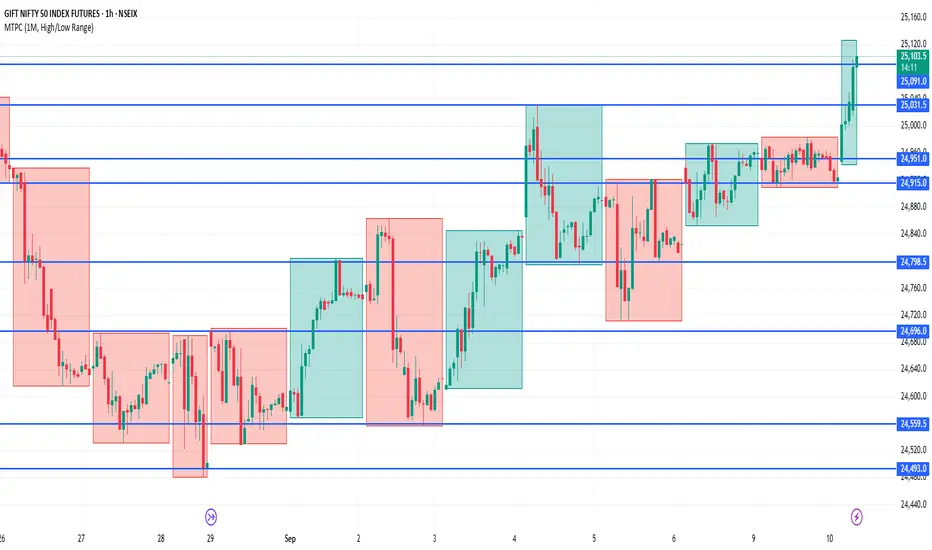
NIFTY1!📍 NIFTY1! – 1H Key Levels
🔹 Support Zones
22,450 – 22,500 → Immediate intraday support
22,350 – 22,400 → Stronger support, buyers likely active here
22,200 – 22,250 → Major support zone, breakdown can invite selling pressure
🔹 Resistance Zones
22,650 – 22,700 → Immediate resistance on 1H chart
22,800 – 22,850 → Strong resistance area, breakout may fuel rally
23,000 → Psychological and major resistance zone
⚖️ Quick Summary
Above 22,700, momentum may push Nifty Futures towards 22,850 – 23,000.
Below 22,450, weakness could drag price back to 22,350 – 22,200.
Current 1H trend bias is mildly bullish, but range-bound moves are possible between 22,450 – 22,700 before a breakout.
BTCUSD📍 BTCUSD – 1H Key Levels
🔹 Support Zones
$55,200 – $55,500 → Immediate intraday support
$54,500 – $54,800 → Strong support zone, buyers likely to defend here
$53,800 – $54,000 → Major support, breakdown here could trigger deeper correction
🔹 Resistance Zones
$56,800 – $57,000 → Immediate 1H resistance
$57,800 – $58,200 → Strong resistance, breakout can fuel further upside
$59,000 – $59,500 → Major resistance, likely to act as a supply zone
⚖️ Quick Summary
As long as BTCUSD trades above $55,500, short-term bias remains bullish.
Breakout above $57,000 may push price towards $58,200 – $59,500.
Breakdown below $54,800 may drag price back towards $54,000 – $53,800.
Current 1H bias: Range-bound to bullish, waiting for a breakout from $55,500 – $57,000 zone.

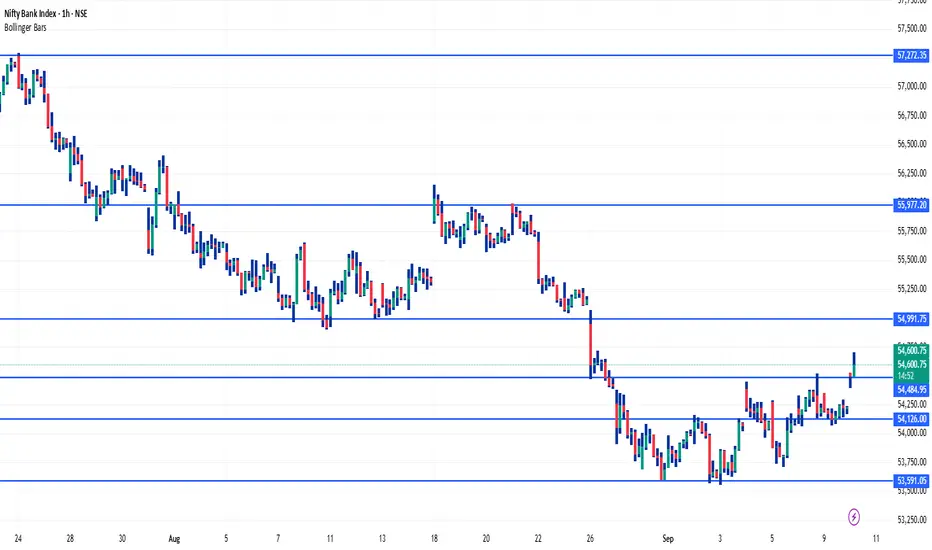
BANKNIFTY 1Hour Time frame📍 Bank Nifty – 1H Important Levels (Current)
🔹 Support Zones
47,800 – 47,900 → Immediate intraday support
47,400 – 47,500 → Strong support; buyers expected to defend here
47,000 – 47,100 → Major support; breakdown here can invite heavy selling
🔹 Resistance Zones
48,400 – 48,500 → Immediate 1H resistance
48,800 – 48,900 → Strong resistance zone
49,200 – 49,300 → Major resistance; breakout here may fuel a rally
⚖️ Quick Summary
Bias: Range-bound with a bullish tilt as long as Bank Nifty trades above 47,800.
Breakout above 48,500 can push towards 48,900 – 49,300.
Breakdown below 47,800 can drag the index to 47,400 – 47,000.
Current watch zone: 47,800 – 48,500.