SBIN 399 - Friday session review.SBIN(399) - Smart money has moved price higher to lock the profit takers around 330 region. As posted earlier, we will be keeping Our shorts below 408 and a breakdown of 393 for target 330. Though signals have confirmed breakdown, will be adding more positions on price breakdown confirmation.
M-oscillator


COPPER (26th FEB 21) Above 644.50, May Move Upside Till 647-652 On the Daily Chart copper is looking strong and also it has shown small profit booking in the morning session now if it will shift above 644.50 then it may go upside till 647 and 652. Low risk trader can go long above 644.50 with stop loss of 642.20 and safe stop loss will be day's low 641.50.


Varun Beverages at Recent Support and having MACD CrossoverVarun Beverages at Recent Support and having MACD Crossover

APLLTD looks good for longStocks looks good for long as per MACD Crossover and Stock taking support at 200 EMA so with Stoploss below 200 EMA it looks good to go Long at CMP

12 Feb Intraday LevelsTargets are marked in blue, they can act as support/resistance ... Trade what you see.
Book profits at every target or trail SL some points above/below target.

risk based trade - looking for some profit booking based on over bot concept
looking for profit booking from here
rsi - 84 + = overbot
lower volume candles
note - risk based view
since there is still somewhere momentum towards bullish side
disclaimer - trade @ own risk


bearish in bajaj conrising wedge formed in day chart ,and adx giving negative divergence
but to confirm this we need rsi and mfi to be in over bought range currently RSI is at 60.4 & MFI at 63.1 and rising wedge need to be much closer but over all direction it is getting narrower i think in 1-2 weeks mfi and rsi will reach over bought ranges and rising wedge becomes much more narrower so stay cautious ,i think this might also indicate correction in nifty or may be results expected for bajaj con may be negative
thank you for reading this is not an trading advice ,trade at your own risk , this is purely my opinion

Marico | Resistance Breakout & Retest The same level 🎯⭕ Positional Trading opportunity ! Weekly Chart Alert !!! ⭕
--Buy above =402.10 or CMP
--Target = 499.30
--Stop-loss = 379
--Lot Size = 2000
--R:R = 4.3
--Expected Profit = 1,94,000₹ per lot (24 % )
--Expected Holding = 2-3 months only
#ThankU For Checking Out Our Content , We Hope U Liked IT 📌
======================================================
⭕ Technical Reasons to trade or Strategy applied :- ⭕
1) Stock broke the strong resistance
2) retracement is also done
3) Target is based on fib. trend
4) volume is also more than enough in breakout
5) No chance of fake Breakout .as it a weekly chart
6) rejection at support level i.e high wicks ..bullish candlestick pattern after retracement
Guys check out the related ideas as well, it will work really well GUARANTEED !
🙏FOLLOW for more !
👍LIKE if think is useful !
✍COMMENT Below your view !

weekly based buy - reasoning based on 3 time frame belowas per weekly chart 🥇
its a buy based on RSI which is higher then monthly rsi
supportive 4hour chart below⛳ :- resistance trend line broken
supportive 15 min chart below🪁 :- inside box based trade, though buy is above 89 which seems far as per time frame , yet shared as it shows consolidation
disclaimer - trade @ own risk

TCS - Possible breakoutTCS showing signs of a breakout from its levels. Has been in an uptrend and now slowly consolidating with smaller volumes. The price has crossed the resistance to reach ATH and retested the level successfully. The confirmation is obtained with a green candle in previous trading session. RSI is above 60 and also sma(9) of RSI > 60, which indicates strong bullish trend.
Annual results are also expected in few days and could be a positive note for rally to continue. Can go long with RR of 1:2.
* Views are personal, not investment advice or tips. For educational purposes only.

divergence set up - some basic learningwhat is Divergence ? 👇
Divergence is when the price of an asset is moving in the opposite direction of a technical indicator, such as an oscillator, or is moving contrary to other data. Divergence warns that the current price trend may be weakening, and in some cases may lead to the price changing direction
what is Oscillator ? 👇
An oscillator is a technical analysis tool that constructs high and low bands between two extreme values, and then builds a trend indicator that fluctuates within these bounds. Traders use the trend indicator to discover short-term overbought or oversold conditions.
how is Oscillator used in Trading ? 👇
Oscillators are chart indicators that can assist a trader in determining overbought or oversold conditions in ranging (non-trending) markets. Most traders use multiple oscillators to confirm range extremes and for determining the important entry and exit points.
🛑Indicators for spotting the divergence indicator patterns are the Awesome Oscillator, macd, the RSI, CCI or stochastic.🛑
disclaimer - personal view (can be wrong)

RSI Divergence A very good predictor for exhaustion of trend..
This is only for record...
When in strong trend keeping eye on RSI helps.
If RSI don't make new tops/bottoms there is high
probability of trend reversal.
There can be one more attempt by price to move in direction
of trend before reversing so this only needs to be used
as supporting indication.

TATA Power Thursday StrategyRSI bullish divergence forming and also RSI at oversold level and price at Monthly Breakout Level which is 75. Expecting Bullish Turn tomorrow.


bank nifty RSI based observationDAILY RSI = 73
4H RSI = 68 ( ABOVE 65, LESS THEN DAIILY RSI)
HOURLY RSI = 65 ( @65, LESS THEN 4H RSI)
15mn RSI = 56 (LESS THEN HOURLY RSI)
🛑OBSERVATION🛑 :-
ABSOLUTE MOMENTUM IS BULLISH ON ALL TIME FRAMES
RELATIVE MOMENTUM SEEMS ON WEAK SIDE
SUCH SITUATION CAN BE INTERPRETED AS
OVERALL BULLISH TREND BUT WITH SIDEWAYS MOVE
disclaimer - for study purpose only.

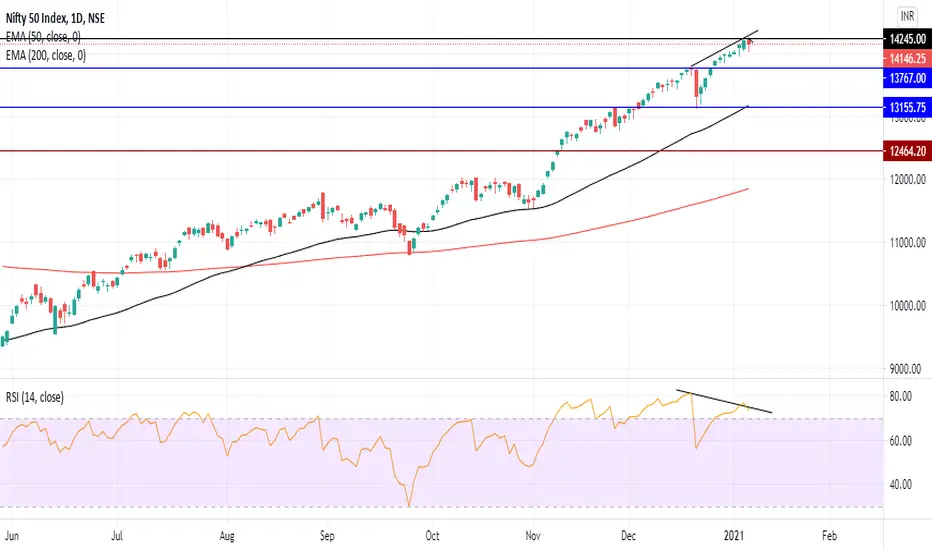
Nifty RSI DivergenceShowing some exhaustion signal.
Wait and watch if there is one push still balance
before some correction.

Bullish pattern of Grasim Industry Ltd Price has crossed monthly resistance of 955 and now moving towards 1100.