Gold Holds Strong Above $3,335 – Is $3,390 the Next Target?Hey traders!
Let’s take a quick look at what’s happening with gold today
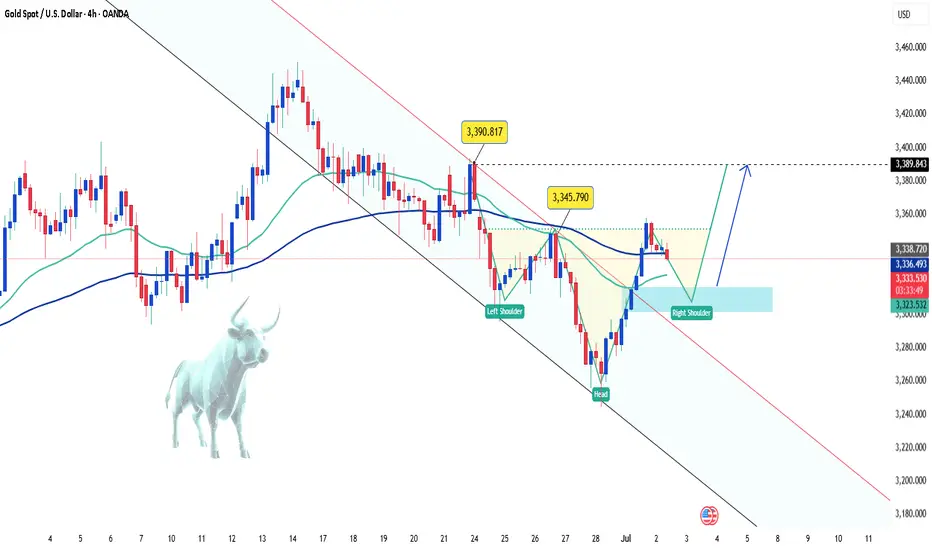
Gold continues to hold its impressive bullish momentum, trading firmly above the $3,335 mark. The rally is fueled by a sliding US dollar and declining US Treasury yields, which are driving investors toward safe-haven assets like gold.
The US Dollar Index (DXY) has dropped to its lowest level since early 2022, while the 10-year Treasury yield sits around 4.19%. These conditions give the Federal Reserve more room to consider rate cuts—supporting gold’s upside.
Adding to the bullish case, fresh data shows a recovery in US manufacturing, further boosting demand for gold.
📈 On the technical side, gold is moving just as we anticipated: it’s broken out of the descending channel and is currently forming a bullish inverse head and shoulders pattern. If the pattern completes, we could see the next leg higher pushing toward $3,390.
What do you think — is gold ready for another breakout?
Drop your view below! 💬
M-signal
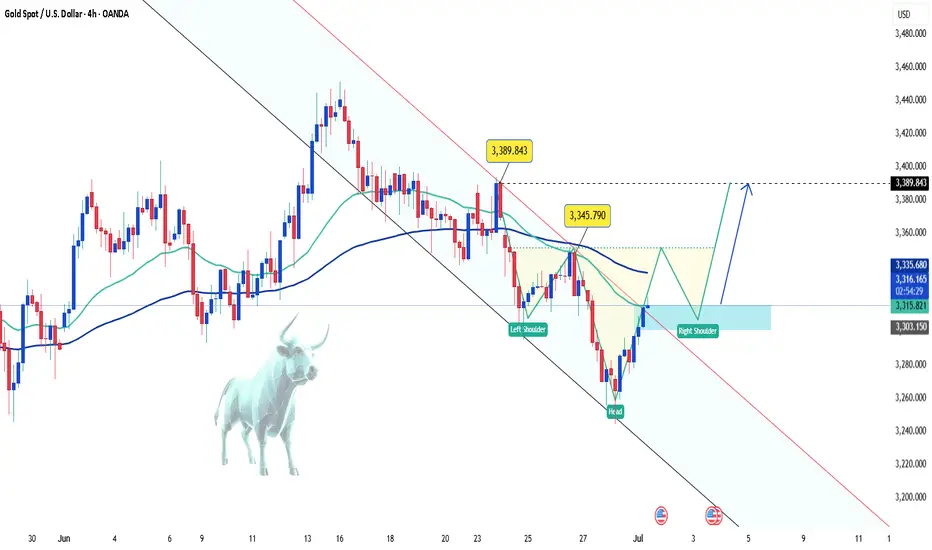
Gold Rises as Quarter Ends – Can Bulls Push Toward 3,345?June 30 marks the final trading day of both the month and the quarter, making it a key session for technical traders. On Monday, gold edged higher, supported by a weakening U.S. dollar. The greenback slid against the yen and dropped to its lowest level in nearly four years versus the euro, fueled by market optimism around U.S. trade deals. This helped reinforce expectations that the Federal Reserve might cut interest rates earlier than previously anticipated—giving gold the boost it needed to break above the 3,300 USD barrier.
From a technical perspective, short-term momentum now favors the bulls after a clear breakout above the descending parallel channel. If this move holds, the next upside target is projected near the 3,345 USD zone, as highlighted on the chart.
However, be careful because this can also be a fake breakout.
Bear Flag Breakdown Looms on XAUUSDGold (XAUUSD) is currently forming a clear bear flag pattern on the H1 chart, signaling a weak corrective move within a dominant downtrend. The 5-wave structure (1 to 5) inside the flag indicates limited bullish momentum. If the lower trendline breaks, gold could plunge toward the key support zone at 3,295 USD.
On the news front, the ceasefire agreement between Iran and Israel brokered by the U.S. has significantly reduced geopolitical risk, weakening the demand for safe-haven assets like gold. In under 48 hours, gold lost over 60 dollars, reflecting the market's rapid shift toward risk-on sentiment. Additionally, speculative money is flowing out of precious metals and into growth assets, adding further downside pressure.
Given this confluence of technical and fundamental factors, I lean strongly toward a bearish continuation, with a likely breakdown of the flag pattern. As long as price remains below the EMA 89 (around 3,342 USD), the short-term trend favors the bears.
Are you ready for the next leg down?

Gold at Make-or-Break Zone – Will Sellers Strike Back?Gold is staging a rebound, but don't let it fool you — the real battle is just ahead.
After last week's sharp drop, the price is now approaching a key resistance near 3,355, where the 34 and 89 EMAs meet a supply zone. This is not just any level — it's the perfect spot for sellers to step in.
Meanwhile, markets are bracing for high-impact US data this week, including Core PCE and Q1 GDP. If inflation runs hot, it could crush gold’s momentum and fuel another leg down.
If rejection happens here, gold could drop back toward the 3,265 zone. Bulls need a breakout to regain control — but right now, the edge leans bearish.
Are you ready for the next move?

EUR/USD Stuck in a Box – Breakout or Breakdown Ahead?EUR/USD is currently moving sideways within a narrow range around 1.1700–1.1750, as traders await key economic data from both the US and the Eurozone. The chart reflects a consolidation phase, with repeated resistance tests but no clear breakout yet.
This week, the euro remains under pressure after the ECB delivered a more dovish tone than expected, reinforcing the view that interest rates in the euro area may stay unchanged for longer. Although inflation data has stabilized, the euro’s recovery momentum has stalled.
Looking ahead, EUR/USD must break above the 1.1740 resistance zone to resume its longer-term bullish trend. Otherwise, the bearish pullback scenario, as outlined in the chart, could come into play.
What’s your take — will we see a breakout, or is a correction coming first? 📉📈
Share your view in the comments!

Update the latest gold price todayGold kicks off the new week with a sharp drop, sliding to around $3,258/oz, down more than $14 from Friday’s close. The primary driver behind this decline is the easing geopolitical tension in the Middle East, following a ceasefire agreement between Israel and Iran, which has significantly reduced demand for safe-haven assets.
In addition, stubborn inflation and weak global growth are forcing central banks — especially the Federal Reserve — to keep interest rates elevated for longer. This policy stance continues to pressure gold prices.
From my perspective, gold had surged too quickly in recent weeks due to geopolitical risks. Now that those tensions have calmed, capital is flowing out of gold and rotating into risk-on assets like stocks, bonds, and real estate.
Looking ahead, this week brings a wave of high-impact economic data from the US, Eurozone, China, and Japan — including the June PMIs from the US and China, and preliminary CPI from the Eurozone. These releases are likely to shape gold’s short-term direction.
For now, the bearish bias remains, with $3,300 acting as a key resistance level to watch.

Gold in Free Fall – Is This Just the Beginning?Hey fellow traders!
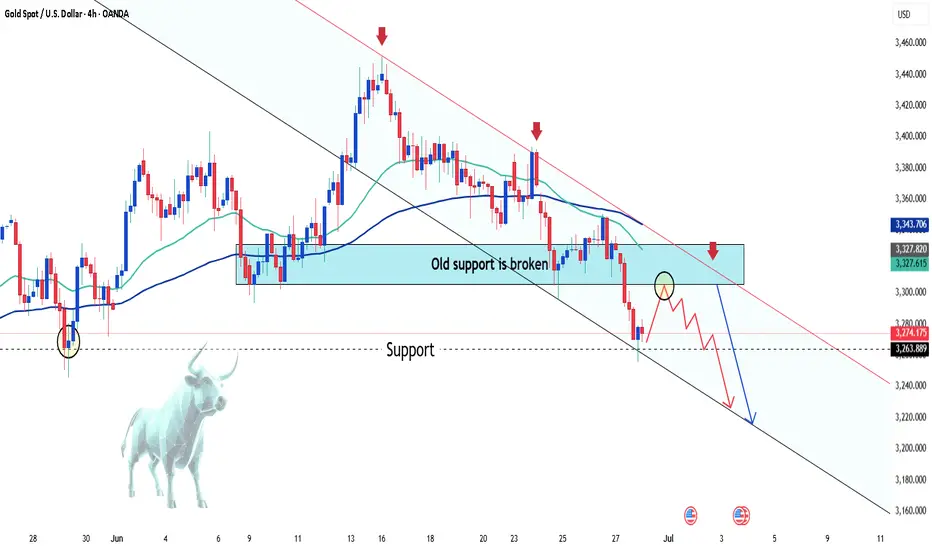
Today, gold is taking a serious dive — price has crashed below the critical $3,300 support, and things aren't looking great for the bulls. The chart says it all: the old support zone has been wiped out, and the recent minor bounce? Just the calm before a deeper selloff.
💣 What’s dragging gold down?
-The reasons are crystal clear:
-US Treasury yields are spiking, pulling capital away from gold.
-The US dollar is rebounding strongly, boosted by hawkish Fed commentary.
Global markets are optimistic, with geopolitical tensions easing — which means gold is losing its safe-haven appeal.
In short: there's not much left to keep gold afloat right now.
📉 Technical outlook – Breaking down and breaking lower?
On the H4 chart, gold has officially lost the EMA 34 (~$3,322) — a key dynamic support that's held multiple times in the past. With that breach, sellers rushed in. Price is now sliding toward the bottom of the descending channel, targeting $3,240, and possibly $3,200 if bearish momentum continues.
And if gold pulls back to retest the broken zone? Don’t celebrate too soon — it could be the perfect trap for sellers to reload.
So, what’s your take?
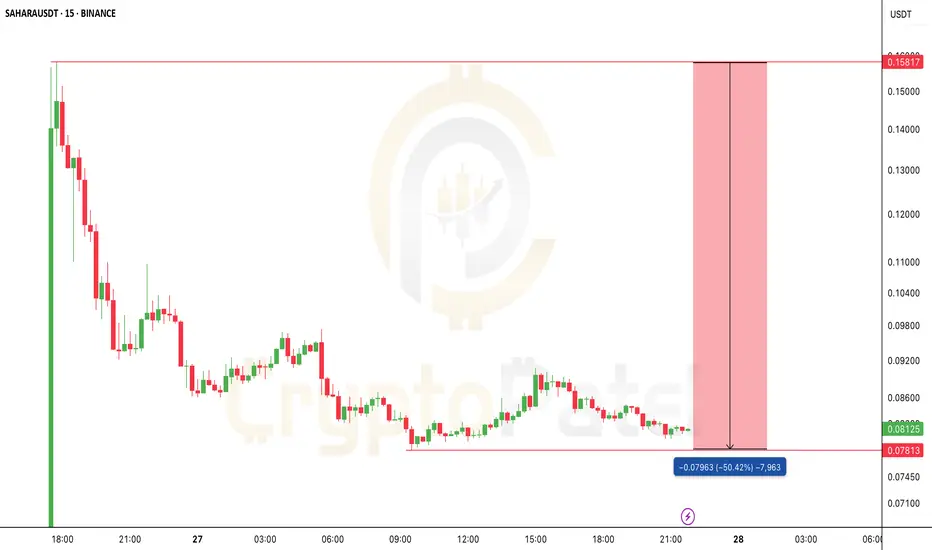
New traders, read this before chasing the next listing pumpNew traders, read this before chasing the next listing pump:
BSE:SAHARA dropped 50% right after launch — but early investors still sit on 10x+ gains from seed.
Why? They got in at
Seed: $0.005
IDO: $0.06
Binance top buyers? Wrecked.
✅ Always study tokenomics
✅ Know seed + public round prices
✅ Let the hype settle before entries
Smart money waits. FOMO gets dumped on.
What’s your rule before buying a new listing?
EURUSD Bulls in Charge – Can They Push Higher?EURUSD continues to demonstrate strength, maintaining a clear uptrend on the H4 timeframe. After breaking above the former resistance zone near 1.1600, price surged and is now consolidating around 1.1706. This breakout confirms strong bullish momentum, especially following a long period of consolidation.
That said, the area around 1.1730–1.1740 is showing signs of minor rejection, with a potential double-top pattern emerging. However, this appears to be a healthy pullback within the broader bullish trend.
The most reliable support is currently found at 1.1620, which also aligns with the EMA 34 — a dynamic level that has acted as a pivot throughout this rally.
As long as price remains above 1.1620, the bullish trend remains firmly intact.

Gold Pullback in Play – Will $3,300 Be Hit Today?Hello traders!
What’s your take on gold today?
OANDA:XAUUSD remains tilted to the downside, currently trading around $3,318, down over 100 pips on the day.
The bearish bias is still favored — and the reason is pretty clear. For short-term traders using pattern-based setups, gold has broken out of a flag pattern and successfully retested the breakout zone, confirming a potential reversal.
If this momentum holds, the next target could be $3,300 by the end of the day.
Do you agree with this scenario?

EURUSD Breaks Free – Is the Rally Just Beginning?After several days of bearish expectations, EURUSD has finally regained its bullish momentum. The pair surged sharply, breaking out of the descending channel and climbing from 1.146 to 1.162 at the time of writing.
The current resistance zone is being tested, yet buyers remain supported by strong technical factors, notably the stability of EMA 34 and 89.
On the fundamental side, expectations that the Fed will keep interest rates steady—reinforced by dovish remarks from Chair Powell before Congress—alongside a weakening USD due to easing geopolitical tensions and reduced euro-hedging by European funds, have fueled fresh demand for the euro.
What about you—do you think EURUSD will continue to rise or pull back from here?

Gold Slips Sharply Ahead of Key US DataGold (XAUUSD) kicked off the week with a steep decline, currently hovering around $3,345 — down over 200 pips from the session’s open. This move unfolds just ahead of a series of major US economic releases, including PMI figures, Q1 GDP, and most importantly, the Core PCE Index — the Fed’s preferred inflation gauge.
Markets are anticipating that Core PCE will remain elevated, reinforcing the case for prolonged high interest rates, which in turn adds pressure on safe-haven assets like gold.
From a technical perspective, the short-term chart has just formed a price GAP. If buyers capitalize on this setup, there’s a potential opportunity to target a gap fill. However, bearish pressure remains strong. If any recovery fails to break above the $3,389 resistance zone, traders should consider sticking with the prevailing downtrend.
Wishing you a successful trading day ahead!

$ETH BLOODBATH: -15% Dump! Next Stop $2100? CRYPTOCAP:ETH BLOODBATH: -15% Dump! Next Stop $2100?
I shorted right from $2862 — nailed the move.
Now trading below critical $2550 support.
👉 Hold $2550? Reversal towards $3000-$4000 possible.
👉 Lose it? We likely fill $2100-$2200 FVG — 0.618 fib at $2116.
$2860 remains THE level to watch for a New ATH.
💬 Comment your ETH target!
🔁 Retweet if this helps your gameplan.

Founder’s Wallet HACKED → $4M Gone → $MASK Crashes! Full Story IFounder’s Wallet HACKED → $4M Gone → NASDAQ:MASK Crashes! Full Story Inside
Dropped -51% in few hours! 😱
*Here’s the FULL story you need to know:*
🟥 Founder’s Wallet HACKED → $4M stolen!
🟥 Big WHALE dumped $2.1M worth of MASK on Binance!
🟥 Binance DELISTING rumors caused PANIC SELLING!
Result? Massive crash — from $3.73 → $1.735 in just HOURS!
🔥 Is this the BOTTOM? Or will it DUMP more?
🔥 Are smart traders BUYING this DIP?
👉 I’ll be tracking NASDAQ:MASK LIVE — join my channel & stay ahead of the next BIG MOVE!

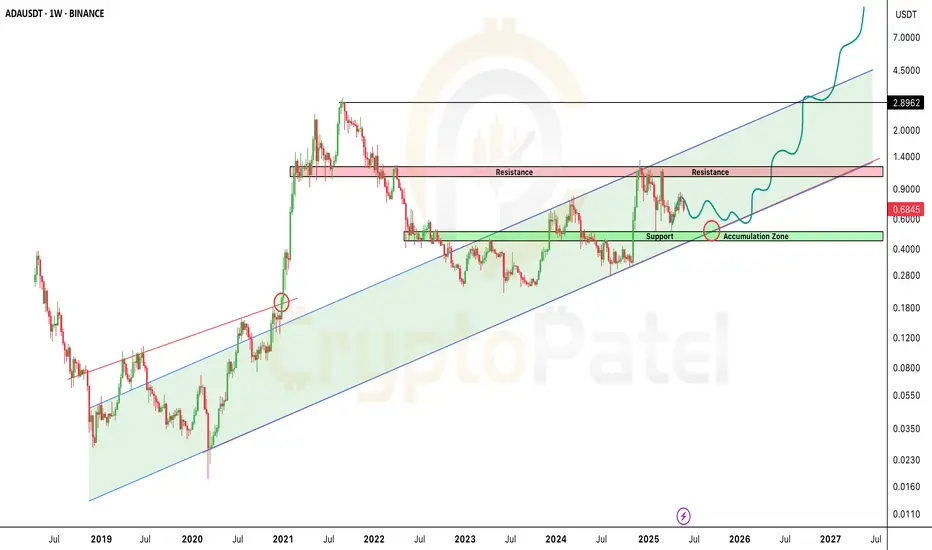
ADA Sitting on Strong Support — Next Big Move Loading?🚨 ADA Sitting on Strong Support — Next Big Move Loading?
Cardano has dropped to around $0.68, but guess what? It's sitting on a major support zone in a long-term bullish channel!
🟩 Accumulation Zone: $0.60–$0.40
This is where smart money enters… historically a STRONG buy zone!
🟥 Next Resistance: $1–$1.20
Break that — and ADA could fly toward $5–$10+ in the coming bull run!
The chart is screaming MEGA RUN ahead — if you're bullish on ADA long-term, this might be your signal.
Not financial advice, but the setup looks Strong.
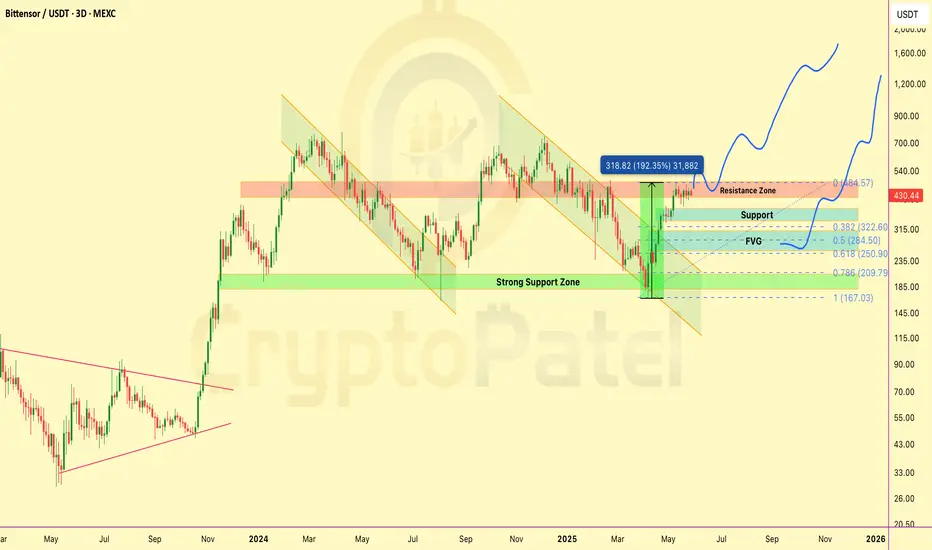
This AI Coin Could Go to $3,000 — But First, It Might Fall 50%!LSE:TAO Technical Analysis – Altseason AI Gem Update
LSE:TAO has been one of the most bullish AI coins this cycle — pumping over 200% in just 2 months without any major pullback. But now, things are getting interesting.
Current Price Action:
▶️ Trading near strong resistance at $480
▶️ Holding steady above $400 support zone
▶️ A breakout above $500 could open the gates to $1,000 → $2,000+ in this bull run!
Retracement Watch:
▶️ After such a strong rally, a correction is likely
▶️ Expecting 0.5 Fib retracement → $284 (–35% drop)
▶️ In worst-case scenario: 0.618–0.786 Fib → $250–$230 (–50% drop)
Accumulation Zone:
$200–$250 is the golden pocket for high-reward entries. Best zone to accumulate before the next leg up.
Target Levels for This Bull Run: $500 → $1,000 → $1,500 → $2,000 → $3,000
Chart Invalidation: If price breaks below $200, this bullish outlook gets invalidated.
Stay patient. Big dips bring big opportunities.
GOLD (XAUUSD) – 4H Bearish Setup🔍 Chart Structure
Pair: Gold (XAUUSD)
Timeframe: 4H
Bias: Bearish
Current Price: ~$3,192
🔻 Technical Analysis
1. Bearish Flag / Channel Formation
Price has been trending down within a descending parallel channel.
A breakdown from the channel has occurred, confirming bearish continuation.
2. Break and Retest Pattern
Price has broken below the channel, retested the broken structure, and rejected.
A bearish rejection candle confirms that sellers are active at the supply zone.
3. Supply and Demand Zones
Supply Zone (Orange Box): Around $3,240–$3,275
(Price rejected here after retesting the channel break.)
Demand Zone (Target): Around $2,980
(Previous structure support; high liquidity area.)
4. Market Structure
Series of lower highs and lower lows confirms a strong bearish market structure.
Strong momentum candle broke structure at $3,200, validating bearish sentiment.
📉 Trade Plan – Sell Setup
Entry Zone Stop Loss Take Profit Target Risk:Reward
$3,190–$3,200 (retest area) $3,275 (above supply) $2,980 (demand zone) 1:3+
✅ Bearish Confluences
Confluence Details
✅ Bearish Channel Breakdown Confirmed by breakout and retest
✅ Supply Zone Rejection Bearish candle from $3,240–$3,275 zone
✅ Liquidity Below Clean move down to $2,980 expected
✅ Momentum Shift Strong bearish candles breaking minor supports
❌ Invalidation Zone
If price closes above $3,275, this bearish setup becomes invalid.
It would indicate strength from buyers and break the supply zone.
📊 Risk Management Tips
Wait for a bearish engulfing or strong rejection candle at the retest.
Use partial TPs around $3,100 and trail SL to secure profits.
Maintain strict SL above $3,275 supply zone.

Gold Under Pressure: Will Key Support Hold?Gold prices slipped slightly to around $3,230 in early trading today. The precious metal remains on the defensive due to a stronger U.S. dollar, rising U.S. bond yields, and renewed optimism surrounding the U.S.–China trade deal.
As long as this optimism continues, XAU/USD is likely to remain under pressure. The recent surge to record highs was driven by concerns over a global economic slowdown and rising inflationary pressures due to tariffs — but that rally quickly faded, failing to hold its peak.
From a technical perspective, the 4H chart shows that gold has dropped below the EMA 34 and EMA 89, with a clear confluence between the EMAs and a marked resistance zone, which also aligns with the 0.618 Fibonacci retracement level.
If price fails to break above this resistance with strong momentum, the downtrend could continue, leading to deeper corrections in the near term.

Gold Under Pressure: Waiting for the Next Big MoveEarlier today, gold wrapped up the week around $3,320/ounce, falling about $53 from the previous night's peak at $3,373. This drop feels like a natural reaction as market flows begin to shift direction.
The main driver behind the pullback was a stronger U.S. dollar, fueled by easing concerns over the global economy. At the same time, rising U.S. bond yields made non-yielding assets like gold less attractive to investors.
Additionally, progress in U.S. trade talks with other nations further reduced the immediate demand for safe-haven assets like gold.
That said, I believe the market is now in a "holding pattern," awaiting key U.S. economic data — especially the upcoming inflation report from the Fed. If the numbers confirm economic stability, gold may face additional short-term selling pressure.
Bottom line: This is a time to trade cautiously. Focus on how gold reacts around major support zones and adjust strategies based on fresh economic data.
Wishing everyone safe and successful trading!

Gold Rebounds Sharply After Steep DropAfter plunging $91 to close at $3,288 in yesterday’s session, gold staged an impressive comeback this morning, surging over 700 pips to reach the $3,360 area.
This sharp price swing was largely driven by a mix of news catalysts. U.S. President Donald Trump stated he has no plans to remove Fed Chair Jerome Powell, but called for more aggressive rate cuts—boosting the U.S. dollar and putting short-term pressure on gold.
At the same time, the IMF released its latest global outlook, projecting elevated inflation through 2026. This raised expectations for prolonged monetary tightening from central banks, capping gold’s upside potential. Additionally, a wave of profit-taking after gold's recent rally added to the downward correction.

GBP/USD Rebounds as Tariff Fears EaseThe GBP/USD pair climbed to around 1.3270 on Thursday, snapping a two-day losing streak. The recent softening in concerns over potential tariff threats from U.S. President Donald Trump triggered some selling pressure on the U.S. dollar, offering a short-term lift for the pound. The move suggests a possible shift in sentiment as traders reassess the immediate risks in the global trade landscape.

EUR/USD Holding Key Support – Eyes Set on 1.1555?Today, EUR/USD remains steady around the 1.1280–1.1300 support zone after a mild pullback. This area aligns with the EMA89 and an ascending trendline, suggesting that the risk of a deeper decline is limited for now.
✅ Key news: The USD is under pressure as markets expect the Fed to keep rates unchanged or pivot toward a more dovish stance. This supports the euro and helps maintain the pair’s upward momentum.
As long as the price holds above this support, a move back toward 1.1420 – 1.1555 remains very much on the table.

Gold Slides on Trump Remarks — But Trading Opportunities RemainGold (XAU/USD) fell over 1% in early Asian trading on Wednesday, currently hovering around $3,333. The drop came after U.S. President Donald Trump clarified that he has no intention of firing Federal Reserve Chairman Jerome Powell.
Trump stated, "The media tends to exaggerate things. No, I’m not planning to fire him. I just want to see him take a more active stance in cutting interest rates." This comment signaled reduced pressure on the Fed, which weakened gold's safe-haven appeal for the short term.
Gold also showed signs of pullback due to developments around Russia-Ukraine peace talks and U.S.-China tariff negotiations. While the long-term bullish trend has paused, the current dip presents new trading setups worth considering.
💡 Suggested Trade Ideas:
SELL XAU/USD:
Zone: 3432–3435
🎯 Take Profit: 3405 / 50–300 pips
🛑 Stop Loss: 3440
BUY XAU/USD:
Zone: 3286–3283
🎯 Take Profit: 3323 / 50–400 pips
🛑 Stop Loss: 3278
Stay calm, read the price action, and make your move when the market enters key zones.
Happy trading and good luck out there! 💰
