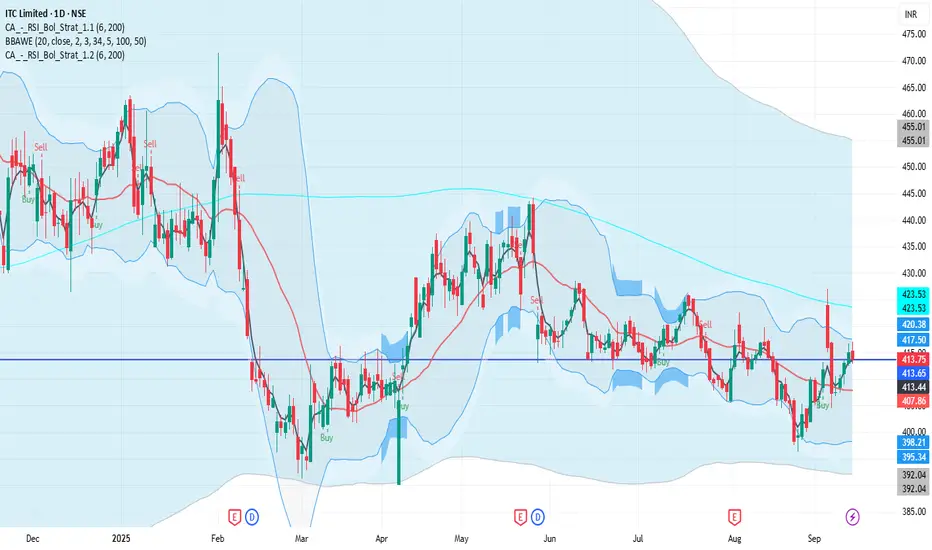
ITC 1D Time frame📉 Current Market Snapshot
Previous Close: ₹413.05
Day's Range: ₹412.85 – ₹417.05
52-Week High: ₹528.50
52-Week Low: ₹390.15
Market Cap: ₹5.18 lakh crore
Dividend Yield: ~3.47%
P/E Ratio: 25.9
ROE: 27.3%
ROCE: 36.8%
Debt-to-Equity Ratio: 0.00
Mahindraandmahindra
HINDZINC 1D Time frame📍 Current Price
₹462.95 (closing price)
Short-Term Outlook
Bullish Scenario: A sustained move above ₹470.00 could lead to a test of the 52-week high around ₹575.40.
Bearish Scenario: A drop below ₹440.00 may signal a potential pullback toward ₹430.00.

RELIANCE 1D Time frame📍 Current Price
₹1,395.00 (closing price)
Short-Term Outlook
Bullish Scenario: A sustained move above ₹1,400.00 could lead to a test of the 52-week high around ₹1,551.00.
Bearish Scenario: A drop below ₹1,375.00 may signal a potential pullback toward ₹1,350.00.

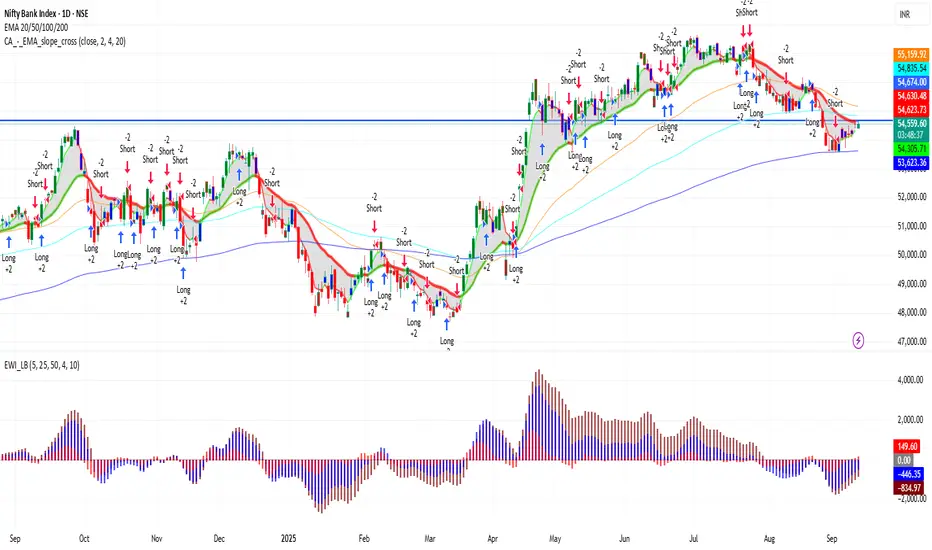
BANKNIFTY 1D Time frame📊 Current Snapshot
Current Price: ₹54,536.00
Day’s Range: ₹54,400 – ₹54,705
52-Week Range: ₹47,702.90 – ₹57,628.40
Previous Close: ₹54,216.10
Opening Price: ₹54,554.75
Market Cap: Approx. ₹3.78 lakh crore
Volume: ~77,647 contracts
📈 Trend & Indicators
Trend: Neutral to mildly bullish; trading near 50-day and 200-day moving averages.
RSI (14): 60 – Neutral; no immediate overbought or oversold conditions.
MACD: Positive → indicates bullish momentum.
Moving Averages: Short-term moving averages suggest neutral to slightly bullish outlook.
🔮 Outlook
Bullish Scenario: Break above ₹54,705 with strong volume could target ₹55,000.
Bearish Scenario: Drop below ₹54,400 may lead to further decline toward ₹54,000.
Neutral Scenario: Consolidation between ₹54,400 – ₹54,705; breakout needed for directional move.
📌 Key Factors to Watch
Banking Sector Performance: As BANKNIFTY comprises major banking stocks, sector-specific developments can influence index movement.
Economic Indicators: Changes in interest rates or inflation can impact index performance.
Global Cues: Developments in global markets can affect investor sentiment.
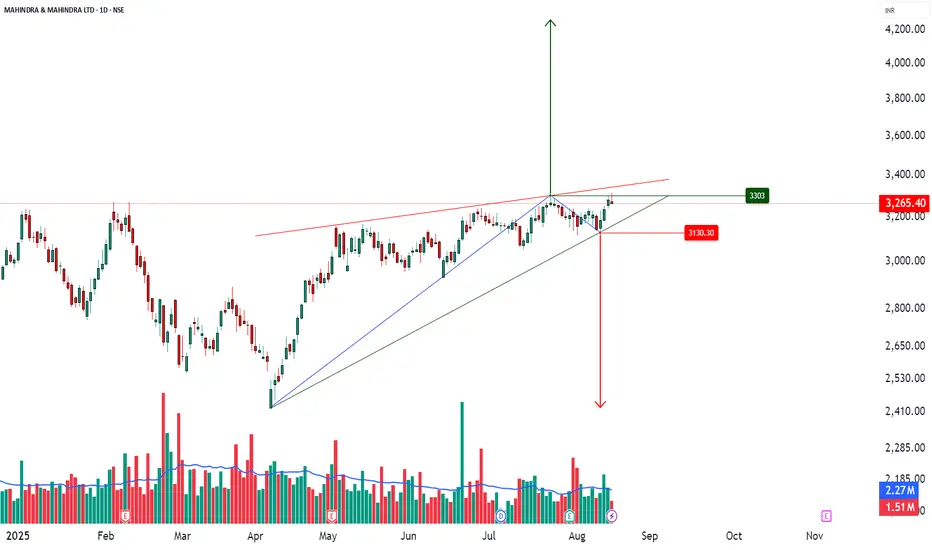
M&M FLAG PATTERN BREAKOUTM&M Breaking flag pattern on daily chart
with huge volume,good volume building last week
MACD crossover done
RSI bullish around 70
trading above 20 ema
target1 3600 target2 4000
retest level around 3300,sl 3050
DO YOUR OWN ANALYSIS BEFORE INVESTING

Nifty Auto Sector : A possible talk of the Town.The much talked sector of the Indian stock market is Automobile sector after the government slashed the GST rate from 28% to 18% for small cars and trimming effective tax on large engine SUVs.
Major gainer from the GST rate cuts were the companies dealing in passenger vehicles i.e. 4-wheeler & 2-wheeler.
1. Impact of rate cuts on Passenger Vehicles (2-wheelers)
a. Lower Price : India is a price sensitive market and the price cut will significantly boost the volumes as the entry level bikes and scooters will become affordable, a potential boost to the rural demand after a good monsoon this year.
b. Stock Makret reaction : HeroMoto Corp, Bajaj Auto and TVS Motors are the major beneficial of the GST reform. Analysts project mid to high sales growth in the 2-wheeler companies over the coming quarters as the sector will recover from the sluggish growth due to high inflation rate post-COVID .
c. Margin Expansion : Companies may pass most of the benefits to the consumers but could allow retention of a portion of the benefits, leading to improved Operating margins. Both demand boost and margin gains can be seen in premium models like Bajaj Pulsar, TVS Apache, Royal Enfield (Eicher Motors).
d. Impact on EV : EV scooters (Ola Electric, Ather, TVS iQube, Bajaj Chetak) already benefit from FAME-II subsidies. Now, with ICE two-wheelers getting cheaper, EV makers might face tighter price competition, but overall demand expansion will grow the entire category.
2. Impact of rate cuts on Passenger Vehicles (4-wheelers)
a. Price reduction fuels demand : GST cut on small cars, SUVs and large cars will reduce effective rate from 50%+ to around 40% making cars more affordable across segments, stimulating demand from middle class families as well as premium buyers.
b. Passenger Vehicles Boost : Maruti suzuki (small cars leader) is the biggest beneficiary as price sensitive buyers will return to showrooms. While M&M and Tata motors benefits from the SUVs, which remain the fastest growing category.
c. EV Four-Wheelers : GST cut makes ICE vehicles cheaper, but EVs (already taxed at just 5% GST) remain far cheaper on tax. Beneficiaries: Tata Motors (Nexon EV, Tigor EV), M&M (XUV400 EV, BE 6E, XEV 9E), Maruti (upcoming EVs).
3. Stocks and their YTD Returns
a. Hero Moto Corp (29.23%) : Dealing in 2-wheelers, the stock has giving good return and remain a hot stock as it had acquired 32.5% in Euler Motors, signaling entry into Electric 3-wheeler segment.
b. Bajaj Auto (4.18%) : Stock has delivered a Net profit of Rs. 2049 Crore (up~ 5.8%) while declaring a dividend too. The company has faces a potential "zero month" in August for EVs due to rare-earth magnet supply issues from China. Some brokerages remain neutral suggesting the stock is fully valued in the short term.
c. TVS Motors (46.78%) : Companies EV Expansion and its iQube saw 44% YoY growth. Company plans launching new EV Scooters and EV 3-wheelers.
d. Eicher Motors (36.47%) : Royal enfield recorded its highest quarter sale (~2.8 lakh units) and crossed 1 Million sales in FY25. Though, company will not be relaxed by the GST rate cuts as the premium Bikes (over 350 cc) will now be taxed 40% up from ~31%. Stock is creating new ATH high on the prospect of the Commercial vehicles as reduction of auto components costs by 7-8%. Better margins, improved volumes and healthy ROI in coming quarter, reinforces its growth outlook.
e. Maruti Suzuki (37%) : Maruti is the leading small car producers and will be the leading beneficial of the GST rate cut on small cars. The entry in the EV will also improve the company's portfolio and the upcoming festive season seeing the discounted rate of the GST may help boost the sales.
f. Tata Motors (-6.55%) : Company's outlook is mixed to cautiously optimistic, growth drivers include EV adoption and strong demand on the upcoming car models. Most analysts project modest upside in single digits.
g. Mahindra & Mahindra (19%) : Most beneficial of the GST rate as uniform rate of 40% across all SUVs, 18% on the small cars, 5% GST on tractor segment. The company has demonstrated impressive EV segment growth. The favorable GST reform, pent-up demand and strong booking will help company in good quarter numbers.
Indian Auto sector can be seen as a good sector to invest in for the upcoming quarter considering GST rate cuts, festive season demand and EV adoption.

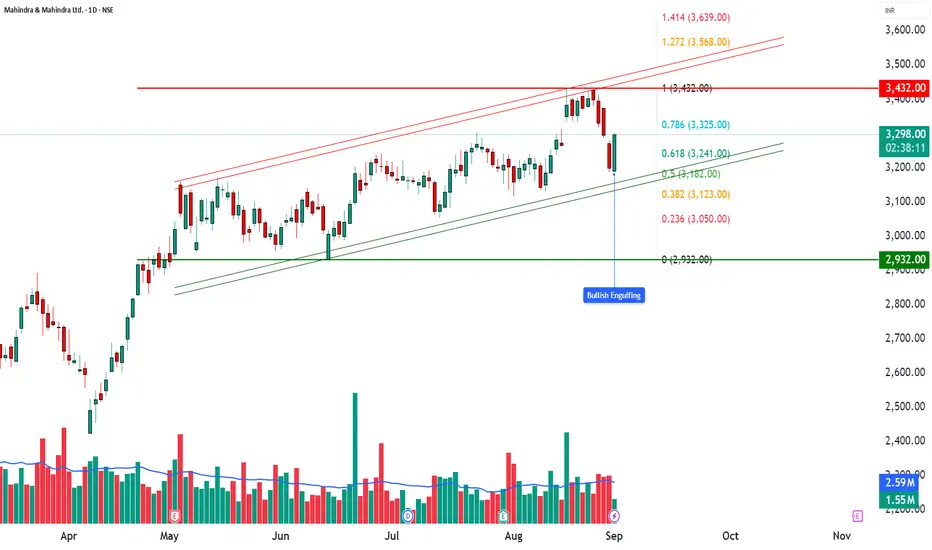
M&M | How to Trade a Bullish Engulfing in a Rising Channel🚘 M&M | How to Trade a Bullish Engulfing in a Rising Channel
📊 Stock: Mahindra & Mahindra Ltd (M&M)
⏳ Timeframe: Daily
📈 Chart Pattern: Rising Channel
🕯 Candlestick Pattern: Bullish Engulfing
________________________________________
🔹 Pattern Overview
M&M is currently trading within a Rising Channel, a structure that often reflects sustained bullish momentum. On the latest daily chart, a Bullish Engulfing candlestick has been formed, signaling renewed buying interest after a brief phase of consolidation.
________________________________________
The setup looks stronger with a Bullish Marubozu and an Open = Low candle, showing aggressive demand from the open. Price is holding well above VWAP, confirming bullish bias. A BB Squeeze Off signals volatility expansion ahead, while the recent false breakdown indicates sellers got trapped and buyers are back in control.
________________________________________
🔹 Key Levels to Watch
Resistance Zones: 3335 – 3374 – 3445
Support Zones: 3224 – 3152 – 3113
________________________________________
🔹 Technical Indicators Snapshot
RSI is at 52, sitting in the neutral zone but leaving room for upside momentum if buying picks up. The MACD shows a bearish crossover, which is an early caution signal to watch. CCI at -14 indicates neutral sentiment with no strong bias, while Stochastic at 55 is mid-range, suggesting neither overbought nor oversold conditions at the moment.
________________________________________
🔹 Candle Analysis
Candle 1 (Yesterday): High 3280 | Low 3187
Candle 2 (Today): High 3302.10 | Low 3191.10
👉 The today’s candle engulfed the previous session’s body, confirming the Bullish Engulfing pattern.
________________________________________
🔹 Trading View (Educational Insight Only)
A Bullish Engulfing inside a Rising Channel generally indicates continuation of the prevailing uptrend. If price manages to probably sustain above the 3335–3374 zone, it may signal strength for further upside. On the other hand, if the stock probably slips below the 3224–3152 support zone, it could lead to short-term profit booking.
________________________________________
📌 “All price levels mentioned are as observed at the time of writing and may change with market movements. Readers are advised to track live prices before making any trading or investment decision.”
⚠️ Disclaimer – Please Read Carefully
The information shared here is meant purely for learning and awareness. It is not a buy or sell recommendation and should not be taken as investment advice. I am not a SEBI-registered investment advisor, and all views expressed are based on personal study, chart patterns, and publicly available market data.
Trading — whether in stocks or options — carries risk. Markets can move unexpectedly, and losses can sometimes exceed the money you have invested. Past performance or past setups do not guarantee future results.
If you are a beginner, treat this as a guide to understand how the market works — practice on paper trades before risking real money. If you are experienced, always assess your own risk, position sizing, and strategy suitability before entering trades.
Consult a SEBI-registered financial advisor before making any real trading decision. By engaging with this content, you acknowledge full responsibility for your trades and investments.
💬 Found this useful?
🔼 Give this post a Boost to help more traders discover clean, structured learning.
✍️ Drop your thoughts, questions, or setups in the comments — let’s grow together!
🔁 Share with fellow traders and beginners to spread awareness.
👉 “If you liked this breakdown, follow for more clean, structured setups with discipline at the core.”
🚀 Stay Calm. Stay Clean. Trade With Patience.
Trade Smart | Learn Zones | Be Self-Reliant 📊
M&M Short term Swing trade with 1:3.5 RRIf Nifty holds its current level of 24,600 and is not bearish for next two-three trading sessions then
there are high chances that this setup will work and buyers will take control in M&M.
It is a supply & demand + Trend + Liquidity Trap based setup.
The setup looks good but the only concern is the overall market sentiment so take your risk accordingly.
Good Risk to Reward for first Target is 1:3.5
Let me know if you have any questions or doubts.
Happy to help!
Gaurav.

M&M _ Rising Wedge Formation📊 M&M – Technical & Educational Snapshot
Ticker: NSE: M&M | Sector: 🚙 Auto
CMP: ₹2,7XX (as of 16 Aug 2025)
Rating (for learning purpose): ⭐⭐⭐⭐
Pattern Observed: 📉 Rising Wedge Formation (Bearish Reversal Case Study)
🔑 Key Reference Levels (For Learning)
Support / Breakdown Zone: Lower wedge trendline
Resistance / Rejection Zone: Upper wedge trendline
Bearish Projection (Case Study): ~₹2,410
Bullish Continuation (Alternative View): ~₹3,300
📌 Pattern Observations
✅ Price forming higher highs & higher lows but within converging trendlines
✅ Momentum slowing → smaller swings inside wedge
✅ Typical bearish reversal structure (confirmation needed)
✅ Volume + RSI divergence can add conviction
📝 STWP Trade Analysis (Educational Illustration Only)
1️⃣ Bearish Breakdown (Primary Scenario)
Observation: Breakdown below wedge support often studied as bearish signal
Stop Loss (Learning Reference): Above upper wedge / recent swing high
Downside potential: ₹2,410 (measured move projection)
2️⃣ Bullish Breakout (Alternative Scenario)
Observation: Breakout above wedge resistance may lead to continuation
Stop Loss (Learning Reference): Below wedge / recent swing low
Upside potential: ₹3,300
📊 Risk Management & Confirmation
Traders typically wait for daily close outside wedge boundaries
Volume confirmation is key → spikes above average strengthen the move
RSI divergence often adds confidence to the setup
📌 Summary (Learning View Only)
The M&M Rising Wedge is a classic reversal study.
Key lesson: A wedge pattern teaches how slowing momentum can shift market control — but confirmation with volume + price close is essential before validating either direction.
⚠️ Disclaimer – Please Read Carefully
The information shared here is meant purely for learning and awareness. It is not a buy or sell recommendation and should not be taken as investment advice. I am not a SEBI-registered investment advisor, and all views expressed are based on personal study, chart patterns, and publicly available market data.
Trading — whether in stocks or options — carries risk. Markets can move unexpectedly, and losses can sometimes be larger than the money you have invested. Past performance or past setups do not guarantee future results.
If you are a beginner, treat this as a guide to understand how the market works — practice on paper trades before risking real money. If you are an experienced trader, remember to assess your own risk, position sizing, and strategy suitability before entering any trade.
Consult a SEBI-registered financial advisor before making any real trading decision.
By reading, watching, or engaging with this content, you acknowledge that you take full responsibility for your own trades and investments.
________________________________________
💬 Found this useful?
🔼 Give this post a Boost to help more traders discover clean, structured learning.
✍️ Drop your thoughts, questions, or setups in the comments — let’s grow together!
🔁 Share with fellow traders and beginners to spread awareness.
✅ Follow simpletradewithpatience for beginner-friendly setups, price action insights & disciplined trading content.
🚀 Stay Calm. Stay Clean. Trade With Patience.
Trade Smart | Learn Zones | Be Self-Reliant 📊
Learn Institutional Trading Part-4📌 What is Institutional Trading?
Institutional trading refers to the strategies, mindset, and techniques used by large financial institutions when they participate in the markets. These entities trade with huge volumes and require liquidity, accuracy, and control in their execution.
Unlike retail traders who might buy or sell a few lots or shares, institutions often enter with millions of dollars at a time. If they enter the market carelessly, they would move the price against themselves. Hence, they use highly calculated and strategic methods to enter and exit positions without creating obvious footprints.
These strategies are often referred to as Smart Money Concepts (SMC) — techniques that revolve around price manipulation, liquidity traps, and understanding market structure.
🎯 Why Do You Need to Learn Institutional Trading?
Most retail traders lose because:
They chase price.
They follow lagging indicators.
They get trapped in fake breakouts.
They trade based on emotions, not logic.
Institutional trading flips that mindset. You learn to:
Trade with the big players, not against them.
Identify where the real buying and selling is happening.
Understand why price reverses suddenly — often after retail entries.
Predict market moves based on logic and liquidity, not noise.
By learning how institutions think and act, you become a more disciplined, data-driven trader with higher probability setups and better risk management.
🧠 Core Concepts of Institutional Trading
Let’s dive into the most important concepts every institutional trader must understand:
1. Market Structure
Institutions operate within clear phases of market movement:
Accumulation: Smart money quietly builds positions in a range.
Manipulation: They fake breakouts or induce retail traders to create liquidity.
Expansion: The actual move begins in the intended direction.
Distribution: They offload their positions to late traders before reversing.
If you can identify these phases, you’ll always know where you are in the market — and what’s likely to come next.
2. Liquidity Pools
Liquidity is the fuel institutions need to place trades. They don’t use limit orders like retail traders. Instead, they seek zones with large clusters of stop-losses, pending orders, and breakout trades to enter and exit positions.
These zones are:
Swing highs and lows
Trendline breaks
Support/resistance levels
Retail breakout levels
You’ll often see the market spike into these areas and reverse — that’s not a coincidence. That’s institutional activity.
3. Order Blocks
An order block is a candle (usually bearish or bullish) where institutions placed large orders before a major market move. These zones often act as future supply and demand levels, where price returns to fill orders again.
Order blocks help you:
Identify powerful entry points.
Predict reversals or continuations.
Understand institutional footprints on the chart.
4. Fair Value Gaps (FVG)
A Fair Value Gap is a price imbalance between buyers and sellers — often created when institutions enter with speed and aggression. The market typically returns to fill this gap before continuing the trend.
FVGs are great for:
Entry confirmations
Predicting retracements
Identifying imbalance zones where price is “unfair”
6. Inducement & Mitigation
Inducement: Institutions create fake signals to trick retail traders into entering, generating the liquidity they need.
Mitigation: Institutions revisit previous zones to close old trades or rebalance positions — often creating hidden entries.
These tactics show how institutions intentionally manipulate price to maximize their position efficiency.
📊 Tools Institutional Traders Use
While many retail traders rely heavily on indicators like RSI, MACD, or Bollinger Bands, institutional traders focus more on:
Price action
Volume analysis
Open interest in options/futures
Liquidity maps
Time-based market behavior (sessions: London, NY, Asia)
Their edge comes from understanding what the market is doing, not what an indicator is telling them.
🧱 Institutional Risk Management
Institutions don’t gamble. Every trade is backed by:
Precise entry, stop-loss, and take-profit levels
Predefined risk percentages
Diversification and hedging
Capital allocation rules
They don’t revenge trade. They don’t overtrade. They focus on high-probability setups with calculated risk.
Retail traders can learn from this by:
Sticking to a trading plan
Managing emotions
Risking only a small % of their capital
Focusing on quality over quantity
📈 Institutional Trading in Action (Example)
Let’s say the market has been ranging for 3 days. Suddenly, price spikes up through a resistance level — a breakout! Retail traders jump in long.
But then, within minutes, price reverses sharply downward. Stop-losses are hit. Panic sets in.
What happened?
Institutions induced a breakout, used retail stop-losses as liquidity, filled their short positions, and now the real move — downward expansion — begins.
Understanding this flow helps you trade with the move, not against it.
👨🏫 Who Should Learn Institutional Trading?
This approach is ideal for:
Day traders looking for accurate short-term moves
Swing traders seeking strong trend setups
Options traders who want to align positions with institutional flow
Forex and crypto traders who want to stop chasing signals and start following structure
🚀 Benefits of Learning Institutional Trading
✅ Higher accuracy entries
✅ Better reward-to-risk ratios
✅ Less emotional trading
✅ Deeper understanding of price movement
✅ Freedom from lagging indicators
✅ Long-term trading consistency
🎓 Final Thoughts: Become the Hunter, Not the Hunted
Retail traders are often the prey in a game designed by institutions. But by learning institutional trading, you flip the script. You become the hunter — identifying setups, planning moves, and acting with precision.
Institutional trading is not about being right every time — it's about being strategic, calculated, and aligned with the flow of money

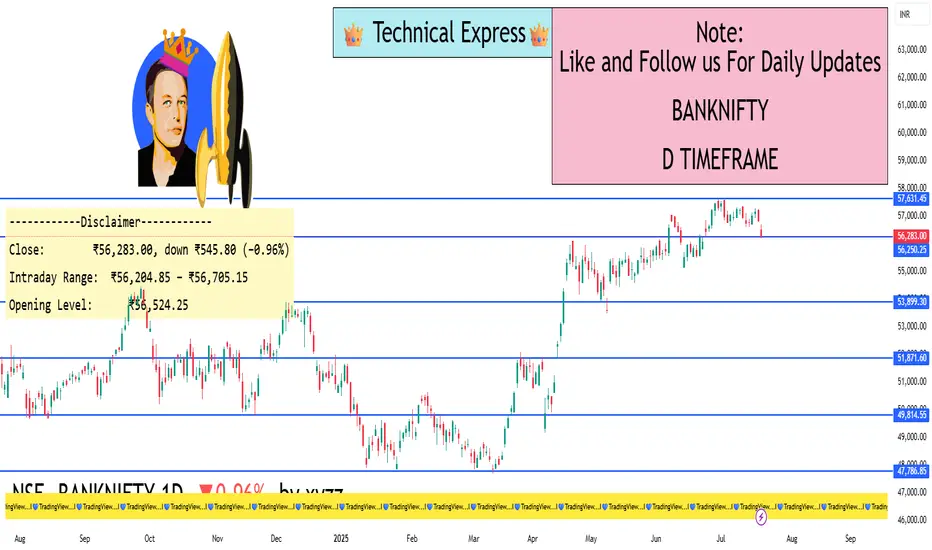
Bank Nifty – 1 Day Timeframe✅ Closing Summary:
Closing Price: ₹56,283.00
Change: −₹545.80 (−0.96%)
Opening Price: ₹56,524.25
Intraday High: ₹56,705.15
Intraday Low: ₹56,204.85
Bank Nifty showed broad weakness throughout the session, closing nearly 1% lower as major banking stocks came under pressure due to weak earnings and cautious sentiment in the financial sector.
🔍 Key Reasons for the Decline:
Earnings Pressure:
Axis Bank posted disappointing Q1 earnings, with higher non-performing assets and weaker loan growth.
This spooked investors, leading to sell-offs in other major banks like HDFC Bank, ICICI Bank, and Kotak Bank.
FIIs Turn Net Sellers:
Foreign Institutional Investors have been consistently selling financial stocks amid global uncertainty, which accelerated the downtrend.
Domestic buying was not strong enough to offset the outflows.
Global Economic Concerns:
Concerns about U.S. Fed interest rate hikes, inflation, and trade tensions globally made investors risk-averse.
Financials, being interest-rate sensitive, felt the brunt of the negative sentiment.
Technical Breakdown:
The index failed to hold above the crucial ₹56,500–₹56,700 range, which acted as a support in the previous few sessions.
This triggered technical selling and stop-loss hits.
📈 Technical Outlook (Short-Term):
Support Zone: ₹56,200 to ₹56,000
If this range is broken convincingly, the index could head toward ₹55,500.
Resistance Zone: ₹56,700 to ₹57,000
A move above this zone is needed for short-term recovery and renewed bullishness.
Indicators:
RSI (Relative Strength Index): Trending below 45, indicating growing bearish momentum.
MACD: Bearish crossover visible, confirming weakness.
Volume: Heavy selling pressure with above-average volumes shows institutional exit.
📆 Recent Trend Performance:
1-Day Return: −0.96%
1-Week Return: −1.12%
1-Month Return: +2.4%
6-Month Return: +14.8%
1-Year Return: +11.3%
Despite the day’s drop, medium- and long-term performance remains strong, backed by sector fundamentals and banking credit growth.
🧠 What Traders & Investors Should Know:
Intraday Traders: Can watch for bounce plays near the ₹56,200 zone, or short positions if ₹56,000 is broken with momentum.
Swing Traders: May wait for confirmation of reversal candles or bullish divergence in RSI before entering new long positions.
Long-Term Investors: Today’s fall could offer buy-on-dip opportunities, especially in quality private banks, provided fundamentals stay strong.
💬 Conclusion:
Bank Nifty faced strong bearish pressure in today’s session, largely due to disappointing bank earnings and negative institutional flows. With key support at ₹56,200 and resistance at ₹56,700–57,000, the next few days will be crucial to determine the short-term direction. If support holds, a technical bounce is possible. However, a breakdown below ₹56,000 could lead to deeper corrections
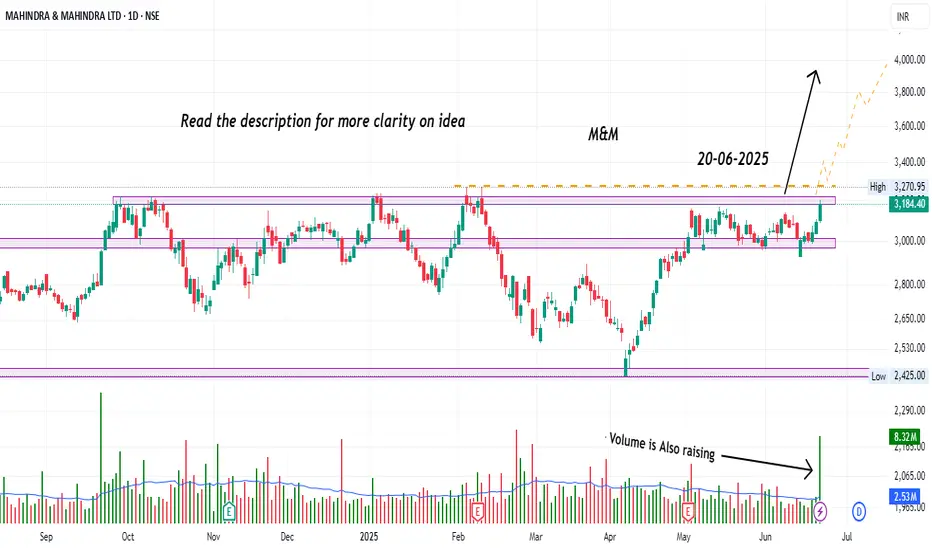
Mahindra & Mahindra – Activity Picking Up! Watch CloselyHey Family, here’s another stock showing a strong technical setup! 🚀
📈 Stock: Mahindra & Mahindra Ltd (NSE: M&M)
🔍 Key Observations:
📊 Chart Pattern:
The stock is displaying a Horizontal Breakout Setup from a well-defined multi-month resistance zone, dating back to 07-10-2021. This forms a strong bullish continuation base, indicating potential for a sustained move higher.
📈 Recent Price Action:
• M&M has recently tested the upper boundary of its resistance zone around ₹3,270, which has been respected multiple times in the past (notably on 18-06-2025 and 20-06-2025).
• The current close at ₹3,184.40 (+2.90%) on June 20, 2025, shows increasing buying momentum near this critical resistance level.
• Volume surged to 8.32M, significantly above average, confirming institutional participation and validating the price action.
📦 Volume Insight:
The volume spike on the breakout attempt signals strong accumulation. This is a vital confirmation factor for the bullish case.
💡 Trading Recommendation:
Aggressive Approach:
• Traders can consider participating based on the current price structure, using proper risk management techniques aligned with individual trading plans.
Conservative Approach:
• Alternatively, wait for a clear breakout confirmation with strong follow-through and closing strength above the resistance zone before considering entry. This helps reduce false breakout risks.
🧠 Rationale:
The recent price behavior, combined with heightened volume activity, reflects growing interest in the stock. Such conditions often signal a shift in market sentiment. Observing how the stock reacts in the coming sessions can provide useful cues. Traders should focus on structure, strength, and participation—adapting their approach based on personal style and risk preference.
🚨 Disclaimer: This is not financial advice. All views are shared for educational purposes only. Please do your own research and always manage your risk before making any trading decisions.
📢 What’s your view? Drop it in the comments and boost the idea if you found it useful – your support helps us keep sharing quality setups! 💬🔥
Tech Mahindra Q4 Earnings Highlights: #TECHM
Tech Mahindra Q4 Earnings Highlights: #TECHM
• Net Profit: ₹1,166.7 Cr-
Up 18.7% QoQ (vs *983.2 Cr) •
Revenue: *13,384 Cr - Up 0.7% QoQ (vs *13,285.6 Cr)
⚫ EBITDA: *1,378 Cr-Grows 2.1% QoQ (vs *1,350.2 Cr)
⚫ EBITDA Margin: 10.3%, Slightly Up from 10.2% QoQ
Technical Analysis Summary:
The stock made a recent high of ₹1,810.
*1,210.
It was in a downtrend but has reversed from a strong support level at
Currently trading at ₹1,445, the stock has formed a Doji candle, indicating a balance between buying and selling pressure.
A break below *1,430-₹1,425 may signal increased selling pressure and potential downward movement.
Conversely, a break above ₹1,465-₹1,470 may trigger buying momentum
and a potential upward move.

M$M DOUBLE BOTTOM BREAKOUT M&M breaking double bottom weekly
with good volume since few week
RSI good, RSI divergence
breaking 20 ema also
#target1 3100 breaking it
will reach #target2 3230
NO BUY/SELL RECOMENDATION

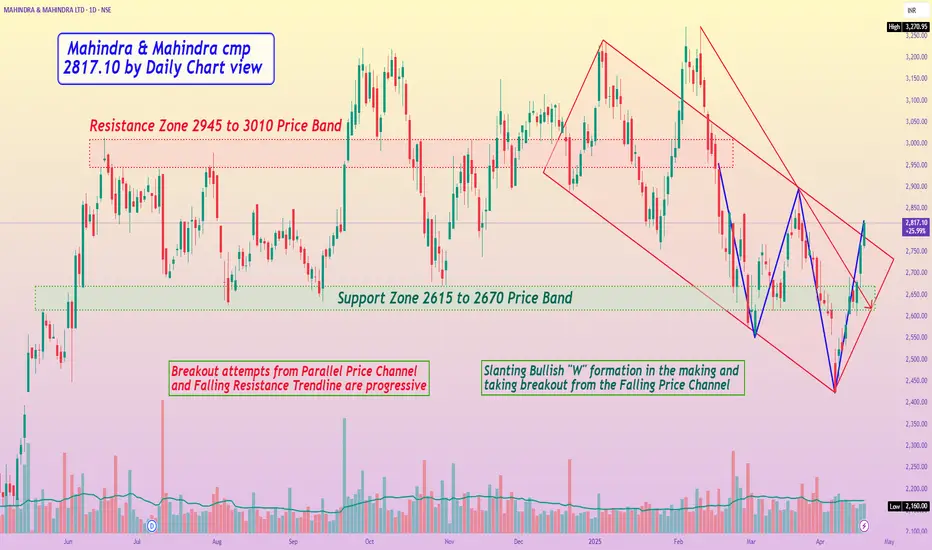
Mahindra & Mahindra cmp 2817.10 by Daily Chart viewMahindra & Mahindra cmp 2817.10 by Daily Chart view
- Support Zone 2615 to 2670 Price Band
- Resistance Zone 2945 to 3010 Price Band
- Volumes are seen to be getting in close sync with the average traded quantity
- Breakout attempts from Parallel Price Channel and Falling Resistance Trendline are progressive
- Slanting Bullish "W" formation in the making and taking breakout from the Falling Price Channel
Mahindra & mahindraM&M itself focuses primarily on mobility products and farm solutions. It’s a titan in India’s automotive sector, renowned for rugged SUVs like the Scorpio, Thar, and XUV700, and holds a dominant position in utility vehicles with an 11.4% market share, competing with Tata Motors, Hyundai, Kia, and Maruti Suzuki.
Chart for your reference

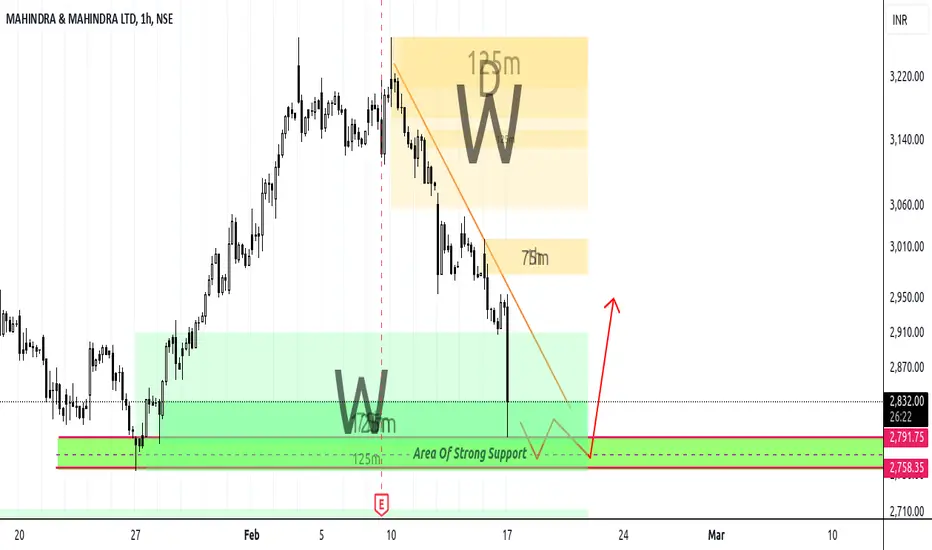
M & M - Expecting reboundStock has nearly corrected itself between 10 to 12%
Now approaching an area which is a support in Daily / Weekly / Hourly as well
Expecting the fall to stop here for sometime go side ways before turning back up (depending upon the market situation)
Or may continue its journey downwards again
Lower TF confirmation (15 Mins) is compulsory to enter the trade
Downside final support can be accounted as 2850
If takes support it can easily go back up to 2955 - 3020
Volatility is High. Trade is against the trend, so trade cautiously
MAHINDRA & MAHINDRA - BEARISH PRICE ACTION AT RESISTANCE ZONESymbol - M&M
CMP - 3218
Mahindra & Mahindra Ltd. has been witnessing a recovery in recent weeks after facing a significant decline. The stock has shown strength by bouncing back from key support zones and is now encountering key resistance levels. However, it faces challenges at higher levels, and we are starting to see signs of consolidation & bearish price action as it tests these resistance zones.
The overall trend appears to be on a recovery path, following a steep drop. But at these higher levels, the stock faces resistance, suggesting a possible pause or consolidation before any significant movement in either direction.
In the short term, the trend is slightly bearish. The stock has encountered some selling pressure & is forming bearish candlesticks as it nears its resistance levels, and it's currently consolidating. In the long term, the trend remains positive, backed by the company’s strong fundamentals, especially in the automotive and farm equipment sectors.
Currently, the stock is trading within a range with visible selling pressure near a resistance zone, indicating a consolidation phase. My bias leans towards the downside in the short term, and we could see a pullback from the resistance level towards the support trendline, with the possibility of further declines.
For traders, the strategy could involve looking for short opportunities near the resistance zone, particularly if the stock fails to break out above this level and begins reversing. However, if the stock manages to break through the resistance and shows sustained momentum, the bias could shift to the upside, and long positions might be considered.
Disclaimer - Do not consider this as a buy/sell recommendation. I'm sharing my analysis. You can track it for educational purposes. Thanks!

Manindra & Mahindra LTD Technical Analysis #Mahindra & Mahindra (M&M) is a prominent Indian multinational corporation, known for its diverse range of products and services.Manufactures and sells a wide range of vehicles including SUVs, pickup trucks, commercial vehicles, and electric vehicles. They are known for their utility vehicles, holding a leadership position in India by revenue market share. Here's an Chart overview based on recent information

Mahindra - EW Analysis - Short Set-upWe are back to ATH in an X.
Ideally Z should test low or range, but safer to play for 2900 target with today's high as SL.

M&M looks good to buy with sl of 2700Technical Analysis:
- Trading Above 200 EMA : good for Positional
- Take reversal from support few days back
- Good Volume
Trading Setup
- Buy at cmp
- Target would be :3000-3200
- SL would be : 2700
Note : Not recommend to buy if there is a gapdown at opening

The Wheels are Turning: Auto Sector Sees Major GainsIndian auto stocks surged on January 2, 2025, fuelled by impressive December sales numbers, which propelled the Nifty Auto index to its highest daily gain in six months.
◉ Key Players
1. Eicher Motors NSE:EICHERMOT
● Surged 7%, with December sales up 25% YoY to 79,466 units, and exports rising 90% YoY.
2. Ashok Leyland NSE:ASHOKLEY
● Rose 5%, with December sales exceeding estimates, up 5% YoY, and Medium and Heavy Commercial Vehicles sales up 8% YoY.
3. Maruti Suzuki India NSE:MARUTI
● Extended gains for the second straight day, rallying 5%, driven by strong December car sales and bullish management commentary.
4. Mahindra & Mahindra NSE:M&M
● Up over 3% for the second consecutive day, with December SUV sales jumping 18% YoY to 41,424 units, driven by strong demand.
◉ Overall Outlook
The Indian automotive market is poised for continued growth, driven by a resilient economy and robust consumer demand. Potential interest rate cuts are expected to further fuel this growth, making vehicle financing more accessible and affordable for consumers. As a result, the road ahead looks promising for FY26, with expectations of sustained growth and increased sales in the automotive sector.

Mahindra & Mahindra Financial Services Limited // LevelsMahindra & Mahindra Financial Services Limited (M&MFIN) is a prominent non-banking financial company (NBFC) in India, specializing in providing financial services to rural and semi-urban populations. The company offers a range of products, including vehicle financing, SME financing, housing finance, insurance broking, and mutual fund distribution.
As of January 2, 2025, M&MFIN's stock performance is as follows:
Current Share Price: ₹264.95
52-Week High: ₹343.00
52-Week Low: ₹246.20
1-Month Change: -3.09%
It's noteworthy that in 14 out of the past 18 years, M&MFIN has delivered negative returns in January, with a maximum positive change of 15.32% observed in 2012.
Given the stock's historical volatility, especially in January, it's advisable to consult financial advisors or utilize real-time trading platforms for the most current information and personalized investment guidance.
