M&M Fin (W): Bullish, Breakout with Short-Term Rejection(Timeframe: Weekly | Scale: Logarithmic)
The stock has confirmed a major multi-year breakout, moving into "Blue Sky" territory. However, the daily price action suggests a temporary pullback (re-test) is imminent before the uptrend resumes.
📈 1. The Breakout Structure (The "Big Picture")
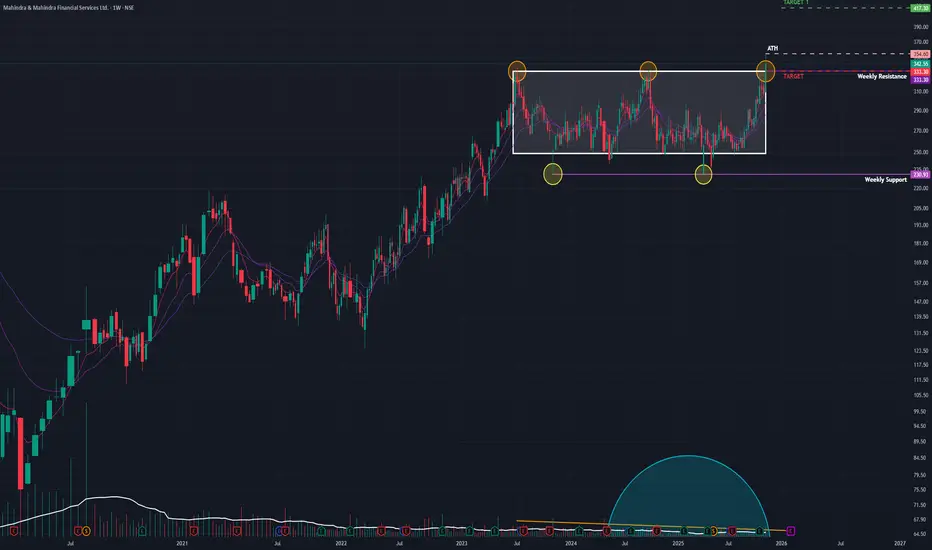
- The Setup: The stock has been trapped in a consolidation phase since its July 2023 peak. The ₹330–₹335 zone acted as a rigid "ceiling" for over two years.
- The Breakout: The week of Nov 17 was decisive. The stock surged 10.98% , closing above this multi-year resistance for the first time.
- Volume: The move was backed by 29.74 Million in volume —a significant expansion compared to the "dry" consolidation phase, confirming institutional participation.
🕯️ 2. The "Shooting Star" Warning (Daily Chart)
- The Pattern: The last daily candle (Friday) formed a Shooting Star . It opened high, rallied to a new peak (~₹354), but faced heavy selling pressure to close near the lows (~₹342).
- Implication: This "long upper wick" shows that sellers are aggressively defending the ₹350+ level. It strongly suggests that the breakout is "tired" and a re-test of the breakout zone is likely next week.
🚀 3. The Fundamental Catalyst (The "Why")
This technical move is supported by strong fundamentals, which adds confidence to the long-term bullish view:
- Earnings: The breakout is a delayed reaction to strong Q2 FY26 results, where Net Profit surged ~54% YoY and asset quality improved.
- Outlook: This fundamental strength suggests that any dip (re-test) will likely be bought by smart money.
📊 4. Indicators & Trend
- RSI & EMAs: RSI is rising (bullish momentum) and EMAs are in PCO state (trend alignment) across Monthly and Weekly charts. This confirms the primary trend is UP.
🎯 5. Future Scenarios & Key Levels
The "Shooting Star" dictates the immediate game plan: Wait for the Re-test.
🐂 The Bullish Case (Buy the Dip)
- The Strategy: Watch for the stock to pull back to the ₹333 – ₹335 zone (the resistance-turned-support).
- Confirmation: If the price stabilizes or forms a bullish candle (like a Hammer) at this level, it is a high-probability entry.
- Target 1: ₹417
- Target 2: ₹475
🐻 The Failure Case (Fakeout)
- Trigger: If the selling pressure from the Shooting Star intensifies and the stock closes back below ₹333.
- Consequence: This would confirm a "fakeout" (bull trap), and the stock could slide back toward the consolidation midpoint around ₹300.
Conclusion
The breakout is genuine, but the Shooting Star signals a short-term pause. The ideal approach is to wait for the re-test at ₹335 to confirm that the "ceiling" has truly become a "floor."
Mahindraandmahindrafinance
M&M Fin (W) - Renewed Strength within a Multi-Year ConsolidationAfter more than two years of trading in a sideways range, M&M Financial Services is showing strong signs of renewed buyer interest, suggesting a potential move towards the top of its long-term consolidation channel.
The Big Picture: A Prolonged Consolidation
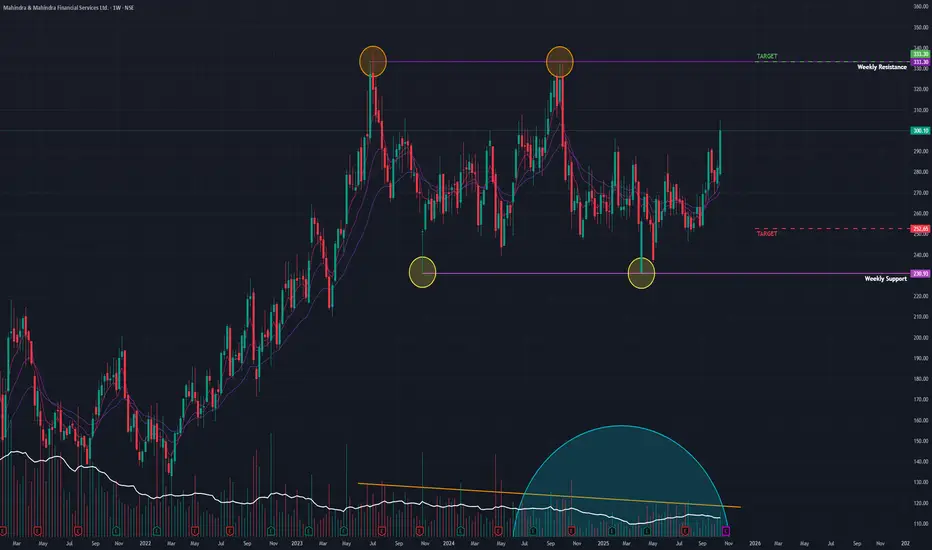
Since reaching its All-Time High (ATH) in July 2023, the stock has been locked in a wide consolidation or sideways trend. A classic and often bullish sign during this phase has been the gradual drying up of trading volume , which typically indicates that selling pressure is diminishing.
Recent Bullish Action
The past week marked a significant shift in activity, signaling that bulls are becoming active again:
- The stock surged by +6.38% for the week.
- This move was supported by a strong volume of 15.49 million shares , indicating conviction behind the buying.
This renewed interest is supported by the underlying strength seen in higher timeframe indicators. Both the short-term Exponential Moving Averages (EMAs) and the Relative Strength Index (RSI) are in a bullish state on the *Monthly and Weekly charts.
Outlook and Key Levels
While the ultimate goal for bulls is a breakout above the distant ATH, the immediate battleground is the established trading range.
- Upside Target: The primary target in the near term is the upper limit of the consolidation range, around the ₹333 level. A breakout above this would be the next major bullish signal.
- Key Support: If this recent momentum fades, the stock is likely to find strong support at the lower boundary of its range, near the ₹250 level.
In conclusion, last week's strong performance suggests M&M Financial is preparing to challenge the top of its long-term range. The key now is to watch if this momentum can be sustained for a move towards the ₹333 resistance.
M&MFIN - 50% RETURNS!!!BUY - M&MFIN
CMP - Rs. 259
Target - 1: Rs. 315
Target - 2: Rs. 390
.
.
Technicals - Cup and Handle BO
.
This is just a view by an expert analyst, please trade at your own risk.
.
Follow me for more!

Mahindra and Mahindra Chart Analysis !!📈 M&M 📉
My Findings :-
1. Breakout from downtrending trenline zone.
2. Higher High and Higher Low Formation.
3. Close Above March 2022 High.
Bias- Long
Target- 901 and 960
SL- 822
RR- 1: 2.5
All Important Supports and Resistances are drawn in chart. All levels are on closing basis.
Please have a look and revert back if you need some more study on it.
Disclaimer : Consult Your Financial Advisor Before Taking Any Decision On This Analysis.

M&M Finance Chart Analysis !!📈 M&M Finance 📉
My Findings :-
1. Breakout from resistance zone.
2. Close Above 3 Months High.
Bias- Long
Target- 202 and 221
SL- 156
RR- 1: 2
All Important Supports and Resistances are drawn in chart. All levels are on closing basis.
Please have a look and revert back if you need some more study on it.
Disclaimer : Consult Your Financial Advisor Before Taking Any Decision On This Analysis.

MAhindra & mahindra Trend Analysis MAhindra & mahindra Trend Analysis
1. bull flug pattern formation price movemtum
2. not break trend resistance so chance for down side
3. when break the supply demand zone confirmation of up side big rallly target 1 and 2
3. wait period right now chance accmmulation area after strong buy do not miss it

Simple Trade Setup | M&MFIN |20-09-2021NSE:M_MFIN
Observations:
1) On Daily Time Frame: It has broken and taken support from 200DMA. but closed below it's long time critical zone 179-181 level range.
It is on verge of another breakout if it successfully stay/trade above 180 to 185 level.
Please refer below chart : Daily time frame.
-------------------------------------
Trade Setup for Date 20-09-2021:
1) Don't Jump in to trade at the beginning of the market. Let it get settle for 15-20min first and judge the price action.
2) Everything is mentioned on the chart. I hope it is easy to understand.
3) All the levels will work as support, resistance, entry and exit w.r.t price action near that level.
Please refer below chart for levels.
Hope I made it easy to understand it.
Do comment your doubt or suggestion.
Note: Trade with Strict SL. It may or may not hit all the levels. So one can book profit / loss at respsective level considering how price action works near that level.

Mahindra & Mahindra FinancialsTarget, profit % and approximate time line is updated in Chart. Kindly trade accordingly.
On MOst of the technical indicator is is showing bullish
This Stock has huge potential to be a multi-bagger if hold for a long term

M&M Financial: At a Very Strong SupportAnalysis:
1) The stock has seen significant correction
2) It is present in a strong activity area from where the stock has previously witnessed support and resistance
3) The stock is also taking a support from the trend line
4) It is also retracing from 0.882 Fibonacci levels
Interested traders can look for confirmation by waiting for the price to breach 165 levels before taking the trade
Tgt 202
Sl 152
Disclaimer: These analysis are only for educational purposes only. You are responsible for your own actions.

Buy Mahindra and Mahindra FinanceBuy and accumulate Mahindra & Mahindra Financial Services for 20%-30% upside in 2-6 months period.
Target levels: 197,222,245.
Low Support Levels: 113, 79
*** You can also see my other stock analysis and the performance of achievement/judgment in my profile ideas. If you would like to see more ideas on stock movement, please follow me.
**Disclaimer: I am not a SEBI registered consultant/Advisor. It is completely my view and opinion. My intention is not to provide any financial advice, training advice, or any type of advices or any recommendations on stock buying or selling. Please do your own research and consult with your financial advisor before taking any action. I am not responsible for any of your action on buying or selling or holding the above mentioned stock or/and index.


M&MFIN | Bullish Flag FormationTarget - 224, 245. CMP - 214.90 BSE:M_MFIN
We can clearly see in the daily chart that it has formed a pole & flag kind of a pattern which has already given a breakout of the 215 levels. If it sustains above this level, we can expect a target of 224 and a further target of 245.
