DMART 1 Week Time Frame 📊 Recent Price Range (Last Week)
Stock was trading around ₹3,780–₹3,900 in the recent trading sessions.
Weekly price change has been relatively modest, showing a small rise over the past week (~+1–2%) in some data and a slight variation in others due to different closing levels.
🛑 Weekly Support Levels
These are key zones where the price may find buying interest / downside support over a short 1‑week horizon:
1. ₹3,665–₹3,705 — Short-term pivot/support cluster (near prior recent lows).
2. ₹3,531–₹3,597 — Lower support range that may act if the stock breaks below near‑term levels.
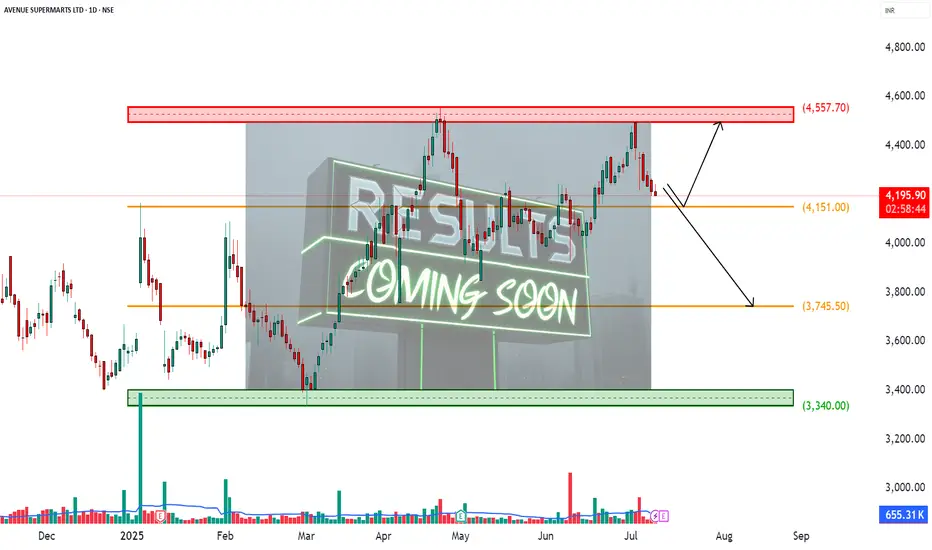
3. ₹3,340 — Broader 52‑week low area (reference of major historical support).
📈 Weekly Resistance Levels
These are zones where the price may see selling pressure / upside barriers in the near term:
1. ₹3,841–₹3,881 — Near current pivot and first resistance for short‑term trading.
2. ₹3,929–₹3,950+ — Next upside resistance from classic pivot methods.
3 .Above ~₹4,000 — Psychological and technical interest level (also broker target levels in wider timeframe).
📌 Summary — 1‑Week Key Levels to Watch
Level Type Price Zone
Immediate Support ₹3,665 – ₹3,705
Deeper Support ₹3,531 – ₹3,597
Short‑Term Resistance ₹3,841 – ₹3,881
Higher Resistance ~₹3,929 – ₹3,950+
Market

SHORT OPPORTUNITY ON GBPJPYWe can short GBPJPY if it comes to my mark black zone as when market comes here it will comes with buyers liquidity available at downside so as soon as we can see market has broke trendline on 15min time frame and form some "M" type structure in lower time frame that can be 5min we can go for a short side scalp.

DMART – Earnings Incoming________________________________________________________________________________📈 DMART – Earnings Incoming: What’s the Right Time to Enter an Options Trade?
📆 Result Date: 11th July 2025 (Friday)
🕒 Strategy Style: Beginner + STWP HNI Learning Setup
🔍 For Educational Purposes Only
________________________________________________________________________________
🧠 What's the Setup?
DMART is announcing results on Friday, 11th July. We’re expecting a strong move — either up or down — because of mixed expectations around revenue and margins.
When you trade options around results, timing your entry is just as important as selecting the right strikes.
Let’s simplify it ⬇️ ________________________________________________________________________________✅ Option 1: Enter on 10th July (Thursday, After 2 PM)
💡 This is the ideal time for most traders.
🟢 Better option prices (not too inflated yet)
🟢 Good liquidity for smooth entry
🟢 Gives you overnight time to plan
🟢 You avoid the Friday panic crowd
🎯 STWP Suggested Strategy:
Buy 4300 CE + 4100 PE = ~₹180 total premium
This is called a Long Strangle – You win if the stock moves sharply up or down after results.
________________________________________________________________________________⚠️ Option 2: Enter on 11th July (Friday, Before 2 PM)
🔸 You might think, "Let me wait till Friday to get more clarity" — but there’s a catch:
❌ Option prices become expensive (high IV)
❌ Bid-ask spreads get wide (hard to enter)
❌ No time to react if results come intraday
❌ You’re stuck with weekend gap risk without prep
Unless you're experienced or scalping early, it’s not ideal for beginners.
________________________________________________________________________________🎯 Best Timing Rule – STWP Style:
📌 Enter on 10th July between 2:00 PM – 3:15 PM
Why?
You’ll lock in a clean setup with decent pricing and avoid stress.
📆 Exit Plan:
Hold through the weekend → Exit on Monday (14th July) if stock moves sharply 🔥
________________________________________________________________________________🧠 Alert:
Set alerts at:
₹4450 (Upside)
₹3950 (Downside)
If either hits on Monday, trail the winning side and exit the losing leg.
________________________________________________________________________________
📚 This is a learning example – not a trade recommendation.
Options carry risk. Please manage your capital and don’t trade blindly.
________________________________________________________________________________⚠️ Disclaimer (Please Read):
• This chart is shared for educational purposes only and is not investment advice.
• I am not a SEBI-registered advisor.
• The information provided here is based on personal market observation.
• No buy/sell recommendations are being made.
• Please do your own research or consult a registered financial advisor before making any trading decisions.
• Trading involves risk. Always use proper risk management.
________________________________________________________________________________
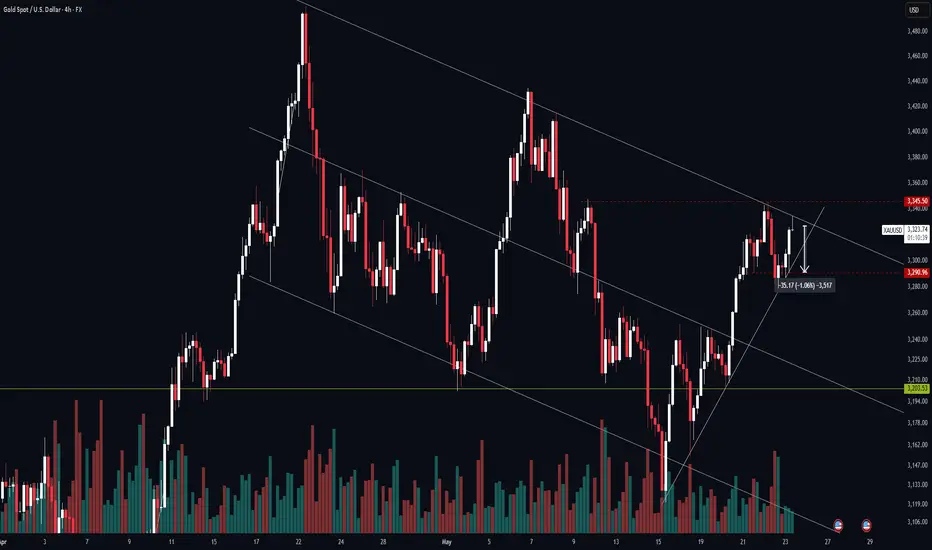
XAUUSD in a Daily Channel — Bears Eyeing a Break at Trendline Re📊 Cycle Structure:
HWC (Higher Wave Cycle): Bearish with a mild slope 🔽
MWC (Middle Wave Cycle): Bullish 🔼
LWC (Lower Wave Cycle): Bullish 🔼
While both the mid and short-term cycles are pushing upward, the dominant bearish trend in the higher timeframe still weighs heavier, tilting the bias toward short setups.
📐 Market Structure:
Price is moving within a descending daily channel.
There's a 1H ascending trendline that has been tested four times already — currently heading into a fifth test.
The previous (fourth) reaction was weak, which statistically increases the chance of a breakout on the fifth touch.
The 3290 zone remains a strong resistance and a good target for short-term profit-taking on short positions.
📈 Alternate Long Scenario:
If buying pressure intensifies and price breaks above the 3345 key resistance, it could trigger a shift toward a bullish bias and challenge the integrity of the descending channel. This would invite breakout traders to join the move. However, this remains a secondary scenario, not the primary focus right now.
📌 Main focus remains on identifying short opportunities near resistance with proper risk management in place.
📌 If you'd like a specific pair or coin analyzed, drop it in the comments — I’ll choose from there.
⚠️ Without proper risk management, you're just a ticking time bomb.
— PXA
Very good investment opportunity in TATAMOTORSTatamotors is in monthly demand zone which has a very good logout. And it is also retesting the important level of 606 which was stocks high in year 2015. Retest of that level was pending which has happened now and it has also given a very good weekly candle closing. We can target 70% returns in this stock. Trade with proper risk management

S&P 500 sliding down! Markets under pressure #SP500S&P 500 sliding down! Markets under pressure #SP500
📉 The S&P 500 is trending downward today as market volatility rises. Investors react to economic data, Fed policy expectations, and global uncertainties. Stay alert and manage risk accordingly! #SP500 #StockMarket #Investing #trade #markets #finance #money

Gbpusd buy?? As you guys can see this ,price action is pretty bullish on gbpusd.
Tarriffs are impacting the world.
Trump didn't put tarriffs on UK, which positive for them.
So GBP is bullish. My target is above 1.2700 .
Learn to trade by yourself is better for you.

Dmart - Avenue Supermarkets cmp 4020.00 by Weekly Chart viewDmart - Avenue Supermarkets cmp 4020.00 by Weekly Chart view
- Resistance Zone at 4200 to 4300 Price Band
- Back to Back repeated Bullish Rounding Bottoms but is facing good strong hurdle at Resistance Zone neckline
- Falling Resistance Trendline breakout seems to be sustained but the Resistance Zone breakout remains and needs to be breached thru

option trading Options are a type of contract that gives the buyer the right to buy or sell a security at a specified price at some point in the future. An option holder is essentially paying a premium for the right to buy or sell the security within a certain time frame.
When options are better. Options can be a better choice when you want to limit risk to a certain amount. Options can allow you to earn a stock-like return while investing less money, so they can be a way to limit your risk within certain bounds. Options can be a useful strategy when you're an advanced investor.

Option and database trading ow Options Trading Is Different.
Relative Strength Index (RSI)
Bollinger Bands.
Intraday Momentum Index (IMI)
Money Flow Index (MFI)
Put-Call Ratio (PCR) Indicator.
Open Interest (OI)
FAQs.
An option chain, sometimes referred to as an option matrix, is a fundamental tool in the world of options trading. It provides traders and investors with a comprehensive view of available options for a particular underlying asset, such as stocks, indices, or commodities.

Learn Option ChainTo study an option chain, focus on the current market price, displayed in the centre. Analyse the built-up data to understand market direction based on recent changes in open interest and price. ITM call options are typically highlighted in yellow, making it easier to distinguish them from other options.
Nifty option chain is considered to be the best advance warning system of sharp moves or break outs in the index.

MACD In Trading The Moving Average Convergence/Divergence indicator is a momentum oscillator primarily used to trade trends. Although it is an oscillator, it is not typically used to identify over bought or oversold conditions. It appears on the chart as two lines which oscillate without boundaries.
Traders often use MACD with longer-term moving averages like the 50-day or 200-day moving average. If the price is above these averages and MACD signals a buy, it reinforces the bullish trend. On the flip side, if the price is below the moving averages and MACD signals a sell, it indicates a strong bearish trend.

Option chain in tradingAn option chain lists all option contracts, including put and call option for given security. However, several traders focus on net change,' 'bid,' 'last price,' and 'ask,' columns to assess current market conditions. Option chain is also called the option matrix.
How does an option chain work? An option chain displays available call and put options for a specific underlying asset, with their strike prices, premiums, and open interest. It provides a snapshot of market sentiment and potential price movements.

TECHNICAL CLASS of trading Technical trading is a broader style that is not necessarily limited to trading. Generally, a technician uses historical patterns of trading data to predict what might happen to stocks in the future. This is the same method practiced by economists and meteorologists: looking to the past for insight into the future.
Algo Trading Made Easy.
Technical Trading Made Easy: Online Certification Course.
Stock Valuation Made Easy.
Candlesticks Made Easy: Candlestick Pattern Course.
Options Trading Made Easy: Options Trading Course.
Commodity Markets Made Easy: Commodity Trading Course.

Option trading // Options are a type of contract that gives the buyer the right to buy or sell a security at a specified price at some point in the future. An option holder is essentially paying a premium for the right to buy or sell the security within a certain time frame.
When options are better. Options can be a better choice when you want to limit risk to a certain amount. Options can allow you to earn a stock-like return while investing less money, so they can be a way to limit your risk within certain bounds. Options can be a useful strategy when you're an advanced investor.

SONACOMS (TF|W|) Bullish view .SONACOMS stock analysis Potential breakout opportunity
Chart Analysis : SONACOMS is displaying a strong breakout chart , indicating the upward movement in it's stock price.
CUP & HANDLE Pattern : The cup and handle is considered a bullish signal, with the right-hand side of the pattern typically experiencing lower trading volume. The pattern's formation may be as short as seven weeks or as long as 65 weeks. A cup and handle is a technical chart pattern that resembles a cup and handle where the cup is in the shape of a "u" and the handle has a slight downward drift.
VOLUME BUILDUP: volume buildup near the breakout zone . Increased trading volume is a positive indicator, suggesting more interest in stock and potential momentum

GBP/AUD Bearish Setup On 2-hr Time-frame......Now you can see the it makes LL, LH .. so we can see that it is break and retest setup.. we take trade on the basis of break and retest setup...

A target for Maharastra SeamlessAs per Eliott Wave theory, target has been shown on the chart. Reversal has been shown by the stock.
Disclaimer: I am not a SEBI Registered analyst. This is not a recommendation. It is just my view on this stock.

Veto switchgear Market Cap
₹ 346 Cr.
Current Price
₹ 181
High / Low
₹ 186 / 106
Stock P/E
19.5
Book Value
₹ 129
Dividend Yield
0.55 %
ROCE
12.0 %
ROE
7.49 %
Face Value
₹ 10.0
Debt
₹ 22.6 Cr.
OPM
10.2 %
Promoter holding
45.1 %
Sales growth
-1.30 %
Profit growth
-4.11 %
Industry PE
59.0
Pledged percentage
0.00 %
Reserves
₹ 227 Cr.
Sales growth 5Years
6.57 %
Profit Var 5Yrs
9.18 %
Return over 6months
20.4 %
High price all time
₹ 266

Karurvstya Bank swing idea Weekly timeframe is bullish
Daily timeframe is bullish
4HR timeframe is bullish
50ema is added confluence

Camlin fine science While the company carries a significant amount of debt (₹683.03 crore), its ongoing operations and market strategies might help in leveraging this debt effectively if managed well. The stock is currently trading at ₹122.59, and its historical high suggests there is significant potential for upside if market conditions and company performance align positively.

City Union Bank CUB's recent financial results have been solid. The bank reported an increase in quarterly net income and has shown resilience in its earnings growth. This financial stability boosts investor confidence and supports the stock's upward trajectory.

PEL Enterprises Piramal Enterprises (PEL) is expected to have an upside potential due to several factors. The company recently reported a strong financial performance, with a net profit of ₹137 crore for Q4 FY2024, and is undergoing a significant reorganization by merging with its subsidiary, Piramal Capital and Housing Finance Limited, to form Piramal Finance Ltd.
Cmp 978
