Bitcoin Faces Sudden Shakeout After Weeks of CalmBitcoin Volatility Returns as Market Momentum Resets
Hello Traders,
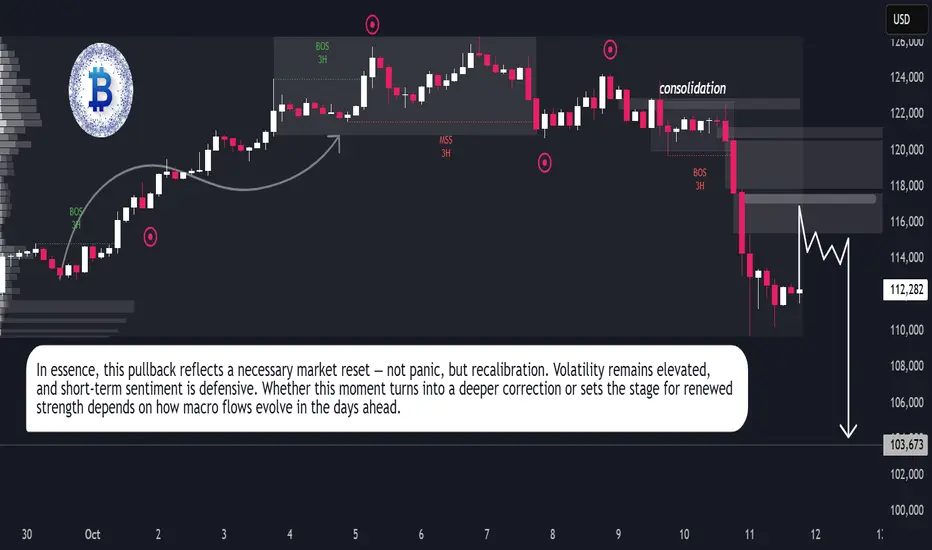
The Bitcoin market experienced a sudden burst of volatility in the recent session, ending a period of relative calm. On the 4H timeframe (Binance), intense selling pressure drove prices from near $117,000 down to roughly $109,000 before stabilizing around the $112K region. The swift decline marked a clear shift in short-term momentum, showing that buyers are beginning to lose dominance as broader market sentiment cools.
This pullback unfolded against a backdrop of renewed global uncertainty. A series of trade-related policy headlines reignited risk aversion, while continued strength in the U.S. dollar added additional stress to crypto markets. Institutional flows briefly reversed, signaling reduced confidence in near-term upside potential. The result was a wave of forced liquidations, magnified by leverage, as traders rushed to adjust exposure during the drop.
Despite the intensity of the move, market conditions remain structurally healthy. On-chain data shows that long-term holders are largely unmoved, suggesting this phase is more of a short-term repricing than a major cycle reversal. Derivative markets, however, have cooled significantly — open interest has thinned, and funding rates have normalized, indicating a temporary reset in speculative participation.
In the coming days, Bitcoin’s behavior will likely depend on liquidity dynamics rather than new macro data. With upcoming U.S. economic reports delayed and the dollar holding firm, volatility may persist as traders respond to headlines and reposition ahead of the next policy developments.
For now, the market appears to be in a state of balance after rapid liquidation. Whether this forms a new accumulation base or precedes deeper correction will depend on how quickly momentum returns. The broader sentiment remains cautious but stable — a waiting phase, as the market tests its conviction once more.
Marketanalysis
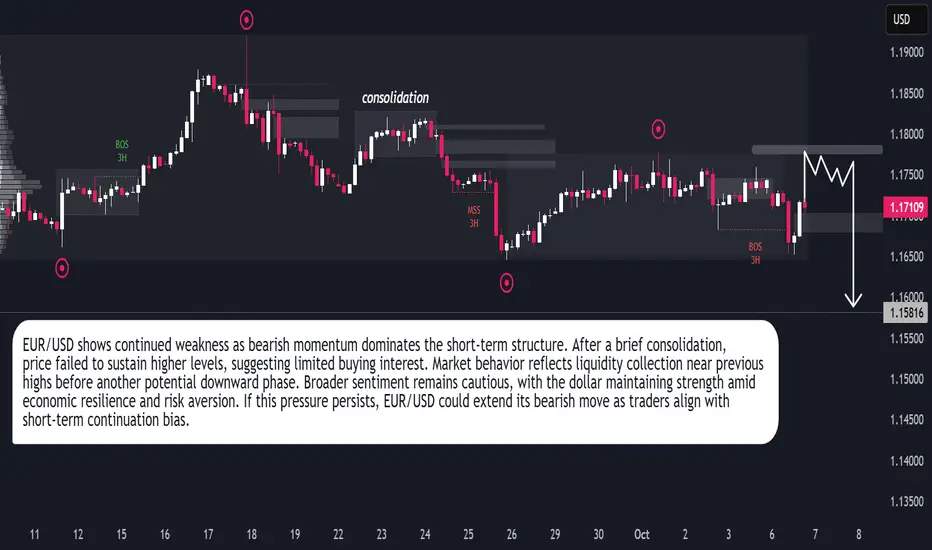
EUR/USD – Bearish Continuation in MotionEUR/USD continues to display a bearish market structure, reflecting persistent downside pressure as the euro struggles to maintain stability against the U.S. dollar. Recent price action shows a period of consolidation followed by a liquidity grab near short-term highs, indicating that buyers are losing strength and the market is positioning for a potential continuation of the decline. The broader market tone suggests that sentiment remains cautious, with traders favoring the dollar due to its resilience amid global uncertainty and steady U.S. economic performance. The pair’s inability to establish higher highs further confirms weakness in bullish momentum. This behavior often signals distribution, where institutional players offload long positions before another leg downward. Short-term movements could still present small corrective bounces as the market seeks liquidity, but overall conditions favor sellers. Unless a strong shift in macro sentiment occurs, EUR/USD is likely to maintain its downward trajectory, targeting lower levels as the bearish momentum unfolds and traders continue aligning with dollar strength.
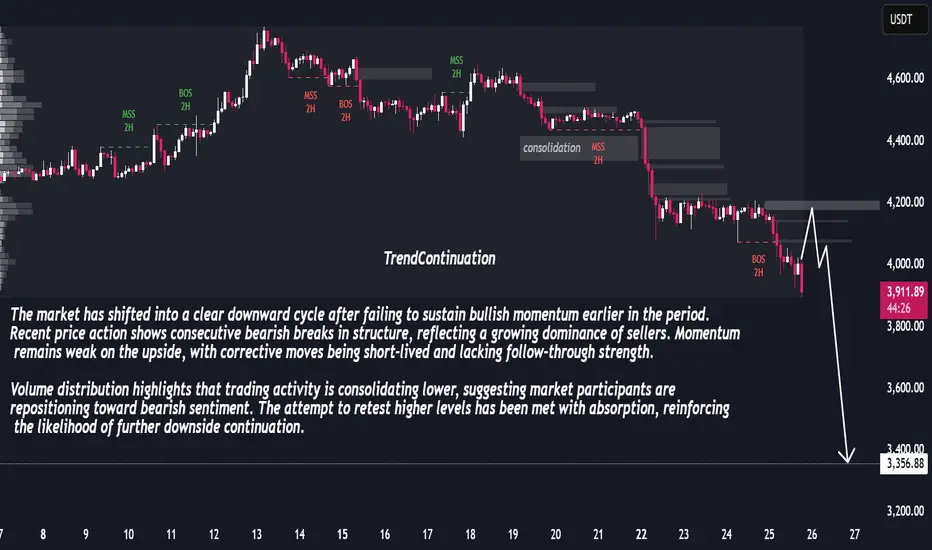
Liquidity Shift Suggests Extended Bearish CycleThe market is showing a progressive decline after losing upward strength. Recent swings indicate a decisive bearish control, with successive shifts in structure confirming the downward pressure. Attempts to recover higher levels have been shallow, reflecting exhaustion on the buy side and stronger liquidity flow toward sellers.
Market behavior suggests that rallies are being used as opportunities to exit or reposition short rather than initiate sustained bullish momentum. This is consistent with the overall weakening tone across the chart, where volatility spikes have favored downward extensions.
Looking ahead, if the current pace of distribution continues, the market is likely to maintain a bearish trajectory with potential for deeper declines as liquidity seeks out lower price ranges.
BTC Price Action: Bulls vs BearsBTC Price Action: Bulls vs Bears
Bitcoin has shown a gradual recovery after a prolonged corrective phase, with market structure leaning toward a constructive buildup. Fundamentally, sentiment is influenced by global macro conditions—investors are watching U.S. monetary policy signals, while stable demand from institutions and long-term holders continues to provide a supportive backdrop. On-chain activity remains steady, with balanced exchange inflows and outflows suggesting no extreme directional pressure in the near term.
From a technical perspective, the market has shifted momentum from bearish flows into a developing bullish sequence. The recent break of structure on the 4H timeframe highlights strengthening upside intent, though price is still moving within a broader accumulation phase. Current flows suggest the possibility of a short-term dip for liquidity before continuation to higher levels, aligning with the overall constructive weekly outlook.

XAUUSD | FED leaning toward 50bps cut? | Buy strategy at support🟡 XAU/USD – 12/09 | Captain Vincent ⚓
🔎 Captain’s Log – Market Context
The probability of a FED -50bps cut next week has risen to 10.9% (from 8%), while a -25bps scenario is almost certain.
US jobless claims rose sharply → reflecting a weakening labor market, reinforcing expectations of FED easing.
Tonight (21:00): release of Consumer Sentiment & 1Y–5Y Inflation Outlook (University of Michigan) – data that could further impact the Dollar.
⏩ Captain’s Summary: Dollar weakness + falling bond yields = Gold remains supported to rise. However, short-term pullbacks may appear before breaking higher levels.
📈 Captain’s Chart – Technical Analysis
Storm Breaker (Resistance / Sell Zone):
Weak High: 3675 – 3677 (psychological barrier)
Peak Zone: 3676 – 3680 (high test, short-term reversal risk)
Golden Harbor (Support / Buy Zone):
FVG: 3603 – 3601
Deep Harbor: 3621 – 3623
Price Structure:
On H1, Gold has repeatedly formed BoS and Equal High (EqH) around 3645 – 3650.
An FVG appears → sign that price may need to fill the liquidity gap before continuing.
Priority scenario: Pullback to 3636 or deeper 3621, then rebound towards 3675 – 3680.
If 3680 breaks successfully → opens the way for new ATH above 3700.
🎯 Captain’s Map – Trading Plan
✅ Buy (trend-follow priority)
Buy FVG: 3601 – 3603 | SL: 3591 | TP: 3605 – 3610 – 3615 – 3620 – 36xx
Buy Zone: 3621 – 3623 | SL: 3612 | TP: 3640 – 3655 – 3665 – 3675 – 368x
⚡ Sell (short-term scalp at resistance)
Sell Zone: 3675 – 3680 | SL: 3684 | TP: 3665 – 3655 – 3645 – 36xx
⚓ Captain’s Note
“The dovish wind from the FED continues to push the golden sails forward. Golden Harbor 🏝️ (3636 – 3621) is the safe docking zone for sailors to gather strength before the new voyage. Storm Breaker 🌊 (3675 – 3680) may create big waves for short Quick Boarding 🚤 , but the main course is still heading North. If the 3680 wave breaks, the golden ship will extend its journey to new peaks above 3700.”

XAU/USD – GOLD 08/09 | Captain VincentObserving JPY & USD | Buy still holds dominance
🔎 Captain’s Log – News Context
This morning there were no major new updates.
The US session tonight (08/09) will also not release big data.
The latest impact on the market is Japanese PM S. Ishiba’s resignation , which pressured JPY downward and slightly lifted the Dollar.
However, Gold only made a small correction and maintained strong stability.
➡️ Captain’s Summary: Dollar and JPY currently only have indirect influence, not enough to push Gold deeply lower. The main trend is still supported for a bullish rebound.
📈 Captain’s Chart – Technical Analysis
Captain’s Shield (Main Support):
Golden Harbor OB: 3542 – 3549
Main Buy Zone: 3549 – 3551
Liquidity Dock: 3573 – 3575
Storm Breaker (Resistance):
Quick Boarding: 3602 – 3604 (Short-term Sell scalp)
Storm Breaker Peak: 3632 – 3634 (Sell zone – may form a new ATH)
⏩ Price structure remains bullish (continuous BOS). Corrections are mainly liquidity grabs before pushing up to higher resistance zones.
🎯 Captain’s Map – Trade Scenarios
✅ Golden Harbor (BUY – Priority)
Buy Zone: 3549 – 3551 | SL: 3542 | TP: 3553 → 3557 → 3560 → 3563 → 35xx
Liquidity Dock: 3573 – 3575 | SL: 3565 | TP: 3578 → 3581 → 3583 → 35xx
⚡ Quick Boarding (SELL Scalp – Short-term)
Entry: 3602 – 3604
SL: 3610
TP: 3600 → 3597 → 3594 → 3591 → 3588 → 35xx
🌊 Storm Breaker (SELL Zone – New ATH)
Entry: 3632 – 3634
SL: 3640
TP: 3629 → 3625 → 3623 → 3619 → 361x
⚓ Captain’s Note
“The golden ship sails steadily as the seas remain calm this morning, with no big news waves. Golden Harbor 🏝️ (3549 – 3551) together with OB near 3542 is the safe anchorage for sailors riding the bullish trend. Liquidity Dock ⚓ (3573 – 3575) is just a temporary anchor before the bullish winds carry the ship further. Quick Boarding 🚤 (3602 – 3604) is for those who want to ride short-term waves. And if the ship touches Storm Breaker 🌊 (3632 – 3634) , it may be a new wave peak – but the grand journey is still headed North with the bullish sails full of wind.”

Red CHoCH Confirms the Bears – Sell at Premium Zone📌 Gold Plan – M30 Timeframe | Captain Vincent ⚓
Background
On the D1 chart, the candle closed lower, showing bearish pressure still dominates.
On H4, the bearish structure continues.
However, Gold is currently stuck around 3345/oz, unable to make a clear breakout.
The 3323 – 3335 zone remains strong support – a level where Vincent has bought multiple times before with solid profits. But with the current structure, today’s priority will be Sell in line with the main trend.
Sell Zone – Premium 🎯
Entry: 3345 – 3347
SL: 3352
TP: 3340 → 3335 → 3330 → 33xx
SMC Note (CHoCH 🔴)
On the M30 timeframe, a recent red CHoCH has appeared – a signal confirming that sellers have regained control.
This strengthens the case for selling at upper resistance zones.
Today’s Scenarios
If price holds below 3345 – 3347 → Prioritise short setups, selling in line with the downtrend.
If price breaks below current support → High chance the market will move to fill the previous FVG. In that case, wait for a Breakout Down retest to enter safer.
Consider entering one small probe trade first, then go in stronger once a reversal candle confirmation appears.
Resistance to watch: 3337 – 3345
Support to watch: 3323 – 3335
⚠️ Captain’s Note:
"SMC structure with a red CHoCH has confirmed that the bears are steering the market. We will flow with the main current – Sell at the Premium Zone – but always with discipline, waiting for clear confirmation before taking action."

Gold Plan 15/08 – Captain VincentBackground
Yesterday, Gold revisited the BUY Scalp – Quick Boarding 🚤 (3332 – 3334) zone and bounced 140 pips.
This is the second consecutive day the zone has shown strong reaction, but today its support strength may weaken.
The main H1 trend is leaning bearish , so the priority is to look for sell setups at major resistance zones.
Zone 1 – Storm Gate 🚪 (Main Sell Zone – SMC Supply)
Entry: 3,355 – 3,357
SL: 3,361
TP: 3,351 → 3,347 → 3,342 → 33xx
Note: SMC Supply zone confluenced with Fibo 0.5 – 0.618. Wait for strong price reaction before entry.
Zone 2 – BUY Scalp – Quick Boarding 🚤
Entry : 3,332 – 3,334
SL: 3,327
TP: 3,336 → 3,339 → 3,342 → 33xx
Note: This zone has reacted twice in a row. Today, only use for quick scalps, avoid holding for long.
Zone 3 – Deep Harbor 🏝️ (Main Buy Zone – SMC Demand)
Entry: 3,290 – 3,292
SL : 3,284
TP: 3,296 → 3,300 → 3,304 → 33xx
Note: Deepest support of the day. Buy only if price drops sharply and clear reversal signals appear.
Today’s Scenarios
If price tests Storm Gate → Look for short-term sells in line with the downtrend.
If price breaks below BUY Scalp → Wait for a retest to sell further, as there’s a high chance of filling the previous Fair Value Gap.
If price reaches Deep Harbor → Attempt a bottom buy, but keep profit expectations short since the overall trend is bearish.
Captain’s Note:
"Today, the golden sea has strong waves and heavy winds. The captain will set sails at Storm Gate to catch the downwind move. Deep Harbor stays open, but will only anchor if the skies are clear. BUY Scalp is like a speedboat – fast, sharp, decisive." 🏴☠️📉
Captain’s Friday Warning ⚠️
"It’s Friday – the wildest day of the week. Trade carefully, manage capital tightly, and protect your treasure chest. The weekend is long; don’t let one impulsive move sink the ship." ⛵💰

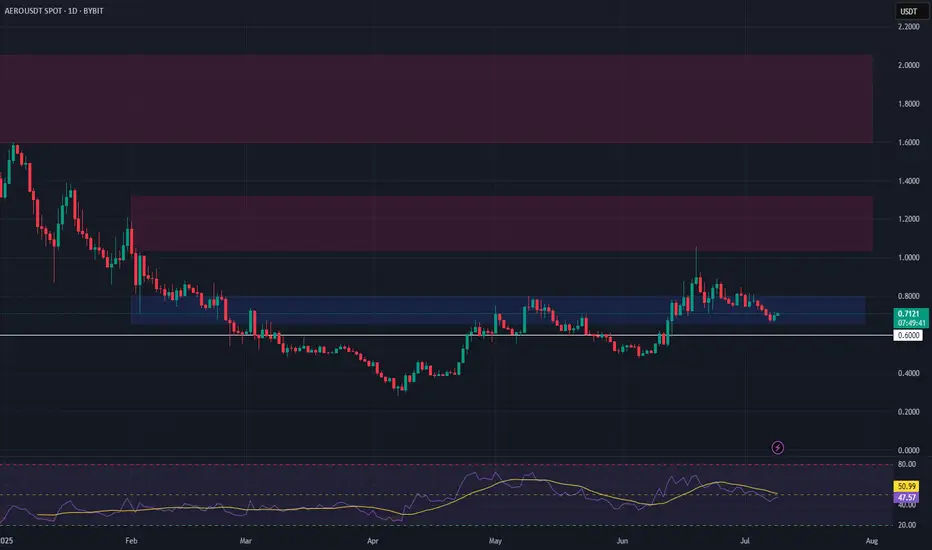
AERO Long Swing Setup – Retest of Range Low SupportAERO has pulled back to test the bottom of its range, now sitting at a key support zone. This offers a potential long swing entry as buyers look to defend the $0.66–$0.80 area.
📌 Trade Setup:
• Entry Zone: $0.66 – $0.80
• Take Profit Targets:
o 🥇 $1.04 – $1.32
o 🥈 $1.60 – $2.05
• Stop Loss: Daily close below $0.60
AVAX Trade Setup – Waiting for Pullback EntryThe total crypto market has hit a key resistance zone, and many altcoins, including AVAX, are showing signs of exhaustion after recent rallies. AVAX surged from $14.00 to $23.00, and a pullback to support could offer a prime long entry.
📍 Entry Zone:
$20.00 – $21.00 (Area of support)
🎯 Take Profit Targets:
🥇 $22.50 – $24.00
🥈 $27.00 – $29.00
🛑 Stop Loss:
Just below $18.50

Gold's Strong Recovery: Key Levels to Watch in XAU/USDXAU/USD Technical Analysis: Gold Shows Strong Recovery Amid Global Economic Optimism 💰📊
Introduction: Gold (XAU/USD) is currently experiencing a strong recovery, supported by several key factors in the global economic landscape. One notable factor is the 90-day tariff suspension for major countries worldwide, which has created a more positive sentiment among investors. Additionally, U.S. stock markets saw a strong boost as this news was announced. The recent FOMC meeting also highlighted the potential for interest rate cuts later this year, further boosting optimism across financial markets. 📈
Technical Analysis: On the XAU/USD chart, gold is showing a solid recovery from recent lows. The price has broken through key resistance levels and is now approaching new highs. Here are the important resistance and support levels that traders should keep an eye on:
Key Resistance Levels:
3146
3162
3168
Key Support Levels:
3096
3078
3066
3052
Moving Averages (MA):
MA 13 (Orange Line): This short-term moving average is supporting the upward trend and providing BUY entry signals when the price is above MA 13.
MA 34 (Yellow Line): The medium-term MA is positioned above the price, further supporting the bullish trend.
MA 200 (Red Line): The long-term MA is confirming a strong uptrend as the price remains above MA 200, reinforcing the positive outlook for gold.
Trading Plan:
BUY ZONE 📈:
Buy Zone: 3096 - 3094
SL (Stop Loss): 3090
TP (Take Profit): 3100 - 3104 - 3108 - 3112 - 3116 - 3120
SELL ZONE 🔽:
Sell Zone: 3164 - 3166
SL (Stop Loss): 3170
TP (Take Profit): 3160 - 3156 - 3152 - 3148 - 3144 - 3140
Fundamental Analysis: Yesterday was a positive day for gold, with various fundamental factors supporting the short-term and medium-term bullish outlook. The suspension of tariffs for 90 days among major countries has created a positive sentiment, and the possibility of interest rate cuts from the FOMC has strengthened the expectation of gold's recovery. 📈💡
Risk Management Advice: Given the current market momentum, the strategy is to focus on BUY entries near key support levels. However, traders should be cautious when selling, as the bullish trend may continue strongly if the price breaks through key resistance levels. Always apply proper risk management by using stop loss and only trade with capital you can afford to lose.
Conclusion: Gold is currently in a strong recovery cycle, with both fundamental and technical factors supporting the uptrend. Traders should watch for key support and resistance levels to implement their trading strategies effectively. Be prepared for BUY opportunities near support zones and watch the resistance levels for potential sell signals as the market moves forward. 📊📉
What are your thoughts on Gold's movement? Share your analysis and trade ideas in the comments below! 💬👇

Leverage Trading vs. Cash Trading: Understanding Risk and RewardHello Traders!
In today’s post, we’ll explore the difference between Leverage Trading and Cash Trading , and how to understand the Risk vs. Reward dynamics in each. Both methods have their pros and cons, and it's essential to choose wisely depending on your trading goals and risk tolerance. Let’s break down both types:
Leverage Trading:
Leverage allows you to control a larger position with a smaller amount of capital by borrowing funds from a broker. This can amplify your potential profits, but it also increases your risk significantly. With leverage, you can earn higher returns on small price movements, but if the market moves against you, your losses can quickly escalate.
Risk: With leverage, even a small adverse move can lead to significant losses, sometimes more than your initial investment.
Reward: If the market moves in your favor, the potential for higher profits is substantial, as you're controlling a larger position.
Margin Call: If the market moves against your position, you might receive a margin call, requiring you to add more capital to maintain your position.
Cash Trading:
Cash trading, also known as spot trading , involves buying and selling assets using your own capital, without borrowing funds. This method is less risky compared to leverage trading because you’re not exposed to margin calls or the risk of losing more than your investment. However, your potential returns are limited to the capital you have available.
Risk: The risk is limited to your initial investment, and you can never lose more than what you’ve invested in the trade.
Reward: The returns are generally more moderate compared to leverage trading, but this can be a safer and more controlled approach.
Stability: With cash trading, you don’t have to worry about margin calls, making it a more stable and less stressful option for risk-averse traders.
Key Takeaways:
Leverage can offer higher rewards, but it also exposes you to higher risks.
Cash trading is safer, with limited risk, but the profit potential is more modest.
Always assess your risk tolerance and choose the appropriate trading method based on your goals.
Managing risk is critical in both types of trading. Use stop losses and risk management strategies to protect your capital.
Conclusion:
Both leverage trading and cash trading have their unique benefits and drawbacks. If you’re comfortable with higher risk and have a good understanding of the markets, leverage can provide great rewards. But if you prefer a more conservative approach with less risk, cash trading might be the better option. Always trade within your means and manage your risk effectively.

Manual Trading vs. Algo Trading: What’s the Future?Hello Traders!
In today’s post, we’ll explore a hot topic in the trading world – Manual Trading vs. Algo Trading , and discuss the pros and cons of each. These two approaches to trading have been gaining popularity, but the question remains: which one is better, and what does the future hold for both?
What is Manual Trading ?
Manual trading is the traditional form of trading where the trader makes all the decisions. This includes identifying entry and exit points , using technical indicators , and analyzing the market to make informed decisions. Traders who use manual trading rely heavily on their experience , emotion , and intuition to decide when to buy or sell.
What is Algo Trading ?
On the other hand, Algo trading uses computer algorithms and pre-programmed instructions to execute trades. It’s based on a set of rules, such as price , volume , and time , to determine when a trade should be placed. This method eliminates human emotion, and trades are executed with precision and speed, often in milliseconds . Algo traders use advanced tools like artificial intelligence (AI) , machine learning , and big data to build smarter trading strategies.
Pros of Manual Trading
Human Element : Manual traders can rely on their intuition, experience, and emotions to make informed decisions. This helps them adjust to market nuances and situations that algorithms may miss.
Flexibility : Manual traders have the ability to make on-the-spot decisions based on changing market conditions.
Emotional Control : Although emotions can be a downside, a skilled manual trader knows how to manage emotions effectively, which allows them to make calculated decisions.
Pros of Algo Trading
Speed and Efficiency : Algo trading can process large amounts of data quickly, making trades in milliseconds. This can be advantageous in fast-moving markets.
Reduced Emotional Bias : Since the algorithm follows strict rules, there’s no emotional interference, making the process more rational and systematic.
Backtesting : With algo trading , traders can backtest strategies against historical data to see how the algorithm would have performed, helping to fine-tune strategies.
24/7 Trading : Algo trading can run continuously, taking advantage of global markets and never missing trading opportunities.
Cons of Manual Trading
Time-Consuming : Manual trading requires a lot of attention and focus, which can be mentally exhausting, especially during volatile markets.
Emotional Impact : Emotions such as fear and greed can affect a trader’s decision-making process, leading to mistakes.
Limited to Available Time : Traders are limited by time and must be physically present to execute trades.
Cons of Algo Trading
Technical Issues : Algorithms can fail or face technical glitches, leading to unexpected losses.
Lack of Adaptability : Algorithms are designed to follow rules, which means they may not adapt well to unexpected market events or major news.
Over-Optimization Risk : Over-optimized strategies may perform well in backtests but can fail in real market conditions.
The Future of Trading
As technology continues to advance, the future of trading will likely see more integration of AI , big data , and machine learning in both manual and algo trading . While algo trading will continue to dominate for its speed, efficiency, and ability to trade large volumes, manual trading still holds value for traders who rely on their judgment, intuition, and ability to adapt to rapidly changing market conditions.
Conclusion: Manual trading and algo trading each have their unique advantages. If you’re someone who enjoys making quick decisions and analyzing the market based on real-time information, manual trading might be your best fit. However, if you prefer speed , automation , and trading without emotional bias, algo trading could be the way to go.
What are your thoughts on Manual Trading vs. Algo Trading ? Share your experience and insights in the comments below! Let’s learn from each other!

Mastering the Three White Soldiers Pattern: A Bullish ReversalHello Traders!
I hope you're doing great in your trading journey! Today, we will be diving into the Three White Soldiers chart pattern, a powerful bullish reversal pattern that can help you spot a potential trend shift. This pattern typically occurs after a downtrend, signaling a strong reversal. If you can spot it early, it offers a high-reward trading opportunity. Let’s break down the pattern and how to use it effectively.
What is the Three White Soldiers Pattern?
The Three White Soldiers pattern consists of three consecutive long bullish candles that close progressively higher. This pattern typically appears after a downtrend and signifies a potential reversal. The pattern shows a strong shift in market sentiment, where buyers are stepping in to push the prices higher.
Key Characteristics of the Three White Soldiers Pattern
Trend Reversal: The pattern forms after a strong downtrend, signaling a potential trend reversal.
Three Consecutive Bullish Candles: The pattern consists of three long bullish candles, each closing higher than the previous one.
Strong Closing Prices: Each candle should close near its high, indicating strong buying pressure.
Volume Confirmation: The pattern is more reliable when accompanied by increasing volume, showing strong interest in the reversal.
How to Trade the Three White Soldiers Pattern
Entry Point: Consider entering a long position once the third candle closes, confirming the reversal.
Stop Loss: Place your stop loss below the low of the first candle in the pattern to limit potential losses.
Profit Target: For setting targets, measure the height of the pattern (distance between the low of the first candle and the high of the third candle) and project this distance upwards from the entry point to set your profit target.
Real-World Application: TCS Case Study
In the chart of Tata Consultancy Services (TCS) , we see a clear Three White Soldiers pattern forming after a downtrend. The price closed progressively higher over three consecutive days, breaking key resistance levels and signaling a potential bullish trend. Traders entering after the confirmation of the pattern would have witnessed a substantial upward move, with a clear Stop Loss and Profit Target in place.
Risk Management Considerations
Position Sizing: Adjust your position size according to your risk tolerance and overall portfolio.
Stop Loss Placement: Place your stop loss below the low of the first candle to manage risk in case the pattern fails.
Volume Confirmation: Confirm the pattern with increasing volume to ensure the strength of the reversal.
What This Means for Traders
The Three White Soldiers pattern is an excellent tool for identifying trend reversals and can be a powerful signal when used in conjunction with other technical indicators. Remember to always look for confirmation with volume and manage your risk effectively.
Look for the pattern after a significant downtrend to identify potential bullish reversals.
Use volume to confirm the strength of the pattern and increase the reliability of your trade.
Implement stop loss placement to minimize risk while targeting a favorable risk-to-reward ratio.
Conclusion
The Three White Soldiers pattern is a reliable bullish reversal signal that can offer excellent trading opportunities when combined with other technical indicators. By understanding its key characteristics, waiting for confirmation, and managing risk appropriately, you can increase your chances of making profitable trades.
Have you traded using the Three White Soldiers pattern?
Share your thoughts and experiences in the comments below! Let’s keep learning and improving our trading strategies!

Mastering the Flag Chart Pattern for Profitable BreakoutsFlag Chart Pattern: A Key to Successful Breakouts
Hello Traders!
I hope you’re all doing well! Today, we’ll be taking a deep dive into the Flag Chart Pattern . This continuation pattern is a favorite for traders looking for a strong trend to follow. If you want to spot reliable breakouts, the Flag pattern is something you’ll want to master. It can help you ride strong trends and get in at the right moment after a brief consolidation.
What is the Flag Pattern?
The Flag Chart Pattern forms after a sharp price movement (the Flagpole ), followed by a brief consolidation period. The consolidation forms a rectangular or parallelogram shape, which is the Flag . Once the price breaks out of this consolidation, it often continues in the same direction as the initial Flagpole .
In other words, the Flag Pattern signals that the market is taking a quick breather before continuing its strong momentum in the same direction.
Key Characteristics of the Flag Pattern
Flag Pole : The initial sharp price movement (either upward or downward), showing strong momentum.
Flag : The consolidation phase that follows the pole, typically characterized by parallel trendlines, forming a rectangular or parallelogram shape.
Breakout : The price breaks above (for a bullish pattern) or below (for a bearish pattern) the flag's upper or lower boundary, confirming the continuation of the trend.
Volume Confirmation : Volume usually decreases during the consolidation (flag) phase, followed by a surge in volume at the breakout, which confirms the strength of the move.
How to Trade the Flag Pattern Like a Pro
Entry Point : The best time to enter is after the price breaks above the flag’s upper boundary (for bullish setups).
Stop Loss : Place your stop loss just below the flag’s lower boundary or the most recent swing low, to minimize risk.
Profit Target : For setting targets, measure the height of the flagpole and project that distance from the breakout point to set your profit target.
Real-World Application: Dixon Technologies Case Study
Looking at the Dixon Technologies chart, we can see a clear Flag Chart Pattern forming. After a sharp price increase (the flagpole ), the stock consolidated, creating the flag . Once the price broke out above the flag’s upper trendline, the price continued to rise, confirming the continuation of the uptrend. The expected target can be calculated using the flagpole’s height, projecting it from the breakout point.
Conclusion
The Flag Chart Pattern is one of the most reliable continuation patterns in technical analysis. By recognizing the flagpole , waiting for the breakout, and managing your risk effectively, you can increase the chances of a successful trade.
Have you traded using the Flag pattern?
Share your experiences in the comments below! Let’s learn together and keep improving our trading strategies!

Mastering the Double Bottom Pattern for Trend Reversal Trading!Understanding the Double Bottom Pattern: A Key to Trend Reversal
Hello Traders! Today, let’s dive into the Double Bottom Chart Pattern , a classic technical pattern that signals a potential reversal in a downtrend. The double bottom is considered one of the most reliable patterns for identifying trend reversals, especially in the context of bullish market movements .
This pattern is typically found when the price forms two consecutive lows , each close to the same level, with a peak (or “neckline”) in between. Once the price breaks above the neckline, it indicates a potential long entry point.
Identifying the Double Bottom Pattern
Formation: Recognized by two consecutive lows, the Double Bottom forms when the price hits a support level, bounces up, and then returns to retest the same low before reversing higher.
Neckline Breakout: The pattern is confirmed when the price breaks above the “neckline” (the resistance level formed between the two bottoms). This breakout is typically followed by a sharp upward movement.
Volume Confirmation: Volume typically increases during the breakout, confirming the pattern and signaling strong momentum.
Support Zone: The area between the two bottoms, where the price repeatedly tests support, is a key area for setting stop losses and defining your risk management.
Trading Strategy: Double Bottom Pattern
Entry Point: Consider entering a long position once the price breaks above the neckline, confirming a trend reversal.
Stop Loss: Place your stop loss just below the second bottom to minimize risk if the price retraces.
Profit Targets: Measure the distance from the bottom to the neckline and project that distance upwards from the breakout point to determine your potential target.
Real-World Application: Lumax Industries Case Study
Looking at the chart of Lumax Industries , we can see a perfect example of the Double Bottom Pattern from 2008-2010. After the price tested the support zone twice, it broke above the neckline, confirming the reversal and setting the stage for strong upward momentum. This would have been an excellent entry point for traders who understood the power of this chart pattern.
Risk Management Considerations
Position Sizing: Adjust your position size according to the risk involved in trading this pattern.
Stop Loss Placement: The stop loss should be placed below the second bottom to protect against potential false breakouts.
Patience & Confirmation: Wait for confirmation of the breakout, and ensure volume is increasing as the price breaks through the neckline.
What This Means for Traders
By mastering the Double Bottom Pattern , traders can confidently enter trend reversals and capitalize on the subsequent price movement.
Look for the pattern in downtrending markets to identify potential opportunities for reversal.
Use volume as confirmation to validate the breakout and avoid false signals.
Be disciplined with stop losses to manage risk while allowing for maximum reward.
Outcome:
The Double Bottom Pattern is a powerful tool for identifying trend reversals, and when used correctly, it can provide high-probability trade setups with excellent risk-to-reward ratios. By understanding its formation and applying proper risk management, traders can enhance their trading strategies and improve their overall performance.
What’s your experience with the Double Bottom pattern?
Have you used this pattern in your trading? How did it work for you? Share your thoughts in the comments below!

Bull Market vs. Bear Market: How to Trade Both Successfully!Bull Market vs. Bear Market: How to Trade Both Successfully!
Hello everyone! I hope you're all doing great in life and in your trading journey. Today, I bring an educational post on Bull Market vs. Bear Market —two crucial phases that every trader and investor must understand. Whether the market is rising or falling, having a strategy for both conditions is essential for success. Let’s break down the key differences, trading strategies, and opportunities in each market!
Bull Market vs. Bear Market: Key Differences
Market Direction:
Bull Market → A period when stock prices rise consistently , reflecting strong economic growth and investor confidence. Demand is higher than supply, pushing stock prices upward.
Bear Market → A period when stock prices fall continuously , usually due to economic downturns, high inflation, or external shocks. Fear dominates, and investors pull money out of the markets.
Trader & Investor Sentiment:
Bull Market → Optimism is high, and traders are willing to take more risks . Investors have a buy-and-hold mentality , expecting further gains.
Bear Market → Pessimism dominates, leading to panic selling . Investors focus on preserving capital instead of taking risks.
Risk & Reward:
Bull Market → Higher rewards , as most stocks trend upward. Corrections are usually short-lived, allowing traders to capitalize on price increases.
Bear Market → Higher risk , as market volatility increases. Stocks tend to fall sharply, leading to heavy losses for uninformed traders .
Strategy & Approach:
Bull Market Trading → Traders focus on momentum stocks, breakouts, and uptrend confirmations .
Bear Market Trading → Traders look for short-selling opportunities, hedging strategies, and defensive stocks .
Opportunities in Each Market:
Bull Market → Growth stocks, tech stocks, IPOs, and high-risk assets thrive in bull markets.
Bear Market → Defensive sectors like FMCG, Pharma, Gold, and Bonds perform well.
How to Trade in a Bull Market?
✔ Follow the Trend: Buy on dips near support levels and stay in the trade until the trend reverses.
✔ Use Momentum Indicators: RSI, MACD, and Moving Averages help in identifying strong uptrends and overbought conditions.
✔ Focus on Growth Stocks: Tech stocks, finance, and emerging market stocks tend to perform well in a bull market.
✔ Avoid Shorting the Market: Short trades have lower success rates in strong uptrends. Stick with trend-following strategies .
✔ Stay Invested Longer: A long-term buy-and-hold strategy is beneficial in bull markets as prices continue rising.
How to Trade in a Bear Market?
✔ Short-Selling Opportunities: Stocks with weak fundamentals fall harder during a bear market, creating opportunities for short trades.
✔ Look for Safe-Haven Assets: Gold, government bonds, and defensive stocks (FMCG, healthcare) tend to hold value.
✔ Use Stop-Loss & Position Sizing: Volatility increases in bear markets, making risk management crucial.
✔ Hedge Your Portfolio: Options strategies like put options, covered calls, and inverse ETFs can help protect investments.
✔ Wait for Signs of Reversal: Don't rush into trades—look for market bottom confirmations using volume, RSI divergence, and trendline breaks .
Outcome:
Both Bull and Bear Markets present profitable opportunities, but having the right strategy for each condition is key to success.
Which market do you find easier to trade— Bull or Bear? Let me know in the comments!

Trading vs. Investing: Which Strategy Suits You Best?Trading vs. Investing: Which One is Right for You?
Hello everyone! I hope you're all doing great in life and in your trading journey. Today, I am bringing an educational post on Trading vs. Investing , two different approaches to making money in the stock market. While both have their advantages, choosing the right one depends on your goals, risk appetite, and strategy . Let’s dive into the key differences and find out which style suits you best!
Trading vs. Investing: Key Differences
Time Horizon:
Traders aim for short-term profits , holding positions for minutes, hours, or days .
Investors hold stocks for months or years , focusing on long-term wealth creation .
Strategy & Approach:
Traders rely on technical analysis, charts, and price patterns to make quick decisions .
Investors focus on fundamental analysis , looking at company earnings, management, and growth potential .
Risk & Reward:
Trading is high risk but can offer quick returns if executed well.
Investing involves lower short-term risk but requires patience for long-term gains .
Capital & Leverage:
Traders often use margin and leverage to amplify gains (but also risk higher losses ).
Investors generally avoid leverage , focusing on steady capital appreciation .
Emotional Discipline:
Trading requires quick decision-making and emotional control to handle volatility .
Investing demands patience and the ability to ignore short-term market fluctuations .
Who Should Choose What?
✔ Choose Trading if: You prefer fast decision-making, market analysis, and short-term gains .
✔ Choose Investing if: You have patience, believe in long-term wealth building, and prefer lower risk .
✔ Hybrid Approach: Many successful market participants combine both strategies , trading for short-term profits and investing for long-term growth .
Outcome:
Both trading and investing have their place in the market. There’s no one-size-fits-all approach —the key is understanding your risk tolerance, time commitment, and financial goals .
Which one do you prefer? Trading, Investing, or Both? Let me know in the comments!

XAUUSD Analysis: Potential Bearish Pullback Towards Key Support📉 XAUUSD Daily Analysis 🔍
🚨 Potential for a Bearish Pullback 🚨
Gold (XAUUSD) is showing signs of a potential downward move after rejecting a key resistance level. If this momentum continues, we could see the price heading towards the support zone at 2680/2670.
💡 Key Insights:
📌 Market rejection at resistance = possible bearish momentum.
📌 Target support area: 2680/2670.
📌 Risk Management: Stick to 1-2% risk on trades.
⚠️ Historical Note:
When the market last hit an all-time high, it saw a sharp one-day drop. Stay cautious!
💬 Disclaimer: This is for educational purposes only. Always trade responsibly and manage your risk effectively.

EURUSD potetial BUY opportunityClosing price currently trade at 1.07978 a buy opportunity is envisaged from the current market price as we may continue to see price go up. Our Buy target TP1 is 1.08971 , TP2 is 1.09947. stop loss at 1.07714.
we can see a 50% retracement may come in upcoming days and now again after touching a long waited order block as mention in chart.
It's a good 1:72 RR trade.
I hope you will like my explanation.
it's just my analysis and you guys trade after your analysis.

CANFINHOME - The Ascending Triangle PatternCan Fin Homes Ltd has recently exhibited a notable range-bound movement, forming an ascending triangle pattern that highlights its price consolidation phase. The stock oscillated between key price levels, with a significant high of 938 on July 1st and a low of 680 on June 4th, before peaking at 909.80 on July 25th. This range-bound behavior reflects a period of accumulation and steady buying pressure, as the price repeatedly tests the horizontal resistance while respecting the upward-sloping support line. This consolidation phase is crucial as it sets the stage for a potential breakout, indicating that the stock is gearing up for a significant directional move. The pattern suggests that investors are increasingly optimistic, with the price confined within these key levels, paving the way for future volatility and trading opportunities. In this analysis, we will explore three key trading strategies for CANFINHOME based on the recent ascending triangle pattern. First, we will examine the Breakout Strategy, which capitalizes on the price movement once it surpasses key resistance levels. Next, we will discuss the Pullback Strategy, focusing on entering trades during price retracements to the breakout level. Finally, we will consider the Breakdown Strategy, which prepares for a potential bearish reversal if the price falls below critical support levels. Each strategy will be detailed with entry points, stop losses, and targets to help you make informed trading decisions.
In this analysis, we will explore three key trading strategies for CANFINHOME based on the recent ascending triangle pattern. First, we will examine the Breakout Strategy, which capitalizes on the price movement once it surpasses key resistance levels. Next, we will discuss the Pullback Strategy, focusing on entering trades during price retracements to the breakout level. Finally, we will consider the Breakdown Strategy, which prepares for a potential bearish reversal if the price falls below critical support levels. Each strategy will be detailed with entry points, stop losses, and targets to help you make informed trading decisions.
Breakout Strategy:
Entry Point: For an optimal entry, consider buying above 914 as an early signal or above 938 for a regular entry. This indicates a confirmed breakout from the ascending triangle pattern, signaling strong bullish momentum.
Stop Loss: Place your stop loss just below the support level of 838. This precautionary measure helps safeguard against potential reversals or false breakouts.
Target: Set your price target around 1196. This level is calculated by adding the vertical height of the triangle to the breakout point, reflecting the expected upward movement based on the pattern.
Rationale: Entering at 914 or 938 allows you to capitalize on the upward potential following the breakout. With a stop loss at 838, you manage risk effectively. The target of 1196 aligns with the pattern’s projection, maximizing your profit potential.
Pullback Strategy:
Entry Point: Look for a buying opportunity during a pullback to the breakout level around 914 or the support level of 903.85. This approach leverages a temporary price retracement to secure a more advantageous entry.
Stop Loss: Position the stop loss below the support level of 838 to mitigate risk in case the pullback evolves into a deeper correction.
Target: Maintain the target at approximately 1196, consistent with the breakout strategy.
Rationale: The pullback strategy offers a chance to enter at a better price while confirming the validity of the breakout. The stop loss below 838 provides protection against significant losses, and the target of 1196 remains aligned with the anticipated price movement.
Breakdown Strategy:
Entry Point: If the price drops below the key support level of 838, consider this a breakdown of the ascending triangle pattern. This shift indicates a bearish reversal and a potential shift in market sentiment.
Stop Loss: Set the stop loss above the support level of 838 to prevent substantial losses if the breakdown proves to be a false signal.
Target: For a breakdown scenario, the target will need to be adjusted based on new technical analysis of lower support levels. Immediate downside targets should be reevaluated as the situation unfolds.
Rationale: The breakdown strategy addresses the possibility of a bearish reversal when the support level is breached. The stop loss above 838 helps limit potential losses, while the target will depend on further analysis of the emerging support levels.
Conclusion :
The ascending triangle pattern for Can Fin Homes Ltd indicates a bullish outlook with a potential price target of 1196 if the breakout is confirmed. The breakout strategy aims to capture the upward trend, while the pullback strategy provides an opportunity to enter during a retracement. Conversely, the breakdown strategy prepares for a potential bearish scenario if the support level is breached. Each strategy includes specific entry points, stop losses, and targets, offering a comprehensive approach to trading based on the pattern’s analysis.
Disclaimer :
The information provided in this article is for educational and informational purposes only and should not be construed as financial advice. Trading and investing in the stock market involve risk, and you should consult with a qualified financial advisor before making any investment decisions. The author and the publisher are not responsible for any losses or damages that may occur as a result of using the information provided in this article. Past performance is not indicative of future results. Always conduct your own research and due diligence before making any investment decisions.
*** Hint*** Use a buffer at entry to avoid false breakout

ITC's Key Support & Resistance: Trade Smartly!Current Scenario:
• ITC is currently trading at ₹429.05, showing signs of consolidation.
• The stock has tested the support level twice (T1 and T2), indicating strong support around ₹402.90.
Key Levels:
• Entry Point: ₹416.25
• Stop Loss: ₹402.90
• Target Levels:
• Target 01: ₹437.90
• Target 02: ₹444.70
Analysis:
• The stock is forming a pattern where it respects the support level, which could be a good opportunity for a bullish entry.
• The previous low and support touches suggest that buyers step in around these levels, providing a safety net for long positions.
Trading Strategy:
• Bullish Scenario: Enter at ₹416.25 with a stop loss at ₹402.90. Look for the stock to move towards the first target of ₹437.90 and possibly extend to ₹444.70.
• Bearish Scenario: If the stock breaks below the stop loss level of ₹402.90, it might indicate further downside risk. In this case, it’s advisable to exit long positions to prevent losses.
Conclusion:
• ITC is showing a well-defined support and resistance structure, offering clear entry and exit points.
• Traders can leverage these key levels to strategize their trades effectively, minimizing risk while maximizing potential gains.
Keywords:
• ITC Stock
• Technical Analysis
• Support and Resistance
• Trading Strategy
• Entry Point
• Stop Loss
• Target Levels
• Market Analysis
• Stock Trends

"In a world of uncertainties, gold remains a timeless anchor"After facing rejection four times at the @2080 price level over a span of 1302 days, there's a compelling possibility of a breakout. Each rejection indicates a significant resistance point, but the frequency of attempts suggests growing pressure for a potential breakout.
