Zoom Out: Bitcoin’s 14-Year Structural Expansion Explained!Hey Everyone, let's analyse long term structural view on Bitcoin as it is once again sitting inside the same structural expansion channel it has respected for more than 14 years.
Zooming out removes the noise, what looks random on lower timeframes reveals a very consistent long-term pattern.
Most traders focus on headlines. Long-term moves are built on structure.
Bitcoin has never moved randomly on higher timeframes. Every major cycle since 2011 has expanded inside a rising macro channel driven by demand, time, and liquidity.
Each cycle looks different on the surface, but the internal structure remains the same, higher lows forming on macro support, followed by exponential expansion phases.
Current price is still respecting the long-term rising structure, with buyers consistently stepping in near the lower boundary of the channel.
The upper zone shown is not a prediction. It represents the historical expansion boundary where previous cycles matured and volatility peaked.
As long as the macro structure remains intact, the probability continues to favor structural continuation rather than random collapse.
Key takeaway:
Markets don’t repeat perfectly, but they rhyme .
And Bitcoin has been speaking the same structural language for over a decade.
Conclusion:
This is not about catching tops or bottoms.
It’s about understanding where you are in the cycle , and acting accordingly.
If this structural perspective helped you, like, comment, and follow for more long term market studies.
Analysis By @TraderRahulPal | More analysis & educational content on my profile.
⚠️ DISCLAIMER: This analysis is for educational purposes only and reflects a long term structural view. It is not financial advice. Always manage risk and do your own research before making trading or investment decisions.
Marketcycles

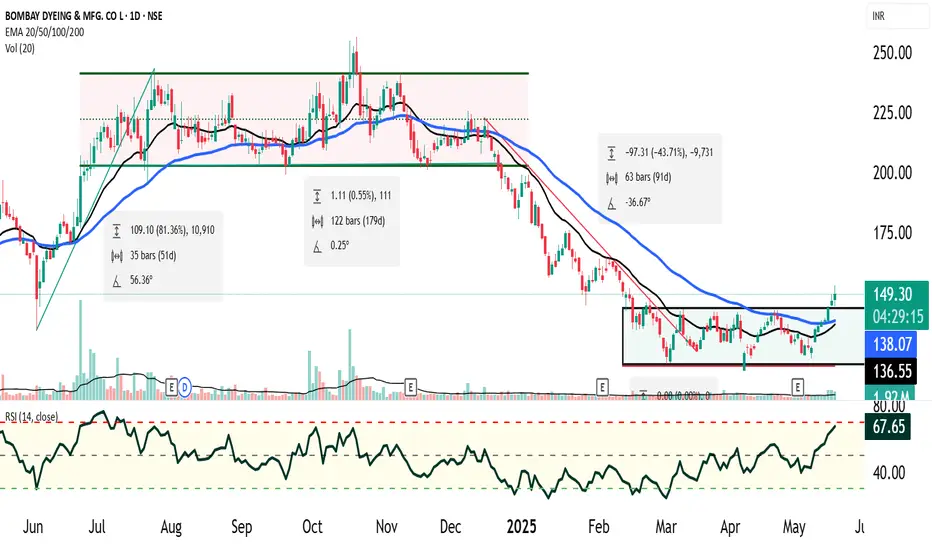
Bombay Dyeing : Market Cycle Recap✅ 1. Markup Phase (4 June 2024 – 25 July 2024)
Price movement: ~80% rally.
1. RSI behavior: RSI stayed above neutral (never oversold), frequently nearing overbought.
2. Volume: Increasing — confirmation of strong upside momentum.
3. Participants: Smart money and institutions led the rally.
🚨 2. Distribution Phase (~6 Months)
Price action: Sideways movement in a 20% range
1. Volume: Likely choppy or decreasing, with spikes on down days — a classic distribution sign.
2. RSI: Range-bound between 40–60 — no trend, loss of momentum.
3. Participants: Institutions unloading to retail/inexperienced participants.
🔻 3. Markdown Phase
Breakdown: Support breached after distribution range.
1. Price movement: Dropped ~50% from support breakout.
2. RSI: Frequently oversold — sign of strong weakness.
3. Volume: Likely increased on down days — panic selling.
🧱 4. Accumulation Phase (Last 3 Months)
Price action: Consolidated in ~15% narrow range.
1. RSI: Did not touch oversold zone — indicates seller exhaustion.
2. Participants: Value investors, smart money slowly building positions.
3. Volume: Gradually increasing — early signs of interest.
🔔 Current Technical Signal (20 May 2025)
Breakout: Price has now closed above the resistance of the accumulation range.
Volume: Above-average — confirms breakout strength.
1. RSI: Approaching overbought zone — sign of bullish momentum returning.
2. Price is above 20 EMA and 50 EMA.
3. Expected bullish crossover or confirmation already happened.
📊 Interpretation: Strong Bullish Reversal in Progress
Smart money has likely finished accumulating. Breakout from the accumulation zone with volume, RSI trend, and moving average confirmations all suggest the early stage of a new markup phase is starting. This could be the start of a fresh uptrend or the first leg of a longer bullish swing, especially if:
Broader market supports cyclical or value stocks.
Company-specific fundamentals (earnings, business outlook) align with technical cues.
✅ Actionable Steps (Not Financial Advice)
Entry:
Traders: Consider entry near breakout retest (if occurs).
Investors: Start building position gradually if long-term reversal is confirmed.
Risk Management:
Stop-loss: Just below the accumulation range (tight) or recent swing low (looser).
Position sizing based on volatility and risk appetite.
Targets:
Near-term: 15–20% move based on accumulation range height.
Medium-term: 50–80% potential if this is a true markup phase (mirroring last cycle).
Confirmation Factors:
Look for increasing volume in subsequent up candles.
Weekly close above breakout zone.
Fundamental support (news, earnings upgrade, insider buying, etc.).
If you'd like, I can also:
Draw a price cycle chart based on your description.
Help you draft a trade plan or investment thesis.
Pull recent news or updates on Bombay Dyeing (using live data).
Let me know how you'd like to proceed!
Master the Market Cycles – When to Buy, Sell & Avoid Crashes!The Hidden Truth About Economic Cycles – How Smart Investors Stay Ahead!
Did you know that every financial market moves in cycles? Stocks, real estate, gold, and cryptocurrencies all follow predictable boom-and-bust patterns.
Understanding these cycles can help you buy at the right time, sell before the crash, and protect your wealth from market downturns. This is how smart investors in India and around the world build long-term financial success.
📌 The image below reveals the key to timing the market like a pro – let’s break it down!
🟢 Phase “C” – The Best Time to Invest (When Everyone is Fearful!)
This phase happens when the economy is struggling, stock markets are down, real estate prices are low, and news headlines are full of negative sentiment.
💡 But this is actually the best time to invest!
✔ When the majority panics and sells at low prices, smart investors start accumulating assets.
📌 According to historical cycles, 2023, 2032, and 2039 are ideal buying years.
➡ If you buy during these downturns, you position yourself for massive profits when the market recovers!
🔵 Phase “B” – The Time to Sell (When Everyone is Greedy!)
As the economy recovers, asset prices rise, and people rush to invest. You will see headlines like:
📈 "The Sensex is breaking records – Everyone is making money!"
🏡 "Real estate is booming – No signs of slowdown!"
🪙 "Crypto is the future – Buy now before it’s too late!"
💡 But this is when smart investors sell their assets.
✔ Those who bought during “Phase C” now take profits before the next downturn.
📌 According to market cycles, 2026, 2034, and 2043 are great years to sell assets.
➡ If you don’t sell at this stage, you risk being trapped in the next market crash!
🔴 Phase “A” – The Time to Stay Out (Market Panic Begins!)
This is the danger zone. The economy overheats, speculation is at its peak, and eventually, the market crashes.
💡 Investors who ignored warning signs now panic and sell at a loss.
✔ Smart investors already exited before this stage – they are waiting for the next buying opportunity.
📌 Based on historical trends, 2035 and 2053 could be high-risk years.
➡ If you cashed out in Phase B, stay away and wait for the next buying cycle in Phase C.
🎯 How to Profit from Economic Cycles (Indian Market Strategy)
✅ Buy when the market crashes ("C") – When everyone is fearful.
✅ Hold and wait for recovery – Let your investments grow.
✅ Sell when markets are overheated ("B") – Before the crowd realizes the peak.
❌ Avoid high-risk years ("A") – When bubbles burst and panic selling begins.
⚡ This is how India’s top investors build wealth – by understanding cycles, not following trends!
💬 Are you investing with the cycle or against it? Share your thoughts in the comments! 🚀🔥

Howard Marks: The Mastermind of Risk Management & Market Cycles!Hello Traders!
Today, let’s talk about Howard Marks , the legendary investor, co-founder of Oaktree Capital , and the author of the must-read book The Most Important Thing . Marks is best known for his deep understanding of market cycles, risk management, and contrarian investing. His insights have helped institutional and retail investors navigate bull and bear markets with precision. Let’s break down his investment principles and strategies!
1. Who is Howard Marks?
Howard Marks is a billionaire investor and the co-founder of Oaktree Capital Management, one of the world’s largest investment firms focused on distressed debt and value investing.
He gained legendary status by predicting multiple market cycles , including the 2008 financial crisis , helping investors protect capital during downturns.
His memos are widely followed by hedge funds, top investors, and institutions , including Warren Buffett, who once said, “When I see a memo from Howard Marks, I read it immediately.”
2. Howard Marks’ Key Investment Principles
Understanding Market Cycles is Key: Markets move in cycles of greed and fear, and the best investors adjust their strategy based on the cycle stage.
Risk Control is More Important Than Returns: Successful investors ** don’t chase high returns —they focus on managing risk and avoiding big losses.
Contrarian Investing Pays Off: Marks believes in buying when others are fearful and selling when others are greedy.
The Price You Pay Determines Your Return: Buying undervalued assets reduces risk and increases long-term gains.
Patience & Discipline Win in the Long Run: Timing the market is hard, but sticking to a solid investment process leads to consistent success.
3. How to Apply Howard Marks' Strategy in Trading & Investing
Analyze Market Cycles: Identify if we’re in a bullish, bearish, or sideways market and adjust your strategy accordingly.
Focus on Risk Management: Always use stop-losses, position sizing, and portfolio diversification to protect your capital.
Avoid Market Euphoria & Panic: Don't buy into hype when markets are overheated, and don’t panic-sell in crashes.
Look for Asymmetrical Risk-Reward Trades: Enter trades where the upside potential is significantly higher than the downside risk.
Think Long-Term, Not Short-Term: Marks believes in value investing and strategic patience, not emotional decision-making.
4. What Traders & Investors Can Learn from Howard Marks
Success in markets comes from understanding risk first, returns second.
Great investors don’t predict the future—they prepare for different market scenarios.
Having a margin of safety is crucial for long-term wealth protection.
Smart investing is about probabilities, not guarantees.
Market cycles repeat—history always leaves clues for those who study it!
Conclusion
Howard Marks’ wisdom on market cycles, risk control, and contrarian investing is essential for any serious trader or investor. His approach teaches us to stay patient, manage risk, and take advantage of market inefficiencies. By studying cycles, being disciplined, and focusing on risk-adjusted returns, you can build a strong, sustainable trading strategy!
Which of Howard Marks’ principles do you follow in your trading? Let’s discuss below!👇

Raoul Pal’s Investment Edge: The Art of Predicting Market ShiftHello Traders! First of all, no, this is not about me! 😆 I am Rahul Pal , and this is about Raoul Pal , the legendary macro investor! But don’t worry— my time will come too! Until then, let’s take this opportunity to learn from one of the best in the game and explore his key investment principles and strategies that have made him a market icon.
Raoul Pal is not just another investor—he is a master of macro trends who has successfully predicted major shifts in financial markets, global liquidity cycles, and the rise of digital assets. From his early bets on Bitcoin and Ethereum to his deep understanding of monetary policies and their impact on financial markets , his approach has helped thousands of traders and investors navigate volatile conditions and stay ahead of the curve.
So, let’s break down his top investing lessons and see how we can apply them to build wealth, manage risks, and seize big market opportunities!
Raoul Pal’s Key Investment Strategies
Macro Investing Approach – Pal focuses on big-picture economic trends, analyzing global debt cycles, interest rates, and monetary policies to predict major market movements.
Early Crypto Adoption – He was one of the early institutional investors to bet big on Bitcoin and Ethereum, predicting their rise as alternative financial systems.
Liquidity Matters More Than Fundamentals – Pal believes that liquidity in financial markets drives asset prices more than just company fundamentals.
Bet on Big Trends Early – He identified major shifts in technology, crypto, and decentralized finance (DeFi) before mainstream adoption.
Understanding Market Cycles – He studies boom-and-bust cycles to anticipate major economic shifts and position himself accordingly.
Diversification with a Focus on Asymmetry – Pal emphasizes investments with high potential upside and limited downside risks, such as Bitcoin and tech stocks.
Raoul Pal’s Bold Market Predictions
Bitcoin to Reach $1M? – Pal has predicted massive upside potential for Bitcoin, citing global money printing and institutional adoption.
The Rise of Digital Assets – He believes that crypto, NFTs, and tokenized assets will be a major part of the financial future.
US Dollar Liquidity Crisis – Pal has warned about potential economic instability caused by excessive debt and monetary easing.
What Traders Can Learn from Raoul Pal
Follow the Macro Trends – Pay attention to global interest rates, central bank policies, and economic cycles to position yourself ahead of big moves.
Be Open to New Asset Classes – Consider crypto, technology, and emerging financial innovations for long-term wealth creation.
Risk Management is Key – Even with bold predictions, Pal manages risk and focuses on asymmetrical returns.
Adopt a Long-Term Perspective – Major trends don’t happen overnight, so patience is crucial when investing in macro shifts.
Conclusion
Raoul Pal’s macro investing strategies provide valuable insights into navigating global markets, identifying emerging trends, and managing risk effectively. His focus on big-picture thinking has helped him stay ahead of market shifts, making him a legend in the world of investing.
Do you follow macro trends in your trading? Let me know in the comments! 👇

Bull Market vs. Bear Market: How to Trade Both Successfully!Bull Market vs. Bear Market: How to Trade Both Successfully!
Hello everyone! I hope you're all doing great in life and in your trading journey. Today, I bring an educational post on Bull Market vs. Bear Market —two crucial phases that every trader and investor must understand. Whether the market is rising or falling, having a strategy for both conditions is essential for success. Let’s break down the key differences, trading strategies, and opportunities in each market!
Bull Market vs. Bear Market: Key Differences
Market Direction:
Bull Market → A period when stock prices rise consistently , reflecting strong economic growth and investor confidence. Demand is higher than supply, pushing stock prices upward.
Bear Market → A period when stock prices fall continuously , usually due to economic downturns, high inflation, or external shocks. Fear dominates, and investors pull money out of the markets.
Trader & Investor Sentiment:
Bull Market → Optimism is high, and traders are willing to take more risks . Investors have a buy-and-hold mentality , expecting further gains.
Bear Market → Pessimism dominates, leading to panic selling . Investors focus on preserving capital instead of taking risks.
Risk & Reward:
Bull Market → Higher rewards , as most stocks trend upward. Corrections are usually short-lived, allowing traders to capitalize on price increases.
Bear Market → Higher risk , as market volatility increases. Stocks tend to fall sharply, leading to heavy losses for uninformed traders .
Strategy & Approach:
Bull Market Trading → Traders focus on momentum stocks, breakouts, and uptrend confirmations .
Bear Market Trading → Traders look for short-selling opportunities, hedging strategies, and defensive stocks .
Opportunities in Each Market:
Bull Market → Growth stocks, tech stocks, IPOs, and high-risk assets thrive in bull markets.
Bear Market → Defensive sectors like FMCG, Pharma, Gold, and Bonds perform well.
How to Trade in a Bull Market?
✔ Follow the Trend: Buy on dips near support levels and stay in the trade until the trend reverses.
✔ Use Momentum Indicators: RSI, MACD, and Moving Averages help in identifying strong uptrends and overbought conditions.
✔ Focus on Growth Stocks: Tech stocks, finance, and emerging market stocks tend to perform well in a bull market.
✔ Avoid Shorting the Market: Short trades have lower success rates in strong uptrends. Stick with trend-following strategies .
✔ Stay Invested Longer: A long-term buy-and-hold strategy is beneficial in bull markets as prices continue rising.
How to Trade in a Bear Market?
✔ Short-Selling Opportunities: Stocks with weak fundamentals fall harder during a bear market, creating opportunities for short trades.
✔ Look for Safe-Haven Assets: Gold, government bonds, and defensive stocks (FMCG, healthcare) tend to hold value.
✔ Use Stop-Loss & Position Sizing: Volatility increases in bear markets, making risk management crucial.
✔ Hedge Your Portfolio: Options strategies like put options, covered calls, and inverse ETFs can help protect investments.
✔ Wait for Signs of Reversal: Don't rush into trades—look for market bottom confirmations using volume, RSI divergence, and trendline breaks .
Outcome:
Both Bull and Bear Markets present profitable opportunities, but having the right strategy for each condition is key to success.
Which market do you find easier to trade— Bull or Bear? Let me know in the comments!

John Paulson: The Man Who Bet Against the Housing MarketHello everyone, I hope you all are doing great in your life and trading journey! Today, I am bringing you an educational post on John Paulson , a hedge fund manager who made one of the greatest trades in history. His story is a perfect example of research, patience, and contrarian thinking in the financial markets.
Paulson became famous for his big short on the U.S. housing market in 2008 , earning billions while most traders suffered losses. But his success didn't come overnight—he spent years analyzing market flaws before making his legendary bet. His journey teaches us the importance of independent research, risk management, and recognizing market cycles.
John Paulson’s Key Trading & Investing Principles
Do Your Own Research: Paulson’s biggest win came from independent analysis, not following the crowd. Dig deep into fundamentals before making a move.
Look for Asymmetrical Bets: His short position on the housing market had limited downside but massive upside—a key principle in smart investing.
Patience is a Superpower: He held onto his bet for years despite skepticism, proving that conviction in research is essential for success.
Understand Market Cycles: Recognizing when assets are overvalued or undervalued can help traders and investors position themselves profitably.
Risk Management is Everything: Even with high conviction trades, he managed his risk, ensuring he didn’t overexpose his capital.
Contrarian Thinking Wins Big: The best opportunities often lie where the majority is blind. Paulson went against the mainstream belief and won big.
What This Means for Traders:
By following Paulson’s approach, traders can identify high-reward, low-risk opportunities, avoid herd mentality, and develop a strategic mindset for long-term success.
Outcome:
Applying these principles can help you navigate market cycles wisely, take calculated risks, and make profitable decisions in both bullish and bearish conditions.
What’s your biggest lesson from legendary traders? Share your thoughts in the comments!

Paul Tudor Jones: From Failure to Billionaire TraderHello everyone, I hope you all are doing great in life and in your trading journey. Today, I have brought another educational post, this time on Paul Tudor Jones—a legendary trader known for his exceptional risk management, market predictions, and macro trading strategies. His ability to anticipate market cycles and protect capital has made him one of the greatest traders in history. Let’s dive into his key trading principles and learn how to apply them in our own trading and investing to achieve long-term success!
Paul Tudor Jones is a legendary hedge fund manager known for predicting the 1987 Black Monday crash and making a 200% return while others lost billions. But his journey wasn’t easy.
After graduating, he got a job as a floor trader, but he was fired for falling asleep on the job! Instead of giving up, he worked tirelessly, learning from his mistakes. In 1980, he started his hedge fund, Tudor Investment Corp, and focused on risk management, macro trends, and discipline.
His breakthrough came when he predicted the 1987 market crash using historical data and shorted the market at the perfect time, securing one of the biggest trading wins in history. His journey proves that persistence, adaptability, and risk control are the keys to trading success.
Paul Tudor Jones' Trading Rules for Success
Risk Management is Everything: Always protect your capital first. Jones emphasizes that good traders play great defense, not just offense.
Cut Losses Quickly: Never hold onto a losing trade hoping it will turn around. Jones believes in taking small losses early to avoid major damage.
Ride the Winners: Let profitable trades run while keeping a trailing stop-loss. This helps maximize gains while minimizing risks.
Anticipate Market Crashes: In 1987, he predicted Black Monday and made a 200% return by shorting the market. He believes in preparing for extreme market events.
Focus on Macro Trends: Jones follows economic cycles, interest rates, and global events to understand market movements.
Have a Trading Plan: Every trade should be backed by analysis, a strategy, and a risk-management plan. Don’t trade based on emotions.
Be Adaptable: Markets evolve, and so should traders. Jones always adjusts his strategies based on new data and changing trends.
What This Means for Traders:
By applying Paul Tudor Jones’ principles, you can develop a disciplined and flexible trading strategy that focuses on risk management and long-term success.
Outcome:
These lessons will help traders protect capital, identify big opportunities, and manage market cycles effectively—just like Paul Tudor Jones.

Nifty Analysis: Monthly Log ScaleThis chart presents three major cycles. Each cycle representing a decade. First cycle worked in 90s; second one in the first decade of 21st century and the third one in the second decade. Perhaps we are in the fourth cycle that would represent the third decade.
The first two major cycles ended with more than 62% percent correction of the entire decadal bull run. The third cycle (recent 2020) was an exception with 40% correction.
There are many ups and down, in each decadal major cycle, called the minor cycles. Every minor cycle also faced 40-62% correction of its impulse.
So if we assume that a top has been in place at 18600 high, then a 40-62% minor corrective wave might land up near 13000 or so. This level should be treated as a good investment zone for long term decadal run which can take Nifty much higher.
I am assuming that a top is in place but market may make multiple attempts to break the highs before it actually starts correction. Also this is a monthly chart so things might take time to show up some results. So be patient.
If you are feeling missed out in this rally then this is definitely not the spot to enter for longer term. Waiting for a better bargain is always good for making fresh investment.
Hope you understand my point.
Regards.

NIFTY 50 : Since 90sThere is lot of useful information for traders and investors. So not writing much in notes. May be you will have to adjust your charts to accommodate everything so no excuses for that.
JJSingh
