#BANKNIFTY PE & CE Levels(29/01/2026)Bank Nifty is expected to open flat, indicating a pause in momentum after the recent sharp recovery from lower levels. Such flat openings generally signal indecision in the market, especially when the index is trading close to an important resistance zone. At present, Bank Nifty is hovering near the 59550–59600 area, which has acted as a strong supply zone in recent sessions. This makes today’s trade more level-driven, with higher chances of range-bound movement and sudden volatility around key levels.
From a broader structure perspective, the index has bounced strongly from the sub-58500 region, mainly due to short covering. However, as price approaches higher resistance zones, fresh buying strength needs confirmation. Until that happens, the market may either consolidate in a narrow range or show false breakouts followed by quick reversals. Traders should avoid anticipating moves and instead react to confirmed price action.
On the bullish side, if Bank Nifty manages to sustain above 59550 on a 15-minute closing basis, it would indicate that buyers are gaining control despite the overhead supply. In such a scenario, call options can be considered above 59550. The first upside target would be around 59750, which is a minor resistance and a good zone for partial profit booking. If momentum continues, the next levels to watch are 59850 and then 59950 or higher. Near the 60000 psychological level, strong profit booking is expected, so trailing stop-loss becomes crucial for long positions.
On the bearish side, failure to hold above 59550 followed by a breakdown below the 59450–59400 zone would indicate rejection from higher levels. This would open the door for a corrective move. In that case, put options can be considered around 59450–59400. The immediate downside targets would be 59250 and then 59150. If selling pressure increases, the index could drift toward the 59050–59000 support zone. A clear break below 59050 would weaken the structure further, though such a move would likely require negative global cues or heavy institutional selling.
For intraday traders, the zone between 59450 and 59550 should be treated as a no-trade area, as price action here can be choppy and misleading. The best trades are expected only after the market shows clear acceptance above resistance or below support. Partial profit booking at every target and strict risk management are essential due to the possibility of sudden spikes on either side.
Overall, Bank Nifty is at a crucial decision point. Sustained trade above 59550 favors bullish continuation, while rejection and breakdown below 59400 may lead to a pullback. The session is likely to be volatile but structured, rewarding traders who stick to levels, wait for confirmation, and avoid emotional or over-leveraged positions.
Marketmaker

ACTUSDT – Sell Setup (Futures | Intermediate)ACTUSDT – Sell Setup (Futures | Intermediate)
ACTUSDT is showing clear signs of weakness after failing to sustain above the recent resistance zone. Price action suggests sellers are regaining control, with lower highs forming and momentum shifting to the downside. A sell-stop entry at 0.02797 is planned to confirm continuation below support. If bearish momentum accelerates, price is expected to move toward 0.02739 as the first target, followed by 0.02677, which aligns with the next demand zone. The stop loss at 0.02884 is placed above the invalidation level to protect against false breakdowns. Overall, the structure favors continuation selling as long as price remains below resistance and broader market sentiment stays neutral to bearish.

The Modern Market Explosion: Dynamics, Drivers, and Implications1. Technological Revolution as a Catalyst
At the heart of the modern market explosion lies the technological revolution. Advancements in computing power, cloud technologies, artificial intelligence (AI), blockchain, and high-frequency trading have reshaped how markets operate. Trading that once took hours or days can now occur in milliseconds, allowing for near-instantaneous execution of orders. Automated trading algorithms can respond to micro-movements in the market, amplifying both liquidity and volatility.
The rise of fintech platforms has democratized access to markets, allowing retail investors to participate in arenas that were once dominated by institutional players. Mobile trading apps, digital wallets, and online brokerage platforms have exponentially increased the volume of participants in stock, cryptocurrency, and derivatives markets. This surge in participation has not only inflated trading volumes but has also created price swings driven by social sentiment, speculation, and viral trends—phenomena particularly visible in meme stocks and digital asset markets.
2. Globalization and Interconnected Markets
Globalization has intensified market interdependence. Modern markets are no longer isolated; a major economic event in one country reverberates across the world in real-time. Supply chain disruptions in East Asia, geopolitical conflicts in Europe, or policy shifts in the United States can instantaneously affect stock indices, commodity prices, and currency valuations across multiple continents.
Emerging markets have become key drivers of this explosive growth. Economies in Asia, Africa, and Latin America, leveraging technology and international trade, are attracting massive foreign investments. Capital flows across borders are faster and larger than ever, contributing to dynamic asset reallocation and, occasionally, market bubbles. Globalization has also intensified competition, forcing companies to innovate rapidly and adopt digital solutions to remain relevant, further energizing sectors like technology, e-commerce, and renewable energy.
3. Investor Psychology and Behavioral Shifts
The modern market explosion is heavily influenced by investor psychology. Behavioral finance has highlighted that markets are not purely rational; human emotions, herd behavior, and cognitive biases play critical roles. Social media platforms, online forums, and news aggregators amplify information and, in some cases, misinformation. Platforms like Reddit, Twitter, and Telegram have empowered collective action among retail investors, creating sudden surges in trading activity and price volatility.
This phenomenon has been vividly observed in meme stocks, cryptocurrencies, and trending tech shares. Fear of missing out (FOMO), speculative mania, and rapid shifts in sentiment contribute to market explosions, often decoupling asset prices from traditional valuation metrics. The combination of retail-driven momentum and institutional responses forms a feedback loop that accelerates price movements, creating both opportunities and risks.
4. Monetary Policies and Liquidity Surges
Central banks worldwide have played a significant role in the explosive growth of modern markets. In response to financial crises, pandemics, and recessions, central banks have implemented unprecedented monetary interventions, including near-zero interest rates, quantitative easing, and direct market support. These policies have flooded global markets with liquidity, encouraging borrowing, investment, and risk-taking.
High liquidity environments often push investors toward higher-yielding assets such as equities, real estate, and alternative investments, inflating prices. This influx of capital has amplified market bubbles, accelerated technological sector valuations, and supported the rapid rise of digital assets. However, this liquidity-driven expansion is fragile, sensitive to interest rate adjustments, inflationary pressures, and geopolitical uncertainties, making modern markets highly reactive to policy signals.
5. Sectoral Shifts and Innovation Drivers
Certain sectors have emerged as key drivers of the modern market explosion. Technology, artificial intelligence, biotechnology, renewable energy, and electric vehicles are attracting enormous capital inflows due to their disruptive potential. Startups in these sectors are achieving valuations in record times, often reaching “unicorn” status within a few years of founding.
Digital transformation across traditional industries—finance, healthcare, logistics, and manufacturing—has also created new market opportunities. Cloud computing, data analytics, Internet of Things (IoT), and AI-driven automation have increased productivity and generated investor optimism. These sectors often experience rapid price appreciation as innovation expectations sometimes outpace earnings, further contributing to market acceleration and speculative excitement.
6. Cryptocurrency and Decentralized Finance (DeFi)
Cryptocurrencies and decentralized finance platforms have added a new dimension to the modern market explosion. Blockchain technology enables digital assets to exist outside traditional banking systems, creating entirely new marketplaces for investment and exchange. Bitcoin, Ethereum, and other cryptocurrencies have experienced explosive growth, driven by both institutional adoption and retail enthusiasm.
DeFi platforms allow peer-to-peer lending, borrowing, and trading without intermediaries, challenging traditional financial systems. These innovations have increased market accessibility, liquidity, and speculative potential, creating a high-risk, high-reward environment. Cryptocurrencies also respond to global macroeconomic trends, regulatory developments, and social media-driven hype, contributing to sudden market surges and declines.
7. Risks, Volatility, and Market Sustainability
While the modern market explosion presents enormous opportunities, it is accompanied by heightened risks. Volatility has intensified, with sudden price swings becoming commonplace. The interconnected nature of global markets means that crises can propagate rapidly, as seen during events like the 2008 financial crisis and the COVID-19 pandemic.
Overvaluation of certain sectors, speculative bubbles, geopolitical tensions, cyber threats, and policy missteps are persistent risks. Investors must balance the allure of rapid gains with disciplined risk management. Market regulation, transparency, and investor education remain critical to sustaining long-term growth while mitigating systemic risks.
8. Implications for Businesses, Investors, and Society
The explosion of modern markets has broad implications beyond finance. Businesses face pressure to innovate, scale quickly, and adopt digital solutions. Investors encounter both unprecedented opportunities and challenges in portfolio diversification, risk management, and information analysis. Society, in turn, experiences economic benefits through job creation, technological advancement, and increased access to capital, but also faces risks related to inequality, market speculation, and financial instability.
Financial literacy and technological understanding have become essential for navigating the modern market. Stakeholders who leverage data analytics, AI tools, and global market intelligence gain a strategic advantage, while those who fail to adapt risk being left behind.
9. Conclusion
The modern market explosion is a multifaceted phenomenon driven by technology, globalization, investor behavior, policy interventions, and sectoral innovation. It is characterized by rapid growth, high liquidity, speculative surges, and heightened volatility. While it offers remarkable opportunities for wealth creation, entrepreneurship, and global economic integration, it also demands sophisticated risk management, regulatory oversight, and informed participation.
Understanding the interplay between technology, capital flows, investor psychology, and policy dynamics is crucial for anyone seeking to navigate these markets successfully. The modern market is not merely expanding; it is accelerating, transforming, and redefining the global economic landscape at an unprecedented pace. Investors, businesses, and policymakers must embrace agility, knowledge, and strategic foresight to harness its potential while mitigating its inherent risks.
[INTRADAY] #BANKNIFTY PE & CE Levels(28/11/2025)Bank Nifty is expected to open flat today, indicating a neutral start with no immediate directional push from buyers or sellers. If the index sustains above the 59550–59600 zone, the buying setup becomes active with upside targets of 59750, 59850, and 59950+. A further breakout above 60050–60100 can continue the bullish momentum toward 60250, 60350, and 60450+.
On the downside, any weakness will be confirmed only if Bank Nifty slips below the 59450–59400 level, which will activate the reversal setup with downside targets of 59250, 59150, and 59050-. Since the opening is flat, the initial movement may remain range-bound, and a decisive break above or below key levels will determine the intraday trend.

[INTRADAY] #BANKNIFTY PE & CE Levels(13/11/2025)Bank Nifty is likely to open with a gap up near the 58,400–58,450 zone, indicating positive sentiment after yesterday’s consolidation phase. The index is currently hovering close to its key resistance area, and a decisive move above this zone could lead to further momentum on the upside.
If Bank Nifty sustains above 58,500–58,550, traders can look for buying opportunities, targeting 58,750, 58,850, and 58,950+. A breakout beyond 58,950 could trigger a sharp rally toward the 59,100–59,200 zone.
On the downside, support lies at 58,050, followed by 57,950. A fall below 57,950 may invite mild selling pressure, leading to targets around 57,750–57,550.
Overall, with a gap up opening, market tone remains slightly bullish, but traders should wait for sustained movement above 58,550 for confirmation of upward continuation. If the index fails to hold above 58,450, a short-term pullback cannot be ruled out. Keeping a trailing stop loss and partial profit booking is advisable in this volatile range.

XAUUSD BUY TRADE PLAN🔱 VALHALLA CORE — XAUUSD (1H) TRADE PLAN
Date: 24 Oct 2025
🧭 Market Outlook:
Gold dropped hard from the 4,150 area after rejecting the Golden Zone (50–61.8% retracement).
Now heading toward our main BUYING ZONE at 4,012–4,004 where we’ll look for a bullish setup.
📉 If Price Pulls Back Up:
Sell zone: 4,092–4,150 (Golden Area / Supply zone)
SL: Above 4,165
TP1: 4,035
TP2: 4,010 (Buying Zone)
📈 If Price Drops to Buying Zone:
Buy zone: 4,012–4,004
SL: Below 3,995
TP1: 4,092
TP2: 4,120–4,150
💡 Plan Summary:
Short from the Golden Area = continuation trade.
Buy from the Buying Zone = reversal setup.
Wait for 1H confirmation before entry (strong candle or rejection wick).
Always move SL to BE after TP1 hits.

Introduction and Types of Financial Markets1. Introduction to Financial Markets
A financial market is a marketplace where buyers and sellers engage in trading financial assets such as stocks, bonds, currencies, and derivatives. These markets play a crucial role in the financial system by ensuring the allocation of resources, facilitating liquidity, and enabling price discovery.
1.1 Definition
Financial markets can be defined as structured systems through which financial instruments are issued, bought, sold, or exchanged. These instruments represent claims on real assets or future income and include equities, debt instruments, currencies, and derivatives.
Key definitions:
Investopedia: "A financial market is any marketplace where trading of securities occurs, including the stock market, bond market, forex market, and derivatives markets."
Mishkin and Eakins: "Financial markets are markets where funds are transferred from savers to borrowers."
1.2 Importance of Financial Markets
Financial markets serve as a backbone for economic growth. Some of their major functions include:
Capital Formation: Financial markets channel funds from savers to investors, facilitating business expansion and economic development.
Liquidity: Investors can quickly buy or sell financial instruments, ensuring access to cash when needed.
Price Discovery: Financial markets determine the price of assets based on supply and demand dynamics.
Risk Management: Markets offer instruments such as derivatives to hedge against price fluctuations.
Efficiency: Efficient markets ensure optimal allocation of resources, reducing the cost of capital for businesses.
Economic Indicator: The performance of financial markets often reflects the health of an economy.
2. Key Functions of Financial Markets
Financial markets are not just for trading—they perform several vital functions that sustain the economy:
Mobilization of Savings: They attract individual and institutional savings and channel them into productive investments.
Facilitating Transactions: They enable the smooth transfer of funds between buyers and sellers.
Reducing Transaction Costs: Standardized processes reduce the cost of trading and make markets efficient.
Providing Marketability: Investors can sell securities quickly in liquid markets without significant losses.
Credit Availability: Financial markets provide mechanisms for borrowing and lending funds for various purposes.
Investment Opportunities: They provide diverse options for investing based on risk-return preferences.
Regulation and Stability: Well-regulated financial markets ensure transparency, fairness, and stability.
3. Classification of Financial Markets
Financial markets can be classified based on different criteria, such as the type of instrument traded, maturity period, and mode of trading. Broadly, they are divided into money markets and capital markets.
3.1 Money Market
The money market deals with short-term debt instruments that typically mature within one year. It is essential for managing liquidity in the economy.
Characteristics:
Short-term instruments
Low risk and low returns
High liquidity
Participants include commercial banks, corporations, and governments
Major Instruments in Money Market:
Treasury Bills (T-Bills): Government-issued short-term securities with maturities ranging from 91 to 364 days.
Commercial Paper (CP): Unsecured, short-term promissory notes issued by corporations to meet working capital needs.
Certificates of Deposit (CDs): Time deposits offered by banks, tradable in secondary markets.
Repurchase Agreements (Repos): Short-term borrowing using securities as collateral.
Significance: Money markets allow governments, banks, and corporations to efficiently manage short-term funding requirements.
3.2 Capital Market
The capital market deals with long-term securities with maturities beyond one year. It is divided into the primary market and the secondary market.
3.2.1 Primary Market
The primary market is where new securities are issued for the first time. It is crucial for capital formation.
Initial Public Offering (IPO): Companies raise funds from the public by issuing shares.
Follow-on Public Offer (FPO): Additional shares are issued by a company after an IPO.
Private Placements: Securities are sold directly to a limited number of institutional investors.
Rights Issue: Existing shareholders are offered new shares proportionate to their holdings.
Significance: The primary market provides the initial funding for companies, helping them expand operations and invest in growth.
3.2.2 Secondary Market
The secondary market is where previously issued securities are traded between investors.
Stock Exchanges: Organized platforms like NYSE, NASDAQ, and NSE facilitate trading of equities.
Over-the-Counter (OTC) Market: Securities are traded directly between parties without a centralized exchange.
Significance: Secondary markets provide liquidity, enabling investors to buy or sell securities easily, while also helping in price discovery.
4. Types of Financial Markets Based on Instruments
Apart from the money and capital market distinction, financial markets can also be classified based on instruments:
4.1 Stock Market (Equity Market)
Deals in company shares.
Provides investors ownership in corporations.
Helps companies raise equity capital for growth.
Examples: NYSE, NASDAQ, BSE, NSE.
4.2 Bond Market (Debt Market)
Deals in bonds and debentures issued by governments and corporations.
Investors lend money and receive periodic interest.
Less risky than equities but offer fixed returns.
Examples: Government bond markets, corporate bond markets.
4.3 Foreign Exchange Market (Forex)
Involves the trading of currencies.
Ensures liquidity for international trade and investment.
Influenced by macroeconomic factors like inflation, interest rates, and geopolitical events.
Participants: Central banks, commercial banks, multinational corporations, and retail traders.
4.4 Derivatives Market
Deals in contracts whose value is derived from underlying assets like stocks, bonds, currencies, or commodities.
Includes futures, options, swaps, and forwards.
Used for hedging risk and speculation.
Significance: Derivatives help investors manage financial risk efficiently.
4.5 Commodity Market
Trades raw materials like gold, silver, oil, and agricultural products.
Includes spot markets (immediate delivery) and futures markets (delivery at a future date).
Provides a platform for price discovery and risk management.
4.6 Cryptocurrency Market
Emerging digital asset market trading cryptocurrencies like Bitcoin, Ethereum, and stablecoins.
Operates 24/7 globally, often outside traditional financial systems.
High risk but offers significant opportunities for diversification and speculative trading.
5. Classification Based on Trading Mechanism
Financial markets can also be divided based on how trading occurs:
Organized/Exchange-Traded Markets: Regulated platforms with standardized contracts, like stock exchanges.
Over-the-Counter (OTC) Markets: Decentralized trading between two parties, e.g., Forex OTC markets.
Electronic/Online Markets: Internet-based platforms facilitating global trading with high efficiency and low costs.
6. Participants in Financial Markets
Financial markets include a wide range of participants who perform specific functions:
Investors: Individuals and institutions seeking returns.
Issuers: Companies and governments raising funds.
Intermediaries: Banks, brokers, and investment firms facilitating transactions.
Regulators: Authorities like SEBI, SEC, and RBI ensuring transparency and protecting investors.
Speculators: Traders aiming to profit from price fluctuations.
Hedgers: Participants managing risk using derivatives or other financial instruments.
7. Modern Trends in Financial Markets
Globalization: Markets are increasingly interconnected, enabling cross-border capital flows.
Technological Advancements: High-frequency trading, blockchain, and AI-driven analytics are transforming trading.
Sustainable Finance: ESG and green bonds are gaining importance.
Cryptocurrencies & Digital Assets: Digital currencies are expanding market opportunities.
Fintech Innovations: Mobile trading platforms and robo-advisors are democratizing access to markets.
8. Conclusion
Financial markets are the lifeblood of modern economies, facilitating the flow of capital, promoting investment, and enabling risk management. From money markets dealing with short-term debt instruments to capital markets providing long-term funding, each segment has a distinct role in economic development.
The evolution of financial markets—from traditional equity and debt instruments to sophisticated derivatives and digital assets—highlights their adaptability and centrality to global financial stability. Understanding these markets is essential for investors, policymakers, and businesses seeking to navigate the complex financial landscape efficiently.
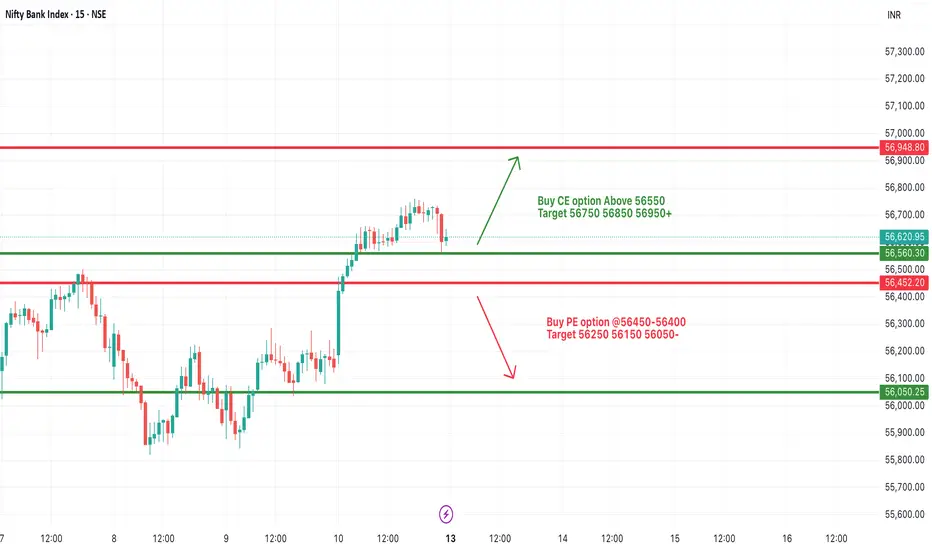
[INTRADAY] #BANKNIFTY PE & CE Levels(13/10/2025)Bank Nifty is expected to open flat to slightly positive near the 56,600 level, indicating a balanced start after a strong upward movement in the previous session. The index has shown resilience by maintaining higher lows on the chart, suggesting underlying bullish sentiment, but it now faces a key resistance zone ahead.
If Bank Nifty sustains above 56,550, a fresh upside move may unfold toward 56,750, 56,850, and 56,950+. A breakout beyond 56,950 could further strengthen the bullish structure, opening the path toward 57,200+.
On the downside, immediate support lies around 56,450–56,400. A fall below this zone may trigger mild profit-booking, dragging the index toward 56,250, 56,150, and 56,050-.
Overall, the trend remains positive with a short-term consolidation bias. Traders should focus on trading breakouts beyond 56,550 or breakdowns below 56,400, maintaining strict risk management.
Market Reform Fallout: Opportunities Hidden in UncertaintyIntroduction
In the ever-evolving landscape of global finance, market reforms—whether initiated by governments, central banks, or supranational entities—often usher in periods of heightened uncertainty. While such reforms aim to enhance economic stability, competitiveness, and growth, they can also lead to market volatility and investor apprehension. However, history has shown that amidst this uncertainty lie opportunities for those with the acumen to identify and capitalize on them.
This article delves into the multifaceted impacts of market reforms, exploring both the challenges they present and the avenues they open for astute investors and policymakers.
The Nature of Market Reforms
Market reforms encompass a broad spectrum of policy changes, including:
Deregulation: Reducing government intervention in markets to foster competition.
Privatization: Transferring state-owned enterprises to private ownership.
Trade Liberalization: Lowering tariffs and non-tariff barriers to encourage international trade.
Monetary and Fiscal Adjustments: Altering interest rates, taxation, and government spending to influence economic activity.
While these reforms are designed to stimulate economic growth and efficiency, their implementation can lead to short-term disruptions as markets adjust to new realities.
Fallout from Market Reforms
The immediate aftermath of market reforms often includes:
Market Volatility: Sudden policy shifts can lead to sharp market reactions, affecting asset prices and investor sentiment.
Sectoral Disruptions: Industries that were previously protected may face increased competition, leading to restructuring or closures.
Regulatory Uncertainty: Ambiguities in new policies can create a challenging environment for businesses and investors.
For instance, the European Union's ongoing review of merger policies has created uncertainty in the corporate sector, as companies await clearer guidelines before pursuing consolidation strategies
Identifying Opportunities Amidst Uncertainty
Despite the challenges, periods of uncertainty following market reforms can present unique opportunities:
Emerging Market Investments: Countries undergoing reforms often experience growth in sectors like infrastructure, technology, and consumer goods. For example, South Africa's financial markets have soared despite weak economic data and slow reforms, indicating potential in emerging markets
Strategic Mergers and Acquisitions: Regulatory changes can lead to consolidation in certain industries, presenting opportunities for mergers and acquisitions. BNP Paribas anticipates future opportunities in European investment banking driven by expected restructuring and refinancing
Policy-Driven Sectors: Reforms in areas like renewable energy, healthcare, and education can create investment opportunities in companies aligned with new policy directions.
Diversification Strategies: Investors can mitigate risks by diversifying portfolios across regions and sectors that are less affected by the reforms.
Case Studies of Reform-Induced Opportunities
South Africa: Despite slow economic growth and high unemployment, South Africa's financial markets have performed strongly, with the Johannesburg Stock Exchange reaching record highs. Analysts attribute this optimism to strong commodity prices and perceived political stability
European Union: The EU's review of merger policies has created uncertainty, but also potential for consolidation in industries like technology and manufacturing. Companies that can navigate the regulatory landscape may find opportunities for growth.
United States: The Federal Reserve's balancing act in a politically volatile landscape presents both risks and opportunities. Sectors sensitive to interest rates, such as real estate and high-yield bonds, remain vulnerable, while defensive assets like Treasury securities and gold may gain allure as hedging tools
Strategies for Navigating Reform-Induced Uncertainty
Investors and policymakers can adopt several strategies to navigate the uncertainties arising from market reforms:
Scenario Planning: Developing multiple scenarios to anticipate potential outcomes and prepare accordingly.
Stakeholder Engagement: Engaging with policymakers to influence the design and implementation of reforms.
Risk Management: Employing hedging techniques and diversifying investments to mitigate potential losses.
Monitoring Indicators: Keeping an eye on key economic and political indicators that signal changes in the reform trajectory.
Conclusion
While market reforms can lead to periods of uncertainty, they also create avenues for growth and innovation. By adopting a proactive and informed approach, investors and policymakers can turn potential challenges into opportunities, driving progress and prosperity in the evolving global market landscape.
SENSEX 1D Time frame📊 Current Snapshot
Current Price: ₹81,571
Day’s Range: ₹81,500 – ₹81,600
Previous Close: ₹81,425.15
Opening Price: ₹81,504.36
Volume: Moderate
📈 Trend & Indicators
Trend: Neutral to mildly bullish; trading near short-term resistance.
RSI (14): Neutral zone.
MACD: Positive → indicating mild bullish momentum.
Moving Averages: Short-term averages indicate neutral to slightly bullish outlook.
🔮 Outlook
Bullish Scenario: Break above ₹81,700 with strong volume could target ₹81,900.
Bearish Scenario: Drop below ₹81,400 may lead to further decline toward ₹81,200.
Neutral Scenario: Consolidation between ₹81,400 – ₹81,700; breakout needed for directional move.
📌 Key Factors to Watch
Economic Indicators: Interest rates, inflation, and RBI policy updates.
Sector Performance: Trends in the IT and financial sectors.
Global Cues: Global market trends, US indices, crude oil, and currency movements.

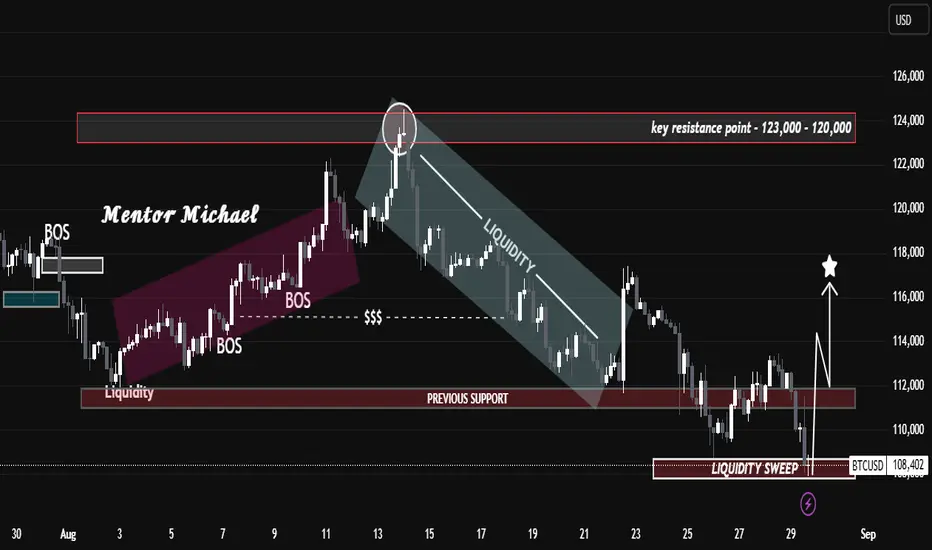
Liquidity Grab Completed – Bulls Back in Control?Liquidity Grab Completed – Bulls Back in Control?
Key Technical Insights:
Resistance Rejection: Price sharply rejected the 120K – 123K resistance zone, confirming this area as a key supply level.
Bearish Liquidity Flow: After rejection, BTC flowed within a descending liquidity channel, continuously taking out internal supports before finding a base.
Previous Support → Liquidity Sweep: Around 108K, price executed a strong liquidity sweep, triggering stop hunts below prior support, then showing a bullish reaction.
Market Structure Shift Incoming: The sweep suggests a potential accumulation phase, where institutions collect orders before pushing price higher.
Upside Targets: If price holds above the reclaimed support at 112K, bullish momentum could aim for 116K – 118K in the near term ⭐.
⚠️ Risk Consideration: A failure to sustain above 108K would invalidate the bullish outlook, opening room for deeper downside.
📌 Summary:
BTCUSD is transitioning from a liquidity-driven decline into a possible reversal phase. The liquidity sweep at 108K could mark the start of a bullish leg if structure confirms with higher highs. Traders should monitor 112K as the short-term pivot point.
“The Art of Traps: Understanding Fake Breakouts in XAUUSD”“The Art of Traps: Understanding Fake Breakouts in XAUUSD”
This chart illustrates how gold (XAUUSD) is currently navigating a critical battle between resistance and support.
At the top, the resistance zone (3440–3460) has already shown signs of rejection, hinting at a possible fake breakout scenario. Such traps are common in financial markets—they draw traders into buying late, only for price to reverse and capture liquidity.
On the downside, the chart highlights two important stages:
The first target lies around 3400, where short-term buyers may start taking profits.
The final target sits at the key support zone (3330–3320), which has acted as a structural backbone in past moves. If this level holds, we can expect another bullish leg; if broken, deeper downside pressure could unfold.
The sequence of higher lows in recent weeks demonstrates strength in the broader trend, but it also warns that markets are building energy before a larger move. Liquidity sweeps (marked in the chart) serve as reminders that price does not move randomly—it often seeks zones where orders are concentrated.
🔑 Educational Takeaway:
Trading is not just about spotting breakouts; it’s about understanding whether those moves are genuine or deceptive. By studying price behavior at resistance and support, traders can avoid falling into liquidity traps and position themselves with the “smart money.”

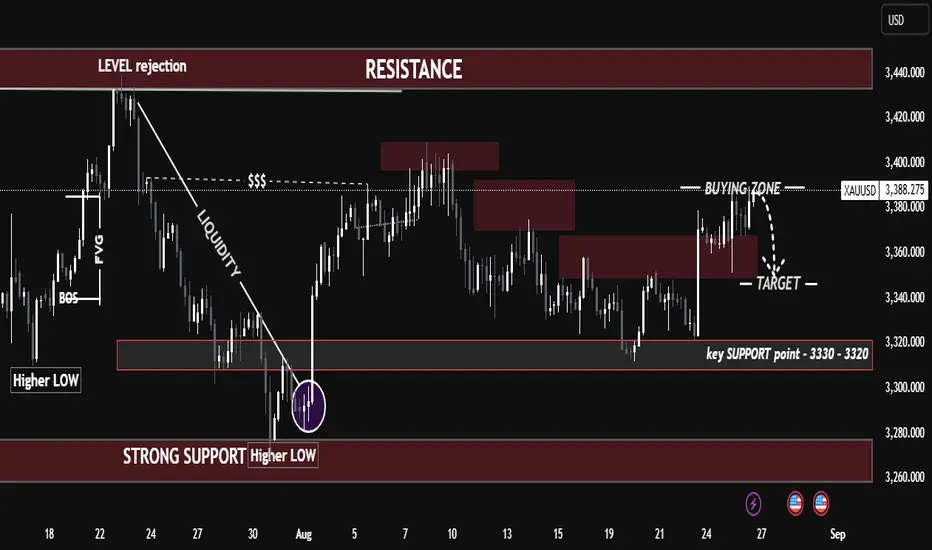
"Gold Setup: Buying Zone Rejection or Breakout Ahead?""Gold Setup: Buying Zone Rejection or Breakout Ahead?"
Gold is currently trading inside a buying zone (3380 – 3400) but facing rejection. Market structure is still holding higher lows, which keeps the bigger trend bullish, but short-term price action suggests a possible retracement move.
Resistance Zone: 3420 – 3440 (strong supply, previous rejection)
Key Support: 3330 – 3320 (major demand, higher low base)
Immediate Target: 3340 – 3360 (if rejection continues)
📉 Short-term bias: bearish correction toward 3340 – 3360
📈 Swing bias: bullish as long as 3330 – 3320 holds
🔑 My View:
I’ll be watching how price reacts around 3330 – 3320. Holding this level could trigger the next bullish leg toward 3420 – 3440. Losing it opens the door for deeper downside into 3280.
"Gold at the Tipping Point: Will $3,350 Spark the Next Rally?""Gold at the Tipping Point: Will $3,350 Spark the Next Rally?"
Gold (XAUUSD) is currently consolidating after a series of higher lows, signaling sustained bullish momentum from the strong support region around $3,280–$3,300. Price has respected key structural points, forming a clean market structure with:
BOS (Break of Structure) confirming bullish intent after reclaiming prior resistance.
Bullish FVG (Fair Value Gap) acting as a liquidity zone for potential re-entries.
Multiple Higher Lows, highlighting strong buyer defense levels.
The chart indicates a possible short-term retracement into the $3,350–$3,357 entry zone, which aligns with demand structure. From this zone, buyers are expected to push toward the $3,400–$3,415 resistance target.
Key technical levels:
Entry Zone: $3,350–$3,357 (demand area)
Stop Loss: Below $3,340 to protect against deeper pullbacks
Take Profit: $3,400 psychological level and $3,414 structural resistance
Market Sentiment:
The combination of a strong support base, sustained higher lows, and bullish imbalance zones suggests a favorable risk–reward setup for long positions. A clean breakout above $3,415 could trigger a larger bullish leg toward the $3,440 resistance zone.
📈 Bias: Bullish above $3,350
💡 Watch for a reaction at the entry zone before committing to positions.

SIEMENS BEARISH TREND ANALYSIS (SHORT)NSE:SIEMENS
SIEMENS BEARISH TREND ANALYSIS
Key Levels:
Entry Point: ₹6,559.45
Stop Loss (SL): ₹6,732.85
Target Points:
TP1: ₹6,339.95
TP2: ₹6,143.60
TP3: ₹5,747.50
Analysis:~
Trend Overview:
Siemens is showing a bearish trend, confirmed by the price breaking an 8-month support level. The chart highlights potential downside targets with a disciplined stop-loss placement.
Support and Resistance:
The price has failed to sustain above the long-term support level, which has now turned into resistance.
The trend suggests potential further decline toward the specified targets.
Risk Management:~
Stop Loss at ₹6,732.85 ensures risk is minimized if the trade goes against the trend.
Target levels are spaced for progressive profit booking.
Chart Insights:~
Bearish Confirmation:
Siemens has turned bearish, breaking below its 8-month support zone, signaling potential further downside movement.
Resistance:~
The previous support level now acts as resistance.
A stop loss is placed slightly above this level to mitigate risk in case of trend reversal.
Profit Targets:~
TP1 and TP2 offer conservative profit levels, while TP3 provides a more aggressive downside target.
Trend Direction:
The 50-day and 200-day moving averages are sloping downwards, indicating sustained bearish momentum.
Disclaimer:
I am not a SEBI-registered advisor. This analysis is for educational purposes only. Trade at your own risk. Please consult a professional financial advisor before making trading or investment decisions. Thank you! Like and share if you found this helpful.
Like,share,subscribe @Alpha_strike_trader

Option trading When options are better. Options can be a better choice when you want to limit risk to a certain amount. Options can allow you to earn a stock-like return while investing less money, so they can be a way to limit your risk within certain bounds. Options can be a useful strategy when you're an advanced investor.
You don't need a considerable sum of money to become an options trader. You can start small with a capital of less than Rs 2 lakhs too. However, as you start small, you need to be a careful trader so that you can cut down on the possibility of losses and enhance the return potential of your trades.

ADX Advance ClassKey takeaways. Average directional index (ADX) is a short-term chart indicator. It can be used to help you evaluate the market or an investment's strength. ADX currently suggests the short-term momentum behind stocks may be strong, with a caveat.
The ADX provides the dominant decision-making criteria—allowing you to see whether there is a trend or not and how strong it may be. The RSI provides the secondary evidence—real-time analysis of whether that investment is in overbought or oversold territory.

Option trading // Options are a type of contract that gives the buyer the right to buy or sell a security at a specified price at some point in the future. An option holder is essentially paying a premium for the right to buy or sell the security within a certain time frame.
When options are better. Options can be a better choice when you want to limit risk to a certain amount. Options can allow you to earn a stock-like return while investing less money, so they can be a way to limit your risk within certain bounds. Options can be a useful strategy when you're an advanced investor.

Rising India VixIndia Vix was in range for a year and running between 12.50 to 13 so that there were stability in the market and market was in single up direction..
But since last few days India Vix Rising and which indicates that instability may rise in the market or market may start falling.... Big institutions and big player has started distributing their holdings....
stay cautious now....

Nifty Sells from right here. Valid for today and tomorrow. NFAI am going for shorts on Nifty today. Targeting last friday's low.

SOLUSDTPER | 1D | Try long entries when we hit the support (green zone) and wait for confirmation before entering. Analyse the chart, Look at the Fibonacci levels price reversed at 61.8% exactly. We can see the next support was also at the same level.

xauusd fall 15 .3.2023 to 24.3.23enjoy your trading ...alredy redy to chart ..u start your conformation...

#USDJPY Analysis #trend ,#Momentum,#volume pricerelation #HFHiii
dear TV
I ovserve a momentum shift in the USDJPY towards for uptrend ,
Tools i used
COCEPTS
☆ FIrst i USED Higher time Frame Analysis beacuse It dominate on lower Timeframes . All MARKER always Follows HTF
☆ I plot curve line as max wick touch with vol relation. for increase accuracy
☆ Monthly trend indicator line rule
.if price crossedup it will go UpTrend
crosseddown go DownTREND
☆ I changed vol color so we see where market maker order placed on chart
as i explain earlier marker maker buy at lower price and sell at higher ,
eg when price going lower they buy with heavy postion slowly which causes spikes in volume and price i maked on the chart .
known as wick or liquidity traped points
☆ momentum line shows shift in the Trend momentum
☆ curve drawing line for capturing exact momentum line
I used HA chart for showing momentum !
Thanks
