Bitcoin Is Quiet Again — That’s Usually When Big Moves BeginBitcoin spent multiple sessions moving sideways inside a clearly defined accumulation range.
This kind of price behavior usually signals one thing, strong hands are building positions while weak hands get shaken out.
Sideways markets are not random. They are preparation phases.
Price remained compressed inside the accumulation zone, showing balance between buyers and sellers with declining volatility.
The breakout candle was decisive and impulsive, indicating acceptance above the range rather than a fake move.
After breakout, price pulled back into the prior range high, which is a classic bullish retest behavior.
As long as price holds above the breakout base, the structure favors continuation toward the expansion zone marked on the chart.
A failure back inside the range, would invalidate the breakout and shift momentum back to neutral.
If this helped you read price better, like, follow, or comment, more clean structure studies coming.
⚠️ DISCLAIMER: This analysis is for educational purposes only and is not financial advice. Markets involve risk. Always manage your position size and do your own analysis.
Marketstructure

EUR/USD – Accumulation After Sell-Off, Structure-Based Long IdeaEUR/USD has seen a strong sell-off, followed by a sharp reaction from a well-defined support zone. This area has already proven its strength by absorbing selling pressure and pushing price higher.
After the bounce, price is now consolidating near support instead of breaking down further, indicating potential accumulation at these levels.
What Price Is Telling Us: Price is holding above the support zone with multiple rejections and overlapping candles, showing a clear loss of bearish momentum. Sellers are failing to push price lower despite earlier strength.
This type of behavior often appears before a corrective move or continuation higher, especially after an impulsive decline.
If this analysis helped you, like, follow, and comment for more clean Forex breakdowns.
Disclaimer: This analysis is for educational purposes only and does not constitute financial advice. Trading involves risk, and past performance does not guarantee future results. Please manage risk responsibly.

Why Gold Behaves Differently During Christmas Week – A Lesson!Hello Traders!
If you have traded gold for a few years, you might have noticed something strange around Christmas week.
Your usual setups feel different. Levels don’t react the same way. Moves look random, slow, or suddenly sharp without logic. This is not because your analysis stopped working.
Gold behaves differently during Christmas week because liquidity behaves differently.
Understanding this one concept can save you from unnecessary losses.
What Changes in the Market During Christmas Week
During Christmas week, a large part of institutional traders, banks, and big market participants are either inactive or trading with very light exposure. Volumes drop significantly, and participation becomes uneven.
When fewer large players are active, the market structure changes. Gold still moves, but the quality of moves changes.
I’ve learned to treat this week very differently from normal trading weeks.
Why Low Liquidity Changes Gold’s Behavior
Gold is a highly liquid instrument most of the year, but during holiday weeks, especially Christmas, liquidity becomes thin.
With thin liquidity:
Small orders can move price more than usual
False breakouts become more frequent
Clean follow-through after breakouts reduces
Price starts reacting more to random flows than to strong conviction.
The Common Trap Retail Traders Fall Into
Most retail traders trade Christmas week exactly like any other week. They expect normal volatility, normal reactions, and normal continuation.
What actually happens is different.
Price spikes suddenly, hits stops easily, and then goes quiet again. This creates frustration and confusion, especially for intraday and scalping traders.
I’ve personally learned this the hard way earlier in my trading journey.
Why Gold Can Look “Manipulated” During Holidays
When liquidity is low, price movements feel exaggerated. Stops get hit easily, wicks become longer, and reversals appear sudden.
This makes traders feel like gold is being manipulated.
In reality, it is not manipulation, it is absence of depth. When the market lacks depth, price becomes sensitive.
How I Personally Trade Gold During Christmas Week
Over time, I changed my approach completely for holiday periods.
I reduce position size significantly, even if my analysis is strong.
I avoid aggressive intraday trades and prefer higher timeframe context.
I accept that missing trades is better than forcing trades during low liquidity.
Sometimes, the best trade during Christmas week is no trade.
Why Patience Matters More Than Prediction Here
During Christmas week, prediction matters less than protection. Even correct analysis can fail due to lack of participation.
Gold may move, but moves are often unreliable and short lived. This is where discipline protects capital.
I remind myself every year, markets will still be there next week.
Rahul’s Tip
If gold starts behaving strangely during Christmas week, don’t doubt yourself immediately.
Check liquidity first. Reduce size, reduce expectations, or step aside completely.
Preserving capital during low-quality conditions is also a skill.
Conclusion
Gold does not change its nature during Christmas week. Liquidity changes, and gold simply reacts to that.
When you understand how liquidity affects behavior, you stop forcing trades and start respecting the environment.
If this post helped you understand holiday trading better, like it, share your experience in the comments, and follow for more practical gold trading insights. Happy Merry Christmas to all from @TraderRahulPal :))

Gold 15-Min Chart: Previous Support should act as Resistance nowHello everyone, Guy's Gold has made a sharp recovery after the recent drop, but i am expecting gold should take resistance in this area. This level has already shown rejection in the past, making it a critical decision area for the market.
The rejection near this zone suggests that sellers are still active. If Gold fails to sustain above this resistance, a pullback toward the lower support areas is likely. Such pullbacks are normal after strong impulsive moves and often provide better clarity for the next direction.
As long as price stays below this resistance, upside looks limited in the short term. A clean breakout and hold above this level is required to shift the bias back to bullish.
Disclaimer: This analysis is for educational purposes only and should not be taken as financial advice. Please do your own research or consult your financial advisor before investing.

USD/CAD – Liquidity & Structure Based Short IdeaUSD/CAD has been trading inside a well-defined rising channel for a while. Price is now approaching the upper boundary of this channel, a zone where sellers have previously stepped in with strength.
This area is not just resistance, it’s also a liquidity zone, where stop-losses of late buyers are resting above recent highs. Such zones often attract smart money activity before a directional move.
What Price Is Telling Us: Price is currently stalling near resistance instead of expanding higher. We can observe Multiple rejections near the channel top, Overlapping candles showing loss of bullish momentum and Lack of strong follow-through despite previous volume spike.
This behavior often appears before distribution or a corrective move, especially when price is trading at premium levels.
If this analysis helped you, like, follow, and comment for more clean Forex breakdowns.
Disclaimer: This analysis is for educational purposes only and does not constitute financial advice. Trading involves risk, and past performance does not guarantee future results. Please manage risk responsibly.

Zoom Out: Bitcoin’s 14-Year Structural Expansion Explained!Hey Everyone, let's analyse long term structural view on Bitcoin as it is once again sitting inside the same structural expansion channel it has respected for more than 14 years.
Zooming out removes the noise, what looks random on lower timeframes reveals a very consistent long-term pattern.
Most traders focus on headlines. Long-term moves are built on structure.
Bitcoin has never moved randomly on higher timeframes. Every major cycle since 2011 has expanded inside a rising macro channel driven by demand, time, and liquidity.
Each cycle looks different on the surface, but the internal structure remains the same, higher lows forming on macro support, followed by exponential expansion phases.
Current price is still respecting the long-term rising structure, with buyers consistently stepping in near the lower boundary of the channel.
The upper zone shown is not a prediction. It represents the historical expansion boundary where previous cycles matured and volatility peaked.
As long as the macro structure remains intact, the probability continues to favor structural continuation rather than random collapse.
Key takeaway:
Markets don’t repeat perfectly, but they rhyme .
And Bitcoin has been speaking the same structural language for over a decade.
Conclusion:
This is not about catching tops or bottoms.
It’s about understanding where you are in the cycle , and acting accordingly.
If this structural perspective helped you, like, comment, and follow for more long term market studies.
Analysis By @TraderRahulPal | More analysis & educational content on my profile.
⚠️ DISCLAIMER: This analysis is for educational purposes only and reflects a long term structural view. It is not financial advice. Always manage risk and do your own research before making trading or investment decisions.

Gold After Liquidity Grab: Short side intraday move, R you readyHello Everyone, let's analyse Gold as this once again tested a major resistance zone, but instead of giving a clean breakout, price briefly moved above the level and then quickly reversed. This move was not strength, it was a liquidity grab.
In simple words, smart money pushed price above resistance to trap breakout buyers, collect their stop-loss liquidity, and then bring price back into the range. This is why price failed to hold above the highs and started showing weakness soon after.
Right now, Gold is trading back below resistance, which keeps the short term bias cautious to bearish. If selling pressure continues, price may slowly rotate toward the lower support / demand zone, where buyers could appear again.
This chart is a good reminder that not every breakout is real. Waiting for confirmation always matters more than speed.
Disclaimer: This analysis is for educational purposes only and should not be taken as financial advice. Please do your own research or consult your financial advisor before investing.
Analysis By @TraderRahulPal | More analysis & educational content on my profile.
If this helped you understand price behavior better, like, follow, and share your view in comments.

BTC Market Update - Market in Compression PhaseBitcoin is currently in a corrective and consolidation phase after a strong higher-timeframe advance.
The broader structure remains intact, but momentum has slowed as price trades in a key decision zone.
🔍 Multi-Timeframe View:
Weekly: Uptrend intact, correction in progress
Daily: Balance state with overlapping candles
4H: Higher lows forming, resistance capping price → compression
📌 Key Levels:
Major Support: 85.5k – 86k
Mid Zone: 88.5k – 89k
Resistance: 91k – 92k
Major Ceiling: ~94.5k
Price holding above support keeps the broader structure constructive.
Acceptance above resistance would signal momentum returning, while rejection keeps the market range-bound.
📎 This is a waiting phase — clarity comes with expansion.
⚠️ Educational analysis only.
#BTC #Bitcoin #CryptoAnalysis #MarketStructure #PriceAction

ETH/USDT Bullish Reversal SetupETH/USDT Bullish Reversal Setup
The chart shows a clear transition in ETH as price moves from a prolonged distribution-driven decline into a developing accumulation range. After weeks of consistent bearish structure, the market finally printed multiple upside shifts, signaling that sell-side pressure is weakening and liquidity behavior is changing.
The recent impulsive rally out of the discounted range confirms that buyers are actively defending lower levels. Price is now pulling back toward a short-term demand pocket formed during the breakout. This area represents the first meaningful accumulation zone after the market broke a series of internal swing points.
As long as price maintains stability within this demand block, the structure favors continuation toward the next major liquidity cluster above. The next upside draw is positioned around the 3,440–3,500 region, where previous inefficiencies and unmitigated zones converge. That region also holds resting buy-side liquidity, making it the logical target for a future expansion move.
The current market behavior suggests that ETH is in the early phase of a bullish repricing cycle. A controlled pullback into the highlighted zone—followed by a reaction—would confirm continuation and attract momentum buyers aiming for the higher liquidity magnet.
Overall, this chart reflects a shift in narrative: sellers are losing dominance, the market is building a fresh bullish structure, and the path of least resistance is gradually tilting upward as long as the demand zone remains protected.

Smart Money Liquidity Trap Explained⭐ Smart Money Liquidity Trap Explained
✨ A deep dive into how institutions manipulate price before major moves ✨
In every financial market — Forex, Crypto, Stocks, Indices — price doesn’t simply move at random. Behind the scenes, Smart Money (institutions, banks, hedge funds) engineer setups that allow them to enter positions at the best possible price. One of their most effective tools is the Liquidity Trap.
Let’s break it down beautifully and clearly. 👇
🔥 What Is a Liquidity Trap?
A Liquidity Trap occurs when Smart Money deliberately pushes price into areas loaded with:
❌ Stop-loss orders
📉 Sell-side liquidity
📈 Buy-side liquidity
😰 Emotional retail entries
🔥 Breakout traders placing pending orders
These areas become liquidity pools — perfect fuel for institutions to fill their massive positions.
Retail traders think it’s a breakout…
But Smart Money thinks:
➡️ "Thank you for the liquidity."
🧩 How Smart Money Creates the Trap
1️⃣ Phase 1: Build the Setup
Smart Money guides price slowly toward an obvious level:
A clean high
A clean low
A trendline
A double top/bottom
Retail traders get excited:
📢 “Breakout coming!”
But institutions are simply gathering attention.
2️⃣ Phase 2: The Liquidity Grab ⚡
Price spikes violently above/below the obvious level.
This move triggers:
🟥 Stop-loss hunts
📉 Forced liquidations
💥 Breakouts that fail instantly
This sudden spike gives institutions the liquidity needed to place large buy or sell orders without causing massive slippage.
This is why the spike is often fast and dramatic.
3️⃣ Phase 3: The Real Move Begins 🚀
After the liquidity is collected, price reverses sharply.
This is the moment Smart Money actually commits to the real direction.
Retail traders feel:
🤯 “Why did it reverse?!”
😭 “I got stopped out for nothing!”
😵 “The breakout was fake!”
But Smart Money simply executed their strategy perfectly.
🎯 How to Use Liquidity Traps in Your Trading
Study where retail traders commonly place:
⛔ Stops
📌 Breakout orders
❗ Predictable entries
Then wait for the fast liquidity grab followed by:
A displacement 🎇
A sharp wick rejection
A structure shift (CHoCH / BOS)
These signals often reveal the true direction of the upcoming move.
💡 Key Features of a Smart Money Liquidity Trap
✨ Sudden spike into obvious areas
✨ Fast liquidation and stop-hunting behavior
✨ Sharp wick rejections
✨ Structure shift after the spike
✨ Smooth continuation in the real direction
🚀 Why This Concept Is So Powerful
Recognizing liquidity traps allows you to:
❌ Avoid fake breakouts
🛡️ Protect yourself from stop-hunts
🎯 Enter the market at premium/discount levels
🤝 Align with Smart Money
💼 Improve long-term consistency
This is how professional traders stay on the right side of volatility — by understanding why the market moves, not just where it moves.

BNB/USDT – Bullish Reversal Idea | Demand Zone Reaction📌 Overview
BNB is currently trading at a major higher-timeframe demand zone, showing early signs of accumulation after a sharp sell-off. Price has tapped the demand area multiple times and is holding without breaking structure to the downside.
This setup is based on a potential short-term reversal or a relief bounce.
📍 Analysis
🔹 Demand Zone
Price is reacting from a clean demand zone created by previous strong bullish displacement.
Multiple wicks show buyers defending this level.
🔹 Market Structure
Prior strong downtrend
Price now consolidating at support
Lower timeframe shows slowing bearish momentum
🔹 Entry Logic
A long entry is placed at the reaction zone, anticipating a bounce toward the nearest inefficiency / supply zone above.
🎯 Trade Setup
🟩 Long Position Idea
Entry: At demand zone
Stop-Loss: Below the liquidity wick / zone low
Take-Profit: Previous structure high or the first major supply zone above
This gives a clean R:R setup (as shown in chart).
⚠️ Risk Management
Only risk what you can afford to lose
If the zone breaks cleanly, setup is invalid
Wait for candle confirmation if you want safer entry
📌 Final Thoughts
BNB is at a critical make-or-break level. If buyers hold this zone, a strong bounce is likely. If not, expect continuation lower.
Publishing this to track market reaction and trade execution.

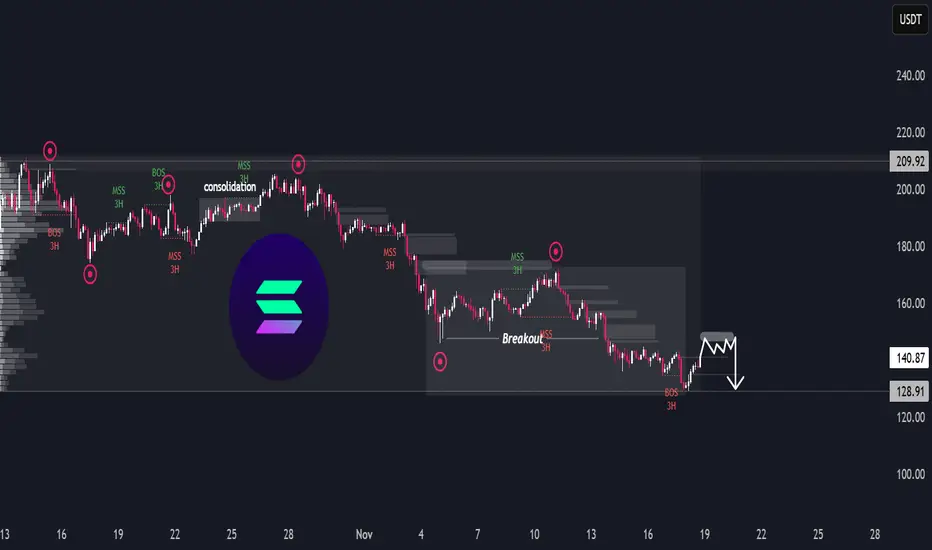
SOL/USDT – Downside LoadingSOL/USDT – Downside Loading
The chart shows a prolonged distribution phase followed by a steady macro decline, with multiple structure breaks confirming a persistent bearish flow. After the earlier consolidation in the upper range, each attempt to reclaim previous highs has been met with a shift in momentum, leading to progressive downside sequences.
The recent breakout from the lower range transitioned into continued weakness, indicating sellers remain in firm control. Despite short-term rebounds, the overall behaviour reflects a market that is unwinding previous demand zones rather than building new ones.
At the current level, SOL is forming a tight corrective pattern, suggesting price is building liquidity before the next directional move. Given the broader trend context, this type of compression typically precedes continuation rather than full reversal. The chart’s projection implies a potential liquidity sweep on the minor rally, followed by renewed downside pressure once short-term buyers are exhausted.
Overall, the environment still favours the bearish continuation scenario unless the market shows a decisive shift in character backed by sustained strength — something not yet present.
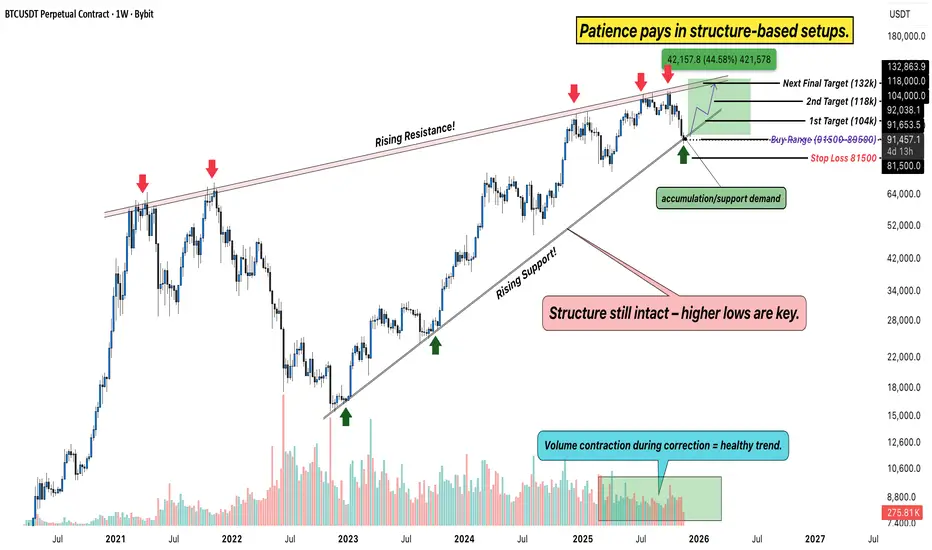
Bitcoin Weekly Chart – Structure Still Intact, Patience is PowerHello Everyone, i hope you all doing good, Lets discuss about bitcoin. After weeks of consolidation and volatility, Bitcoin is back at its rising support zone, where strong hands usually step in. The structure on the weekly chart continues to hold higher lows, a clear sign that the broader trend remains bullish despite short-term pullbacks.
Technical View
Rising Channel: BTC continues to move within a rising channel, with clear reactions from both support and resistance levels. The current price is testing the buy range between 81,600–89,500, an area that has historically acted as a high-probability reversal zone.
Resistance Levels: Key upside levels to watch are 104K, 118K, and the final target zone near 132K, the same rising resistance that rejected price multiple times in past cycles.
Support: As long as BTC stays above 81,500, the structure remains valid. A weekly close below this zone would invalidate the bullish bias.
Volume Behavior: Notice how each correction comes with lower volume, a healthy sign of accumulation, not distribution.
Big Picture
This phase often shakes out emotional traders while rewarding the ones who trust structure and time. If Bitcoin holds this zone and begins to bounce, it could mark the start of the next major wave, potentially aiming for a new cycle high in the coming months.
Rahul’s Insight: Big moves don’t start with hype, they start with quiet structure and strong conviction. The crowd reacts; the disciplined trader prepares.
Analysis By @TraderRahulPal | More analysis & educational content on my profile.
Order Blocks Simplified — How Institutions Control Price🔥 Order Blocks Simplified — How Institutions Control Price
Order Blocks are one of the most important concepts in modern trading — because they show where institutions place REAL positions, not where retail traders guess. 🏦📊
When you understand Order Blocks, you stop chasing random candles and start reading the footprints of smart money. Let’s simplify it. 👇✨
📌 What Is an Order Block? 🧱💰
An Order Block (OB) is a price zone where big institutions (banks, hedge funds, market makers) place massive orders.
These zones often appear before strong market moves — because that’s where smart money builds positions.
Think of an Order Block as:
🔹 The origin of a powerful move
🔹 A zone where price reacts repeatedly
🔹 A region that creates imbalance and momentum
🔹 A point where institutional orders remain unfilled
Once price returns to that zone, institutions fill the rest of their orders, causing another strong reaction. ⚡📈📉
📌 Why Do Order Blocks Matter? 🧠🔥
Because institutions control 80%+ of market volume — not retail.
So when they accumulate or distribute positions:
📈 Trends are born
📉 Reversals appear
🌊 Momentum shifts
💥 Big candles print
Order Blocks give you insight into:
✔️ Where big players enter
✔️ Where real support/resistance exists
✔️ Why price reverses at specific zones
✔️ Where high-probability trades form
It’s the closest thing to tracking the “big money blueprint.”
📌 How Order Blocks Form 🛠️📊
Order Blocks are created during periods of:
🔸 Accumulation (smart money buys quietly)
🔸 Distribution (smart money sells quietly)
Then price explodes away from that zone, showing that a major order cluster was executed.
This explosive move creates:
🔥 Imbalance (FVG)
🔥 Break of structure (BOS)
🔥 A directional trend
These are all signs of institutional activity.
📌 Types of Order Blocks 🟥🟩
🟥 Bearish Order Block (B-OB)
The last bullish candle before a strong bearish move.
It marks institutional selling.
🟩 Bullish Order Block (B-OB)
The last bearish candle before a strong bullish move.
It marks institutional buying.
Both act as high-probability reaction zones.
📌 How Institutions Use Order Blocks 🎯🏦
Institutions don’t enter all at once — their orders are too large.
So they:
1️⃣ Place part of their order
2️⃣ Push price away
3️⃣ Wait for retracement
4️⃣ Fill the rest at the same zone
That zone = the Order Block.
Price returning to an OB is not random — it’s smart money completing their business. 💼✨
📌 How You Trade Order Blocks 🧘♂️📈
✔️ Identify the strong move
Big displacement = institutional interest. 🚀
✔️ Mark the Order Block candle
The last opposite candle before the move. 🔍
✔️ Wait for price to return
Smart money loves to rebalance orders. 🔁
✔️ Enter with confirmation
Candles + structure + reaction = high probability. 🎯
Order Blocks are not predictions — they are reaction zones with a smart-money edge.
📌 Why Order Blocks Work So Well 🌟
Because they are built on:
💧 Liquidity
🧠 Smart Money Behavior
📊 Market Structure
⚡ Supply & Demand
🔥 Institutional Order Flow
This is why OBs outperform classic support/resistance.
They show institutional reality, not retail imagination.
✨ Final Thoughts: The Power of Order Blocks 🚀
Once you learn Order Blocks, everything becomes clearer:
✔️ You know where big money enters
✔️ You know where to wait for price
✔️ You stop chasing bad trades
✔️ You trade WITH smart money
✔️ You catch cleaner, stronger moves
Order Blocks are the foundation of modern price action — simple, powerful, and deeply effective. 🔥📈
XAU Empire | Bullish FlowXAU Empire | Bullish Flow
The market maintains a bullish structure after confirming a break of structure (BOS). Price is currently retracing into a short-term demand zone near 4,100, showing healthy correction within trend. This zone is acting as accumulation before potential continuation.
Momentum supports a move toward 4,316 – 4,386, aligning with unfilled imbalance and previous supply area. Institutional flow remains on the buy side as long as price holds above 4,080.
---
Market Bias: Bullish
Short-Term Range: 4,100 – 4,386
Key Focus: Retracement for continuation

GOLD SHOWS WEAKNESS – SELL THE RALLY TOWARD DEMAND!📅 WEEKLY PLAN – November 8, 2025
🚀 HOOK TITLE:
🔥 GOLD SHOWS WEAKNESS – SELL THE RALLY TOWARD DEMAND! 🔥
📊 Market Analysis:
Gold continues to respect a bearish market structure, showing clear Break of Structure (BOS) and Change of Character (CHoCH) patterns on the 2H chart.
After multiple rejections from the upper zones, price is likely forming a lower high before heading to retest the demand below.
The market is currently consolidating between 4020–3980, suggesting a potential liquidity grab before the next impulsive drop.
🎯 Trade Plan:
🔹 Setup 1 – Sell Zone (4037–4039)
Entry: 4037–4039
SL: 4043
TP1: 4018
TP2: 3976
TP3: 3931
🔹 Setup 2 – Sell Zone (4018–4020)
Entry: 4018–4020
SL: 4024
TP1: 3976
TP2: 3931
TP3: 3929
🔹 Setup 3 – Buy Reaction Zone (optional scalp)
Entry: 3931–3929
SL: 3923
TP1: 3974
TP2: 4018
(Only consider if strong bullish rejection or FVG fill appears)
📈 Outlook:
Bias remains bearish unless price breaks and closes above 4043 (invalidating lower-high structure).
Smart traders should sell into strength, waiting for confirmation wicks or bearish engulfing on lower timeframes (M15–M30) inside the marked zones.
📌 Weekly Bias: 🟥 SHORT / SELL MODE
Targeting the imbalance fill toward 3930 area.

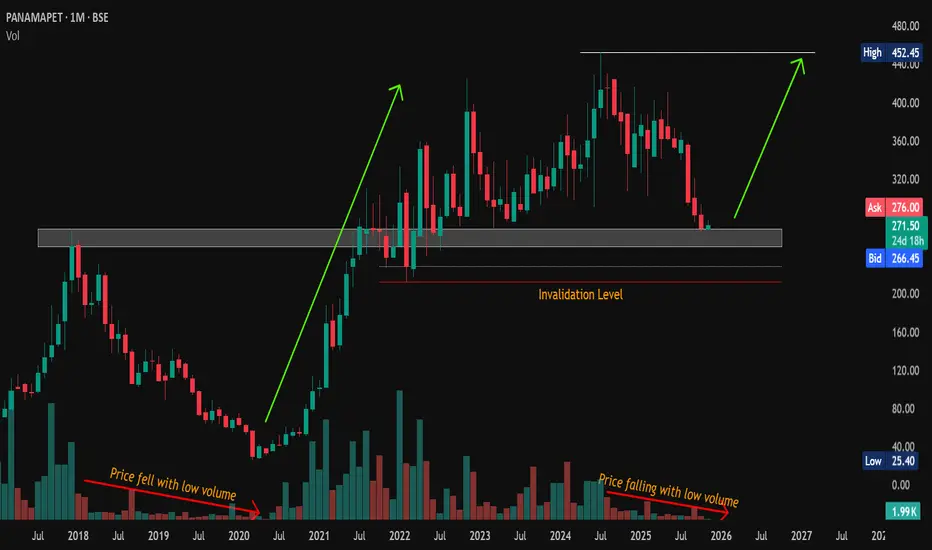
#PANAMAPET | Low-Volume Pullback at Key SupportCMP: 271.50
Price has returned to a major demand zone , and the decline came on low volume , hinting at weak selling pressure.
Could this be the calm before another rally toward 450+? 🚀
📊 Breakout–Retest–Continuation setup forming!
🛡 Supports: 268-249 / 229
🚧 Resistances: 279 / 347
❌ Invalidation: Below 212.50 (WCB)
🎯 Targets: 380 / 415 / 452+ (ATH)
📊 Volume Trend: Price falling on declining volume → typical sign of healthy corrections within an uptrend .
This setup resembles the early accumulation phase of 2020 , where the trend began to reverse from the base zone.
If buyers defend this area, we could see a continuation of the larger bullish trend that started in 2020. 📈
Watch for strength & volume pickup near the support zones for confirmation. 👀
#PANAMAPET #PriceAction #VolumeAnalysis #MarketStructure #LongTerm
📌 Disclaimer: This analysis is shared for educational purposes only. It is not a buy/sell recommendation. Please do your own research before making any trading decisions.
GOLD READY FOR A BULLISH REBIRTH | Pullback Buy Setup Inside🧭 DAILY TRADING PLAN — GOLD (XAU/USD)
Date: Oct 30, 2025
Main timeframe: H1 – M30
Strategy: SMC + EMA Confluence + Trendline Reversal
🧩 MARKET CONTEXT
Gold has just completed a liquidity sweep below 3920 and is forming a bullish corrective structure along the rising trendline.
The short-term structure shows CHoCH → BOS confirmation around 3950–3970, signaling a potential reversal phase.
Price is currently testing the EMA zone (H1) and approaching the key supply at 4026–4028, where short-term profit-taking might appear.
Overall, market sentiment remains bullish toward 4020–4030, but a short retracement could occur before the next leg up.
🎯 TRADE PLAN
BUY SETUP #1
Entry: 3950 – 3948
SL: 3943
TP: 4018 → 4026
(R:R ≈ 1:3)
If price fails to hold above 3948, wait for a deeper liquidity grab:
BUY SETUP #2
Entry: 3921 – 3919
SL: 3913
TP: 3980 → 4020
(Liquidity sweep + trendline confluence)
SELL SETUP (Counter-trade)
Entry: 4026 – 4028 (rejection zone)
SL: 4033
TP: 3970 – 3950
(Only valid if bearish BOS appears on M15)
🔍 TECHNICAL INSIGHT
Structure flipped bullish after CHoCH & BOS on M30
Trendline support remains intact
EMA 34 crossing upward on H1 – confirming short-term momentum
Main liquidity pools sit around 3919 (below) and 4028 (above)
Expect pullback → bullish continuation as long as price stays above 3948

Nifty 50 – Key Levels & Trade Setups | 27 Oct 2025Overview
The NIFTY 50 index concluded the previous week with an indecisive candle, reflecting ongoing market uncertainty. Notably, the price action has successfully filled the gap that was left open on October 20, 2025. As we approach the market open on October 27, 2025, I will be closely monitoring the initial price behavior to gauge directional bias.
Current Technical Scenario
The market is currently positioned within the 25,830–25,800 range coinciding with a 3-minute FVG, which could serve as a pivotal zone for short-term movements. From current levels, there is potential for a downside extension toward the 25,670.
Key Levels to Watch
Resistance : Monitor for breakout above the 25,875 level.
Support : 25,700, followed by 25,670 (major).
I will closely monitor market reactions at these levels during the trading session on October 27, 2025, and, if possible, provide real-time updates post-market open at 9:15 AM IST based on live price developments. This analysis is for educational purposes only and not financial advice—always conduct your own due diligence and manage risk appropriately.

How Smart Money Moves Gold (XAUUSD)Every spike, every fake breakout, every sharp reversal… it’s all part of a bigger plan by smart money (institutions) to trap emotional traders and collect liquidity.
Let’s break it down 👇
⚡ 1️⃣ Liquidity Grab (The Trap Phase)
Before any real move, gold sweeps stop-losses above highs or below lows.
Retail traders think it’s a breakout — but it’s actually a liquidity hunt.
Smart money fills large positions here while emotions run high.
⚡ 2️⃣ Market Structure Shift (The Clue)
After collecting liquidity, watch for a BOS (Break of Structure) or CHoCH (Change of Character) — these reveal when the real move is starting.
⚡ 3️⃣ Smart Money Entry (The Real Move)
Once the trap is set, gold often makes a strong impulsive push.
This is where institutions enter — and where smart traders follow with confirmation, not emotion.
⚡ 4️⃣ Emotional Traders Lose, Logical Traders Win
The market doesn’t hate you — it simply feeds on emotional reactions.
Be patient, wait for liquidity sweep ➜ structure shift ➜ confirmation entry.
🧭 Pro Tip:
👉 Stop chasing candles.
👉 Study liquidity and market structure.
👉 Let the chart show who’s trapped — and then trade against them.
💬 Remember:
“The market rewards patience, not panic.”
💎 Gold (XAUUSD) moves on liquidity — not luck.
#TradeSmart #ThinkLikeInstitutions #XAUUSD

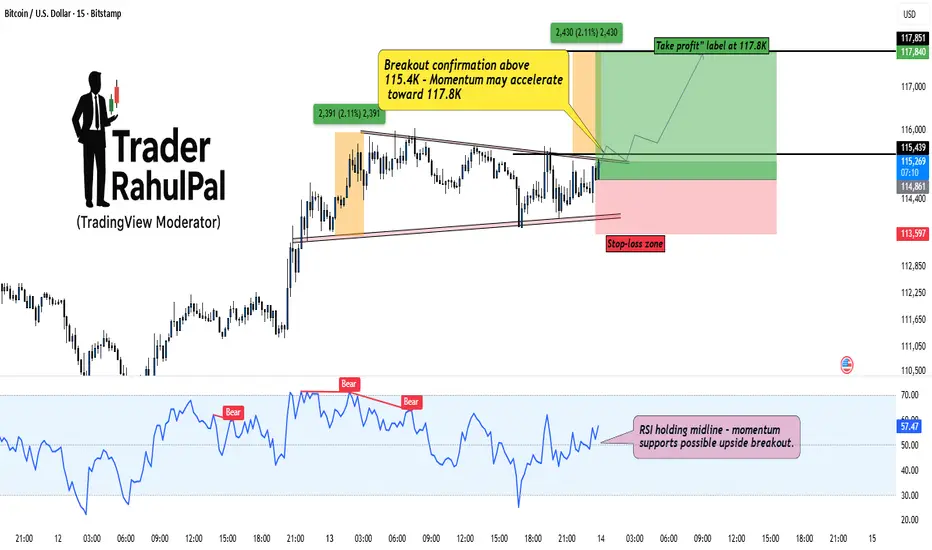
BTC – Building Discounted Longs Before the Breakout?Bitcoin (BTCUSD) is currently consolidating within a tight compression zone, showing signs of accumulation near 114.8K–115.4K . The market is coiling up right under resistance, hinting that a potential breakout could be around the corner.
As seen on the chart, structure remains bullish with a well-defined base and higher low formation. The key breakout confirmation lies above 115.4K , which could trigger a momentum push toward 117.8K , aligning with previous swing projections.
However, I’m personally building a small discounted entry position even before the confirmed breakout. The reason? When momentum starts expanding, it rarely gives clean entries, so catching early positioning near support provides better R:R potential.
RSI is holding above the midline, reflecting sustained buyer strength, while volume compression suggests a volatility expansion phase ahead. If price manages to sustain above the upper trendline, expect quick upside continuation.
Stop-loss remains below 113.6K to stay protected against fakeouts.
Rahul’s Tip:
Smart money often positions early when the crowd hesitates — timing matters, but conviction matters more.
Analysis By @TraderRahulPal (TradingView Moderator)
If this helped you spot the setup early, like and follow for more real-market insights.
Disclaimer: This analysis is for educational purposes only and should not be taken as financial advice. Please do your own research or consult your financial advisor before investing.
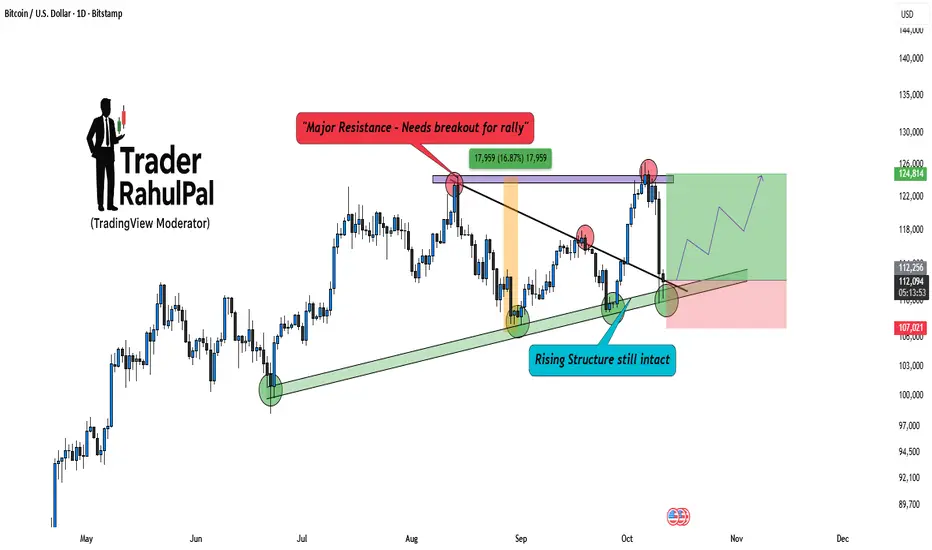
Bitcoin – Rising Structure Still Intact, Bulls Aren’t Done YetBitcoin (BTCUSD) continues to respect its rising structure , even after a sharp pullback from the resistance zone near 125K. While short-term traders might see this as weakness, price action tells a different story, the overall structure is still intact and favors the bulls.
Notice how BTC once again bounced from the ascending trendline support, confirming that institutional buyers are still active around these zones. The recent rejection was from a well-defined major resistance area , but as long as Bitcoin holds above the rising support band, the bias remains positive.
A breakout above 125K will open the doors for another impulsive leg toward 130K+ levels . On the downside, any sustained drop below 107K could temporarily shift momentum, but so far, there’s no structural damage visible.
Analysis By @TraderRahulPal (TradingView Moderator)
If this structure analysis helped you, like and follow for more insights on BTC’s long-term cycles.
Disclaimer: This analysis is for educational purposes only and should not be taken as financial advice. Please do your own research or consult your financial advisor before investing.
Bitcoin Correction = Smart Money Opportunity, ready for 3% move!Bitcoin (BTCUSDT) has been consolidating inside a well-defined descending channel , reflecting a healthy correction phase after the recent rally. While many traders panic in these phases, experienced players know that corrections are temporary, structures define direction.
Notice how price is approaching a key zone between 117K–116K, which aligns perfectly with both the lower channel boundary and the prior breakout retest zone. This area acts as a high-probability reversal zone , where strong hands are likely waiting for confirmation candles to re-enter the trend.
Psychologically, the 120K round level remains crucial. Expect volatility near this zone, as retail traders get trapped while smart money positions itself quietly before the breakout.
Once the breakout sustains above 121K, short-term traders could target levels around 122.5K–123K , while positional traders may aim for much higher structural targets.
Rahul’s Tip:
Never fear a pullback when structure stays intact, institutions use these dips to accumulate while the public exits too early. Stay patient, let the structure play out.
Analysis By @TraderRahulPal (TradingView Moderator)
If this breakdown and re-entry logic helped you, don’t forget to like and follow for regular updates.
Disclaimer: This analysis is for educational purposes only and should not be taken as financial advice. Please do your own research or consult your financial advisor before investing.
