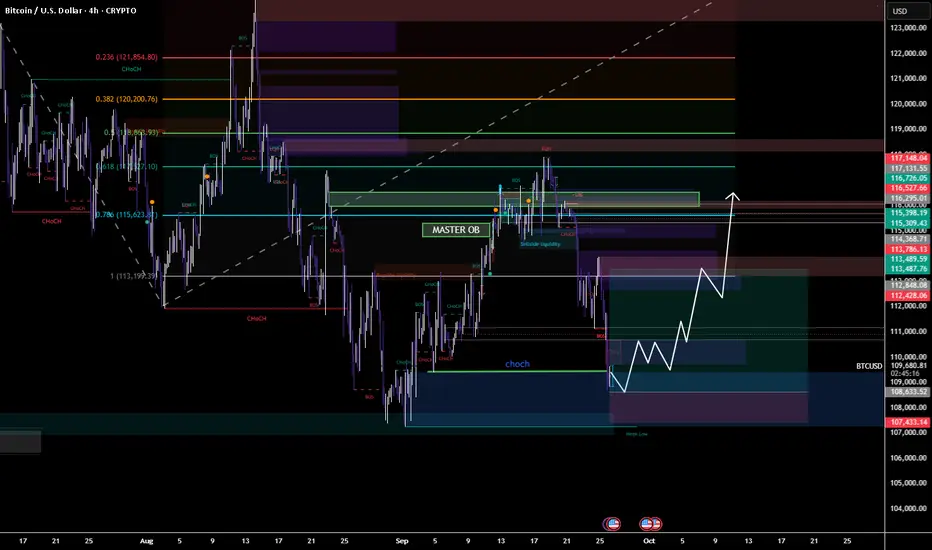
BTC Bulls Eyeing a Reversal From Liquidity SweepBTC Bulls Eyeing a Reversal from Liquidity Sweep”
📌 Description:
Bitcoin swept downside liquidity near 108k, tapping into a demand zone. If this level holds, expect a strong recovery toward the 113.5k–116.5k supply zones, with the Master OB acting as a key magnet for price.
📈 Trade Plan (4H BTCUSD)
🔹 Entry Zone (Long):
108.0k – 109.0k (liquidity sweep + demand zone).
🔹 Stop Loss (SL):
Below 107.0k (weak low / invalidation).
🔹 Take Profit (TP):
TP1: 112.4k (minor FVG close)
TP2: 113.8k – 114k (OB retest zone)
TP3: 115.5k – 116.2k (major supply / Master OB)
🎯 Risk-to-Reward (approx):
Entry: 108.5k
SL: 107k (≈ -1.5k / -1.3%)
TP1: 112.4k (≈ +3.9k / +3.6%) → RR ≈ 1:2.7
TP2: 114k (≈ +5.5k / +5%) → RR ≈ 1:3.8
TP3: 116.2k (≈ +7.7k / +7.1%) → RR ≈ 1:5.2
⚡ Clean long setup: liquidity sweep → bullish CHoCH → push into OB/supply above.
Marketstructure
How to Spot Trend Changes Using Simple Market StructureMastering Market Structure: Where to Find the Best Trading Setups in line with simple observation done using Price action .

AUDNZD Trading Idea – Momentum & Liquidity OutlookThe pair has been in a clear expansion phase, showing strength after multiple structure breaks. Momentum has favored the upside, while recent consolidation reflects market participants taking profits and rebalancing orders.
A corrective wave appears to be unfolding, which is typical after strong impulsive moves. Such phases often allow liquidity collection before the next directional expansion. The broader sentiment suggests that buyers are still active, but short-term volatility may create temporary pullbacks.
Educational Note: Markets move in cycles of impulse and correction. Recognizing these phases helps traders avoid chasing moves and instead prepare for continuation opportunities once the correction stabilizes.

Monthly Descending Triangle & False BreakdownA descending triangle on the monthly chart shows lower highs converging toward a flat support, reflecting mounting seller pressure and key institutional interest at the horizontal base
The red counter trendline highlights corrective rallies within the broader down-sloping resistance.
The red demand zone marks where significant buying absorbed prior declines, offering a structural support area.
The white box illustrates a false breakdown below support—a liquidity-grab that shook out weak hands before a swift recovery—demonstrating how professional traders engineer stop-hunts to secure favorable entry levels.
This interplay of pattern, trendlines, demand zone, and false breakdown underscores how market structure and institutional tactics shape price action—key for informed, risk-defined decisions.
Disclaimer: For educational purposes only. Not investment advice. Risk management and independent research are vital.
Perfect Symmetrical Triangle Chart Pattern💡 Chart Pattern Education
Symmetrical triangles are powerful continuation patterns that form when buyers and sellers reach equilibrium. The converging trendlines create a coiling effect, building pressure for the next major directional move. Studies show 68-75% success rate when traded with proper volume confirmation.
⚡ Matching the Chart shown and the above definition
✅ Higher lows trend intact on support trendline
✅ Lower highs forming clean resistance line
✅ Consolidation phase showing market indecision
✅ Volume declining as expected in triangle patterns
✅ Multiple timeframe confirmation visible
Disclaimer:
This analysis is for educational and informational purposes only and does not constitute financial advice or a recommendation to buy or sell any security. Trading involves risk, and past performance is not indicative of future results. Traders should conduct their own due diligence and consider their risk tolerance before making any trading decisions
Supply to Demand Flip Explained! | Spot High-Probability Zones Ever wondered how smart traders catch the perfect entries? 🤔
In this video, I break down the Supply-Demand Conversion Zones—where Supply turns into Demand and vice versa. With real chart examples .

Learn Option TradingOption trading is buying and selling contracts that give you the right (but not the obligation) to buy or sell a stock at a specific price before a certain date.
There are two types:
Call Option: You expect the stock price to go up.
Put Option: You expect the stock price to go down.
It’s like booking a movie ticket in advance—you can go if you want, but you don’t have to.

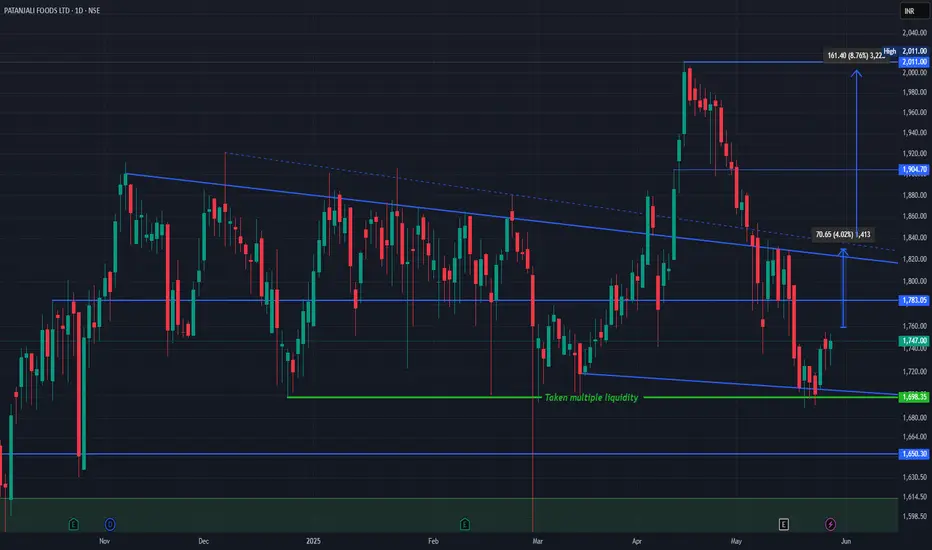
Patanjali Foods Ltd (NSE: PATANJALI) technical chart breakdown.Patanjali Chart Structure & Price Action
The stock has been trading within a descending channel, bounded by the blue trendlines.
It recently bounced from a major demand zone (~₹1,698) marked by the green support line that has absorbed liquidity multiple times ("Taken multiple liquidity").
Price is now slowly recovering from this base.
Current Scenario
CMP: ₹1,747
Immediate Resistance:
₹1,783 (horizontal level)
₹1,818–₹1,835 zone (upper boundary of the falling channel)
Break and sustain above ₹1,783–₹1,835 could trigger a trend reversal.
Upside Targets
Target 1: ₹1,830/Target 2: ₹1,904
Previous structural high Target 3: ₹2,011 Recent swing high Total upside from breakout: ~8.76%
Support Levels
₹1,698 – Critical demand zone (green)
₹1,650 – Next strong support
₹1,570 – Long-term support base (green zone)
Simple Explanation
Patanjali Foods rebounded from a high-liquidity support area and is now showing signs of bullish recovery. A breakout above ₹1,783 could take it back to the ₹1,900–₹2,000 range. Risk is well-defined below ₹1,698. Watch for volume and price action confirmation near the upper channel.
Like, comment your thoughts, and share this post
Explore more stock ideas on the right hand side your feedback means a lot to me!
Disclaimer: This post is for educational purposes only and should not be considered a buy/sell recommendation.
CHoCH + FVG = Institutional Entry Point for Option Traders!Hello Traders!
Today, we’re diving into one of the most powerful Smart Money Concepts — combining CHoCH (Change of Character) with FVG (Fair Value Gap) to identify high-probability institutional entry zones. This setup works brilliantly for both equity and option traders , especially when you want to catch the move before the breakout.
What is CHoCH (Change of Character)?
CHoCH occurs when the market shifts from a bearish to bullish structure or vice versa. It marks the first sign that market structure is shifting , and smart money is potentially stepping in.
What is a Fair Value Gap (FVG)?
An FVG is an imbalance between buyers and sellers. When price moves sharply in one direction, it leaves behind an area (usually 1-2 candles) with no trading activity — that’s the gap smart money fills later to enter or add positions.
Why This Combo Works Like Magic
CHoCH gives confirmation that market direction is changing.
FVG gives the entry zone where big players are likely to buy or sell again.
High Risk-Reward : You’re entering close to where institutions enter — not chasing breakouts.
Ideal for Option Traders looking for momentum entries at discounted zones.
How to Trade This Setup
Wait for a CHoCH on the 5min/15min chart.
Mark the FVG zone created after CHoCH.
Enter near the FVG zone with confirmation (rejection candle, volume spike, or VWAP bounce).
Place stop loss below the FVG and target swing high or based on option premium chart.
Rahul’s Tip
Don’t just chase the breakout. Learn to identify where smart money accumulates before the rally. CHoCH + FVG = sniper-level precision for option scalpers.
Conclusion
This setup is becoming a go-to for institutional-style intraday traders. It’s clean, logical, and extremely efficient when executed with discipline. Start spotting these patterns and backtest your entries — you’ll be amazed by the results!
Have you tried CHoCH + FVG before? Let me know your experience in the comments!

The Importance of Trading in a Higher Timeframe Context!Hello Traders!
Are you stuck in choppy price action and fakeouts on smaller timeframes? It might be because you’re ignoring the higher timeframe structure . Today, let’s understand why trading in alignment with higher timeframe context is critical for consistent and confident trades.
Why Higher Timeframe Analysis Matters
Bigger Picture Clarity: Higher timeframes (like Daily or Weekly) show the overall market structure — trend direction, key levels, and momentum.
Avoid Fake Breakouts: What looks like a breakout on the 5-min or 15-min chart could be a mere wick or pullback on the higher timeframe.
Supports Better Risk-Reward: Identifying entries aligned with higher timeframe trends allows better positioning with less chop.
Stronger Levels Hold Better: Support/resistance from higher timeframes are more respected and reliable.
Improves Confidence: When your intraday trade aligns with the larger trend, you’ll trust your entry and avoid premature exits.
How to Use Higher Timeframe in Your Trades
Start from Top-Down: Begin with Weekly → Daily → 1 Hour → then your entry timeframe (15-min/5-min).
Mark Key Levels: Identify strong support/resistance, swing highs/lows, and trendlines from higher charts.
Align Direction: Look for trades in the direction of the higher timeframe trend. Avoid counter-trend setups unless there's a confirmed reversal.
Watch for Confluence: If a smaller timeframe entry matches a higher timeframe level or pattern, it adds confluence and strength to the setup.
Rahul’s Tip
“Smart traders zoom out before they zoom in.” Always trade in the direction of strength. Let the higher timeframe guide your intraday story.
Conclusion
The higher timeframe is your GPS — it gives direction, structure, and clarity. Without it, you’re just reacting to noise. Start integrating top-down analysis into your daily routine, and you’ll see a big shift in your trade quality.
Do you check higher timeframes before trading? Let’s talk in the comments!

How I Find the Best Intraday Index Option Trades in Nifty?Hello Traders!
Intraday index option trading, especially in Nifty, BankNifty, and FinNifty , offers huge opportunities — but only if you know where to look. Many traders get stuck in random trades with no direction or clarity. So today, I’m sharing my personal step-by-step process to filter high-probability intraday trades using logic, price action, and data — not guesswork.
Step-by-Step Process to Find the Best Trades
Step 1: Pre-Market Range Marking
Mark the previous day’s high, low, close, and CPR levels . These zones are crucial for early directional bias.
Step 2: First 15-Min Candle Clue
Watch how the first 15-min candle forms. Break above/below with strong volume? Possible breakout trade setup. Inside range? Wait for confirmation.
Step 3: Track OI Changes in Live Market
Monitor real-time Open Interest build-up and shift on strikes near current price. If PE buildup rises and price sustains, it’s bullish. CE buildup with resistance? Bearish.
Step 4: Volume + Price Confirmation
Enter only when volume supports the breakout or reversal — especially around key levels like VWAP, PDH, PDL, or CPR .
Step 5: Entry, SL & Target
Entry: After confirmation candle (e.g., bullish engulfing above resistance)
SL: Below the candle or technical level (not random)
Target: Based on next resistance/support or 1:2 RR minimum
Bonus Tips for Index Option Trading
Avoid Mid-Day Chop: The best trades usually come between 9:30–11:30 AM or post 1:30 PM.
Avoid Buying Options in Low VIX: Use ATM options when VIX is low. Go slightly OTM only if momentum is strong.
Always Respect Trend Days: Don’t fight the trend. Use 5min + 15min structure to confirm bias.
Rahul’s Tip
Don’t chase price. Let it come to your level, show volume + structure, and then strike with confidence. Smart intraday trading is about planning, not reacting.
Conclusion
The key to finding great intraday index trades is structure + confirmation . Avoid impulsive trades, rely on price action, OI data, and volume analysis , and execute with proper risk management. That’s how consistent profits are built — not on luck, but logic.
Do you have a personal rule for selecting intraday index trades? Let’s share and grow together in the comments!

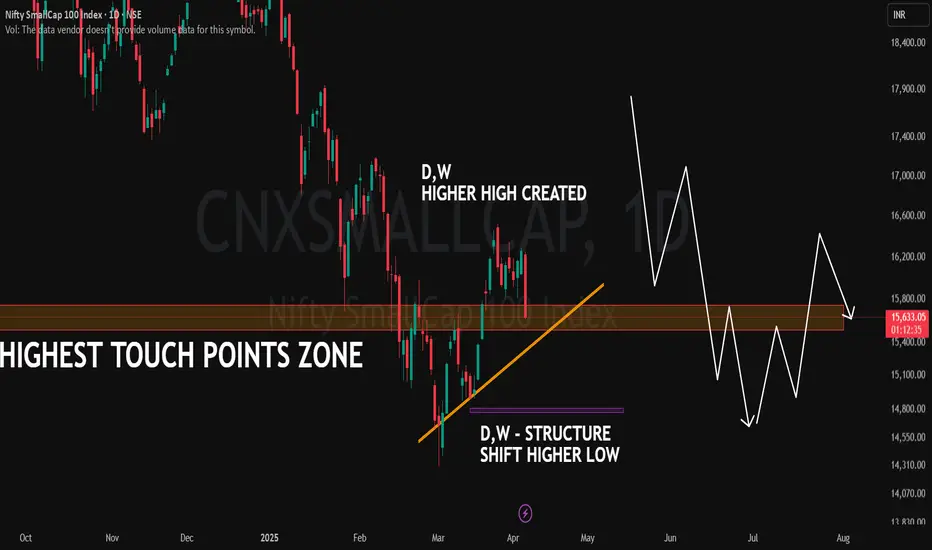
Nifty SmallCap 100 | Key Structural Zone 📊 Index: Nifty SmallCap 100 (NSE)
📉 CMP: 15,633 (-3.22%)
Chart Breakdown:
🔶 Highest Touch Points Zone: A key historical level where price has reacted multiple times.
📈 Higher High Created (D,W): Price has formed a higher high on both daily and weekly timeframes, indicating a shift in structure.
🟠 Trendline Support (Orange Line): A rising trendline acting as dynamic support.
🟣 Higher Low Structure (D,W): A significant shift where a higher low was established on daily and weekly charts.
The price is currently interacting with a crucial zone, making it a significant area to observe.
Don’t Trade Without Seeing This Indicator!Hello Traders!
If you’ve ever placed a trade only to get stopped out just before the move you predicted actually happens — you’re not alone. What if I told you that using just one key indicator could dramatically improve your entry timing, confirmation, and overall win rate ?
Today, we’ll break down an underrated but powerful indicator that can become your edge in the markets.
The Indicator: Volume + Price Action Confluence
Why It Matters:
Volume shows real interest behind price movement . Without volume confirmation, price can lie — especially during fake breakouts or traps.
When to Use It:
Apply it when price is approaching key levels like support/resistance, breakouts, or trendline re-tests . Combine volume with candle confirmation to avoid traps.
What to Watch For:
High volume on breakout = strength
Low volume breakout = trap
Increasing volume in pullbacks = accumulation/distribution
How to Use It for Better Trades
Breakouts:
Enter only when price breaks out with strong volume. Avoid low-volume moves — they often reverse.
Reversal Zones:
Look for climax volume candles with wick rejections . These often signal turning points.
Trend Confirmation:
Volume rising with trend = healthy move
Volume fading = potential exhaustion or reversal
Divergence with Price:
Price making new highs but volume dropping? That’s a warning sign to not chase.
Rahul’s Tip
Volume is like a lie detector test for price action. Use it alongside your levels, patterns, and structure — it’ll save you from chasing fake setups.
Conclusion
Don’t trade blind. Whether you’re a scalper, swing trader, or positional investor, volume + price action is a game-changer when applied correctly. It filters noise, confirms intent, and gives clarity in chaos.
What’s your favorite indicator and how do you use it? Let’s learn from each other — drop it in the comments!

Smart Money Trendline Liquidity Trap Strategy!Hello Traders!
Ever been stopped out right after a trendline breakout — only to watch the price reverse in your direction later? That’s not bad luck — that’s a Smart Money Liquidity Trap in action. Today, let’s uncover how big players use trendlines to trap retail traders and how you can flip the script using this powerful strategy.
What Is a Trendline Liquidity Trap?
The Setup:
Smart Money knows retail traders love clean trendlines. So, they allow price to break above or below these lines, creating the illusion of a breakout.
The Trap:
Once breakout traders enter, Smart Money triggers liquidity grabs (stop hunts) to fill large orders at premium prices. The market then quickly reverses direction.
The Confirmation:
True move begins after fake breakout fails and price reclaims the trendline or breaks structure in the opposite direction — that’s your signal.
How to Trade the Trap (Smartly)
Mark the Trendline:
Draw trendlines that connect at least 2–3 swing points. Watch for liquidity build-up above/below them.
Wait for the Fakeout:
Don’t jump in on first breakout. Let price break the trendline and observe for fast rejection or imbalance zone re-entry .
Enter on Confirmation:
Once the trap is clear, look for engulfing candles, FVG reactions, or BOS (break of structure) in the opposite direction.
Risk Management:
Keep SL above the trap high/low. Target liquidity zones on the other side — often you’ll get 1:2 or 1:3 RR setups .
Rahul’s Tip
Smart Money needs retail traders to enter first. Don’t be their liquidity. Instead, wait, watch, and enter when they’ve shown their cards.
Conclusion
The Smart Money Trendline Trap Strategy helps you stop trading like the crowd and start trading like the pros. By recognizing fakeouts and understanding liquidity manipulation, you’ll position yourself on the right side of the market moves .
Have you experienced fakeouts on trendlines? Let’s talk in the comments and grow together!

Nicholas Darvas: The Dancer Who Became a Trading Legend!Hello Traders! Imagine going from being a professional dancer to one of the most successful traders of all time! That’s the story of Nicholas Darvas , a self-taught trader who turned $25,000 into $2.25 million in just a few years using his famous Darvas Box Trading Strategy . His journey proves that you don’t need to be a Wall Street expert to make it big in trading! Let’s dive into his trading principles and strategy.
1. Who Was Nicholas Darvas?
Darvas was a professional dancer who stumbled into the stock market while touring the world.
He developed a technical approach to trading , known as the Darvas Box Theory , which helped him ride strong trends and avoid noise.
Without any insider knowledge, he used chart patterns, price momentum, and volume breakouts to make millions in the market.
2. Darvas’ Key Trading Principles
Follow the Trend: Darvas only bought stocks in strong uptrends. He believed in riding momentum rather than predicting reversals.
Ignore Market Noise: He didn’t listen to news, tips, or opinions —only price action and volume mattered to him.
Let Winners Run, Cut Losers Quickly: He never sold his winning stocks early and immediately exited losing trades without hesitation.
Use Stop-Losses & Protect Capital: Darvas always set stop-losses below key levels to avoid deep losses.
Only Trade High-Volume Stocks: He focused on stocks that showed strong volume spikes, as these indicated institutional interest.
3. The Darvas Box Trading Strategy
Identify a Stock in a Strong Uptrend: Darvas looked for stocks that were consistently making new highs with rising volume.
Draw a "Box": He identified support and resistance levels , creating a box around price action.
Buy on Breakout: He entered only when price broke above the box’s resistance level, signaling a continuation of the uptrend.
Set a Stop-Loss: His stop-loss was placed just below the support level of the box.
Sell When the Trend Weakens: If price broke below the lower boundary of the box, he exited immediately.
4. What Traders Can Learn from Darvas
Price Action is King: You don’t need complex indicators— price and volume are enough.
Stick to Strong Stocks: Focus on high-momentum stocks rather than chasing random trades.
Discipline Beats Emotion: Trade with a clear system , don’t rely on market opinions.
Have a Risk Management Plan: Always use stop-losses and protect your capital.
Trend Trading Works: The best profits come from riding big trends—not predicting tops and bottoms.
Conclusion
Nicholas Darvas’ journey from a dancer to a millionaire trader proves that anyone can succeed in the stock market with the right strategy, discipline, and risk management. His box trading strategy is still used by traders today, helping them ride trends and maximize profits while minimizing risk.
Have you tried the Darvas Box strategy? Let’s discuss in the comments!

Mastering Fractals: The Secret Weapon of Smart Traders!Hello Traders! Have you ever noticed that market patterns repeat across different timeframes? That’s where Fractal Theory comes in! Fractals are self-repeating patterns that occur at both micro and macro levels, helping traders spot trend reversals, breakouts, and entry points. Today, let's explore how to use fractals in price action trading to refine our strategy and improve accuracy!
1. What Are Fractals in Trading?
Fractals are recurring price patterns that signal potential reversals in the market.
These patterns consist of five or more candlesticks , where the middle candle is either the highest (bearish fractal) or lowest (bullish fractal) in a sequence.
Fractals help traders identify support, resistance, and trend shifts with better precision.
2. How to Identify a Fractal in Price Action?
Bullish Fractal: A price formation where the middle candle has the lowest low , surrounded by two higher lows on both sides.
Bearish Fractal: A price formation where the middle candle has the highest high , with two lower highs on both sides.
Multiple Timeframe Analysis: Fractals appear on all timeframes (from 1-minute to weekly charts), making them useful for scalpers, swing traders, and long-term investors.
3. How to Trade Using Fractal Theory?
Trend Confirmation: Combine fractals with indicators like Moving Averages, RSI, or Fibonacci levels to confirm trend direction.
Entry & Exit Signals: A bullish fractal near support may signal a buying opportunity , while a bearish fractal near resistance may indicate a potential sell signal .
Breakout Trading: Use fractals to spot breakout zones —when price breaks a previous fractal high (bullish) or low (bearish), it can confirm a new trend direction.
Stop-Loss Placement: Set stop-losses below bullish fractals (for buy trades) and above bearish fractals (for sell trades) to manage risk effectively.
Combine with Smart Money Concepts (SMC): Fractals align well with liquidity grabs, order blocks, and institutional moves , making them even more powerful when used with smart money trading techniques.
4. Limitations & Risk Management
Fractals are lagging indicators —they only confirm after the pattern has completed.
False signals can occur , so always confirm with volume, trend structure, or additional indicators.
Use risk-reward ratios wisely —never rely solely on fractals without a solid trading plan and stop-loss strategy.
Conclusion
Fractal Theory helps traders identify high-probability setups , confirm trend reversals , and improve trade entries & exits. By combining fractals with other technical analysis tools , traders can increase their accuracy and reduce market noise.
Have you ever used fractals in your trading? Let’s discuss in the comments!

Market Structure Shift: How to Spot Trend Reversals EarlyHello Traders! Spotting trend reversals early can be a game-changer in trading. A Market Structure Shift (MSS) occurs when price action transitions from an uptrend to a downtrend (or vice versa), giving traders a heads-up before major moves happen. Learning how to identify these shifts early can help you avoid traps and catch high-probability setups. Let’s break it down!
1. What is a Market Structure Shift (MSS)?
A Market Structure Shift (MSS) is when price transitions from a clear trend into a potential reversal.
It usually occurs when the price breaks a key level of support or resistance and fails to continue in the original trend.
MSS is often confirmed when price action starts forming lower highs & lower lows (bearish shift) or higher highs & higher lows (bullish shift).
2. How to Identify a Trend Reversal Early?
Break of Market Structure (BMS): When price breaks a recent swing high (in a downtrend) or a swing low (in an uptrend), it signals a shift in market sentiment.
Liquidity Grab & Stop Hunts: Smart money often pushes price beyond key levels to trigger stop-losses before reversing the trend.
Volume Confirmation: A real market structure shift is supported by increased volume , confirming strong buying or selling interest.
Failure to Make New Highs/Lows: If a trend starts struggling to create fresh highs in an uptrend (or fresh lows in a downtrend ), it indicates a weakening trend.
Moving Average Crossovers: When short-term moving averages (like 9 EMA or 21 EMA) cross below long-term ones (like 50 EMA), it can indicate a structural shift.
Divergence in RSI or MACD: If price makes a higher high , but RSI/MACD makes a lower high , it suggests momentum is weakening , hinting at a potential reversal.
3. How to Trade a Market Structure Shift?
Wait for Confirmation: Don’t enter immediately—wait for price retest or rejection at key levels.
Use Stop-Loss Wisely: Place stop-loss above the previous high (for short trades) or below the previous low (for long trades) to manage risk effectively.
Combine with Other Indicators: MSS is more powerful when used alongside support/resistance, volume analysis, and Fibonacci levels.
Look for Retests: Often, price will retest the broken structure level before continuing in the new trend. This gives a better risk-to-reward entry.
Trade with the New Trend: Once MSS is confirmed , look for pullbacks and enter in the direction of the new trend.
Conclusion
Understanding Market Structure Shifts helps traders stay ahead of trend reversals and avoid getting caught in bad trades. By combining price action, volume, and technical indicators , you can spot reversals early and execute high-probability setups.
Have you ever used market structure shifts in your trading? Let me know in the comments! 👇

Mastering Market Structure: The Perfect Swing Trade SetupUnderstanding actionable areas is the key to profitable trades. This chart shows how to identify a strong zone and apply your setup at the right time rather than chasing trades blindly.
A Resistance Identified: A breakout attempt, but this is a strong resistance.
B Breakout Confirmed & Sustained: The price successfully sustains above the resistance.
C Reversal Signal: The price starts falling, hinting at a correction.
D Breakdown or Fake Breakdown? The whole level is broken, but this could be a trap.
E Regaining the Zone: The price reclaims the level, signaling a potential high-probability trade setup.
The Strategy?
A failed breakout followed by a sustained breakout.
A retest of the support zone and a breakdown.
A strong comeback reclaiming the level, making it a perfect swing/positional trade opportunity IF your setup aligns.
🔥 Actionable Insight: Don't just enter at any breakout or breakdown—wait for confirmation in key zones. If your setup matches, this is where the best trades happen!

Nifty laying traps... another one for sellers...Hello Traders!
The market is constantly trapping sellers without moving to the downside. Right now, nothing in draw on liquidity is obvious. It, frankly, can go either ways . And what does it mean when we can frame both sides of market using ICT concepts? It means that we have LOW PROBABILITY conditions . I'm sitting on the sidelines until the market gains clarity, favouring buyside delivery.
As long as the invalidation low of 22725 holds, my bias would remain bullish . Once that low is taken, I'm not interested in price and would wait for the market to provide more info.
When it looks that it can go either ways, the market structure gets filthy and PRECISION leaves the chat. WAIT FOR MORE CLARITY . Or gamble . It's absolutely your choice .
Have a safe trading day.
GLGT.

Godfryphlp changing trend with high volumes on daily chart.godfryphlp can be seen crossing a major resistance at 5572 on daily chart. which has now become its immediate support. important thing to notice that the stock has broken the downward trend line and giving a significant close above 5572 level with high volume. Stock was at upper circuit on second half of trading session of 14/02/2025 . Reason behind such a move was the Q3 result was extremely good. Further the stock is expected to move to its next resistance level that is R1 6179 with immediate support of S1 5572 .

Price action analysis that will give you edge over othersI daily make educational content videos for swing / positional trading

Database Option Trading Options are highly sensitive to market volatility. Significant price swings can lead to substantial gains or losses. A trader might buy a put option expecting a stock to drop. If the stock instead surges in price due to unforeseen events, the value of the put option plummets.
Call options give buyers the right, but not the obligation, to buy a stock for a fixed price, on or before some date. Buying call options on a stock can be more profitable — but also more risky in percentage-change terms — than buying that stock itself.

Option Trading with Option chainOption chains provide specific data related to options contracts, including strike prices, expiration dates, implied volatility, and open interest. Traders use this data to construct options strategies, manage risk, and profit from price movements in the underlying asset.
Top options trading strategies
Covered call. A covered call is a popular options strategy where you own a stock and simultaneously sell a call option on the same stock. ...
Married put. ...
Bull call spread. ...
Bear put spread. ...
Protective collar. ...
Long straddle. ...
Long strangle. ...
Long call butterfly spread.
