Mazagon Dock Shipbuilders Ltd. - Stock AnalysisDate : 17-Sep-2025
LTP : Rs. 2,997
Technical View:
• NSE:MAZDOCK is in primary uptrend since Apr 2024 and was recently going through it's secondary downtrend within the primary uptrend.
• From it's all time high of 3,775 on 29-May-2025, it has retraced 31% to 2,589 on 1-Sep-2025 which is also close to Fibonacci retracement level 0.786 placed at 2,537.
• NSE:MAZDOCK has breakout from it's secondary downtrend on 10-Sep-2025. Volume has also increased in last few sessions.
• NSE:MAZDOCK has closed above 20 DEMA and 50 DEMA on 12-Sep-2025 and is trading above 20 DEMA and 50 DEMA since last few sessions.
• MACD has crossed over 0 and entered into bullish zone. It is trading at 29.87.
• RSI has crossed over 50 and trading in buy zone at 67.54.
• Both MACD and RSI are showing positive divergence, indicating trend reversal.
• Looking good to start a new swing from here.
• Resistance Levels : (R1) Rs. 3,369 --> (R2) Rs. 3,775 --> (R3) Rs. 4,500
• Support Level : Rs. 2,589
If you have liked this analysis, please Like/Boost this idea and follow me for more ideas.
Disclaimer : I am not a SEBI registered analyst/consultant and not recommending anyone to take any BUY or SELL position in stock market. Investing in stock market is risky and one should do a self analysis and validation before investing in stock market. My ideas are published for learning purpose only and are available to everyone at no cost/charge.
Mazagondockshipbuilders

MAZAGON DOCK ROUNDING BOTTOM BREAKOUTMazagon dock breaking rounding bottom
with huge volume, bullish RSI
defence sector in focus
#target 3250 after breaking 3150
NO BUY/SELL RECOMENDATION

Mazdock - Undocked after 8M Rounding BottomMazdock renowned shipbuilding company has constructed 801 vessels since 1960, including warships, submarines, cargo/passenger ships, and offshore platforms.
Order Book
As of Q2 FY25, the company’s total order book was Rs. 39,872 Cr, which includes 37 vessels scheduled for delivery.
Order Book Mix:
Shipbuilding: 70%
Submarine and Heavy Engineering: 30%
Fundamentals
Company has excellent fundamentals with ROE and ROCE above 20% and increasing. Negative working capital, Debt free, increasing sales and profit with dividend payout of around 29%. Stellar Operating profit margin and rising along with increase in stakes of both DII and FII in recent quarter.
Technicals
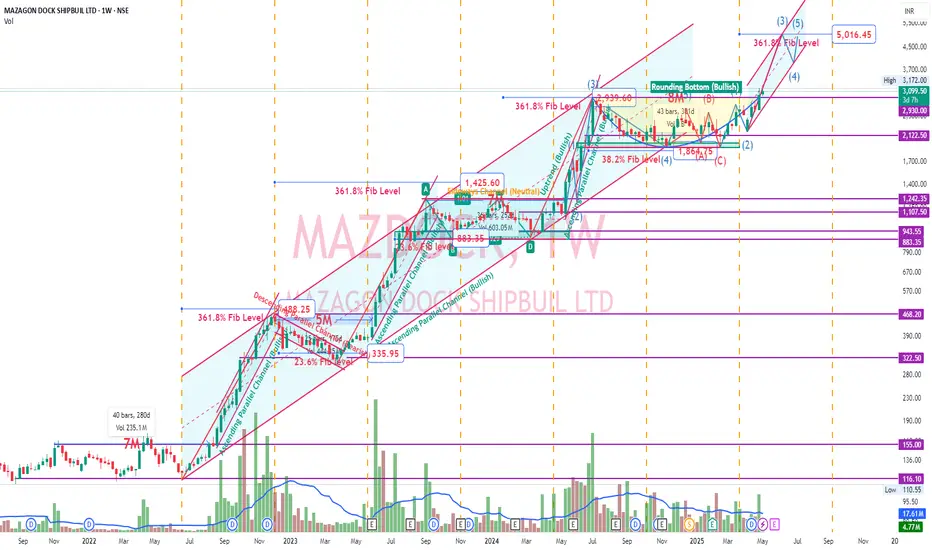
On observing the chart, We could witness stock roaring 100% atleast after every consolidation of around 5-8 months. History tend to repeat itself. Fundamentals are good. Overall aerospace and defense sector are in good position. Check that custom index chart which was published. Mazdock has the potential to reach 5K which is 361.8% Fib level. In past, it has always reached that fib level. Pivot R3 is also around 5278.45. We can also see that breakout of rounding bottom pattern has occurred.
Disclaimer: Learning Purpose
Mazagon Dock cmp 2445 by Weekly Chart viewMazagon Dock cmp 2445 by Weekly Chart view
- Support Zone at 1925 to 2000 Price Band
- Stock trying to sustain above the support zone for fresh upside
- Stock also attempting to cross over the falling resistance trendline
- Stock made back to back Bullish Rounding Bottoms or Cup & Handle, as one may interpret the chart view

Mazagon Dock Shipbuilders Ltd. - Breakout OpportunityDate : 5-Dec-2024
LTP : Rs. 4,880.70
Targets: (T1) Rs. 5,545 --> (T2) Rs. 5,860 --> (T3) Rs. 7,100
SL : Rs. 4,245
Technical View:
• NSE:MAZDOCK is in primary uptrend and was recently going through it's secondary downtrend within primary uptrend.
• After touching the high of 5,860 on 5-Jul-2024, it has retraced 34% to 3,851.20 level.
• NSE:MAZDOCK has breakout from it's secondary downtrend with higher than average volume on 4-Dec-2024. This breakout is also supported by increased volume in last few sessions.
• NSE:MAZDOCK have formed double bottom pattern between 3,851.20 and 4,925 levels. Breaking 4,925 level will also give breakout from double bottom pattern.
• Company has fixed 27-Dec-2024 as record date for 2/1 stock split. Target levels can be revised post stock split.
• NSE:MAZDOCK is trading above 20 DEMA and 50 DEMA since last few sessions. 20 DEMA has crossed over 50 DEMA on 2-Dec-2024.
• RSI is in buy zone and trading at 71.93. MACD is bullish and trading at 135.74.
• Both RSI and MACD are showing positive divergence.
• Looking good to start a new swing from here.
Liked the analysis? Boost/Like this idea and follow my ID.
Disclaimer: I am not a SEBI registered analyst/consultant and not recommending anyone to take any BUY or SELL position in stock market. Investing in stock market is risky and one should do a self analysis and validation before investing in stock market. My ideas are published for learning purpose only and are available to everyone at no cost/charge.

Mazagon Dock cmp 4594.15 by Daily Chart view*Mazagon Dock cmp 4594.15 by Daily Chart view*
- Support Zone 3840 to 3920 Price Band
- Resistance Zone 4820 to 4960 Price Band
- Price Breakout above Falling Resistance Trendline
- Weekly Support at 4325 > 3920 > 3550 with Resistance at 4960 > 5265 > 5550 > ATH 5860
- *Decent probability maybe anticipated to breach across the Resistance Zone by the way the Volumes are building up over the past few days*
