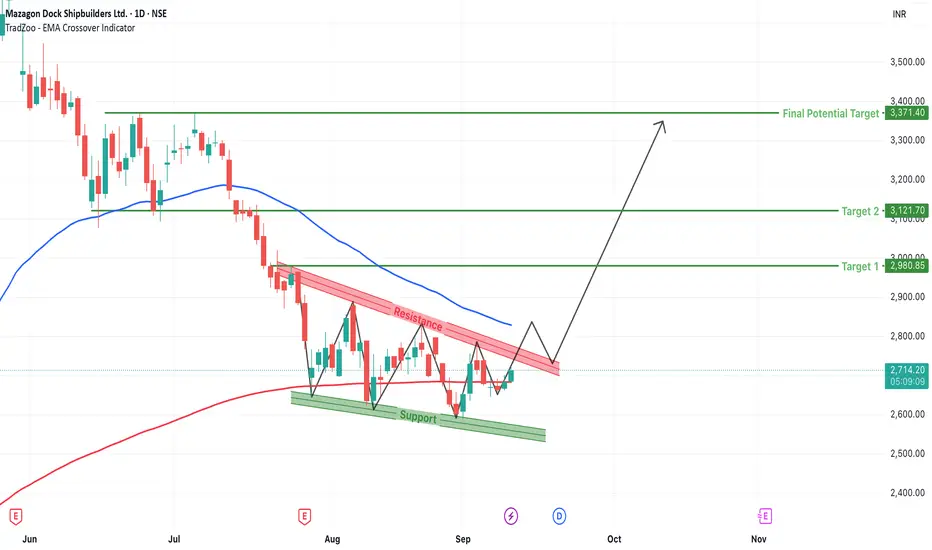
Mazagon Dock (MAZDOCK) Breakout Watch: Falling Wedge FormationMazagon Dock Shipbuilders Ltd., one of India’s premier shipbuilding companies, has recently shown signs of a technical breakout after months of downtrend. The stock had been consolidating within a falling wedge structure—a well-known bullish reversal pattern—and is now approaching a critical breakout zone that traders should closely watch.
Let’s analyze the technical setup in detail.
1. Formation of the Falling Wedge Pattern
The chart clearly highlights a falling wedge, which is formed by drawing two converging trendlines: one descending across the highs (resistance) and the other descending across the lows (support). The falling wedge is typically a bullish reversal pattern, especially when it forms after a prolonged downtrend—as is the case here.
From mid-June to early September, MAZDOCK trended lower, respecting the wedge boundaries. However, instead of a complete breakdown, price started finding support near the ₹2,500–2,600 zone, forming higher lows within the wedge—a subtle early sign of a reversal brewing beneath the surface.
2. Key Resistance and EMA Confluence
The immediate overhead resistance is defined by the upper boundary of the wedge, which is also in confluence with the 200-period EMA, currently placed around ₹2,830. This makes the ₹2,820–₹2,840 zone a crucial breakout level.
Once price convincingly breaks and closes above this level with volume confirmation, it could trigger a fresh upside rally. The current price action around ₹2,720 (+1.34%) on the breakout candle indicates building momentum.
3. Projected Targets After Breakout
Upon successful breakout, the measured move (based on wedge height) gives us three major targets:
Target 1: ₹2,980
This level is close to the psychological ₹3,000 mark and would be the first hurdle where partial profit booking may be considered.
Target 2: ₹3,121
A further extension of the breakout move. This level marks previous minor resistance and could act as a midpoint of the rally.
Final Potential Target: ₹3,371
This target is based on the maximum height of the wedge added to the breakout zone and also aligns with a historical resistance zone. A rally to this level would indicate complete bullish validation of the pattern.
4. Trade Setup for Traders
This breakout provides a favorable risk-reward opportunity for swing and positional traders. Here's a sample trade plan:
- Entry: On breakout and close above ₹2,830 (above wedge and EMA)
- Retest Entry: On pullback to ₹2,790–₹2,810 with confirmation candle
- Stop-Loss: Below ₹2,650 (invalidates the breakout structure)
- Targets: ₹2,980 / ₹3,121 / ₹3,371
- Risk-to-Reward Ratio: Approximately 1:2.5 to 1:3.5
5. Risk Management and Trader Tips
While this setup looks promising, wait for confirmation before jumping into the trade. Many false breakouts can occur, especially around key EMAs. Also, keep an eye on volume: a genuine breakout should be accompanied by higher-than-average volume.
Other tips:
Scale-in your position rather than going full size at entry.
Keep trailing your stop-loss as the price moves in your favor.
Monitor broader market indices for sentiment cues (Nifty, Bank Nifty).
6. Conclusion: A Reversal Candidate Worth Watching
Mazagon Dock has not only respected technical levels within the wedge but is also showing strength around a key resistance–EMA confluence zone. This kind of setup, supported by a classic pattern like the falling wedge, adds more credibility to the potential move.
With clear targets and a defined stop-loss zone, the current price structure offers a high-probability reversal setup. Patience is key—let the breakout confirm itself.
Mazgaondock
Flag Breakout: Mazgaon Dock Above 4500, Targeting 6000Details:
Asset: Mazgaon Dock Shipbuilders Limited (MAZDOCK)
Breakout Level: 4500
Potential Target: 6000
Stop Loss: Below 4500 or as per risk tolerance
Timeframe: Short to medium-term
Rationale: Mazgaon Dock has been consolidating in a channel since July 2024, and it has now broken out above the 4500 level. This flag breakout pattern suggests that the stock could see a strong upward move, potentially reaching 6000 in the coming weeks.
Market Analysis:
Technical Breakout: The stock has broken through the key resistance level of 4500, signaling the end of its consolidation phase and the start of a new bullish trend.
Consolidation Phase: The consolidation from July 2024 built strong technical support, and the breakout now opens up the potential for a sharp rally.
Price Target:
The initial target is set at 6000, based on the flag breakout pattern and historical price movements.
Risk Management:
A stop loss below 4500 is recommended to manage downside risk in case the breakout fails or the stock pulls back temporarily.
Timeframe:
The move toward 6000 is anticipated over the short to medium-term, depending on market sentiment and the strength of the breakout.
Risk-Reward Ratio: The setup offers a favorable risk-reward ratio, with significant upside potential to 6000 and a clear stop loss level near the breakout point.
This breakout presents a strong opportunity, but always ensure to assess risk, market conditions, and your own portfolio strategy before making decisions.

LONG SETUP IN MAZGAON DOCKA Bullish Flag and Pole Chart Pattern Breakout happened on the weekly Time frame of NSE:MAZDOCK
Price Action is well supported by the volume.
The stock is currently in uptrend making higher highs and higher lows.
One can add this stock into their stocks to buy list.
Initiate the long trade only according to the levels mentioned.
Stop loss will be on weekly closing basis.
Trend Analysis :- UP Trend
Chart Pattern :- Bullish Flag and Pole
Technical Indicator :- Positive MACD Crossover
